UNIVERSITÉ DU QUÉBEC
À
MONTRÉAL
UNEMPLOYMENT DURATION DURING THE 2008
RECESSION: A STATISTICAL ANALYSIS OF THE
CANADIAN EXPERIENCE
THESIS
PRESENTED
AS PARTIAL REQUIREMENT
OF MASTER IN MATHEMATICS
BY
LENIN ARANGO CASTILLO
UNIVERSITÉ DU QUÉBEC À MONTRÉAL Service des bibliothèques
Avertissement
La diffusion de ce mémoire se fait dans le respect des droits de son auteur, qui a signé le formulaire Autorisation de reproduire et de diffuser un travail de recherche de cycles supérieurs (SDU-522 - Rév.01-2006). Cette autorisation stipule que «conformément à l'article 11 du Règlement no 8 des études de cycles supérieurs, [l'auteur] concède à l'Université du Québec à Montréal une licence non exclusive d'utilisation et de publication de la totalité ou d'une partie importante de [son] travail de recherche pour des fins pédagogiques et non commerciales. Plus précisément, [l'auteur] autorise l'Université du Québec à Montréal à reproduire, diffuser, prêter, distribuer ou vendre des copies de [son] travail de recherche à des fins non commerciales sur quelque support que ce soit, y compris l'Internet. Cette licence et cette autorisation n'entraînent pas une renonciation de [la] part [de l'auteur] à [ses] droits moraux ni à [ses] droits de propriété intellectuelle. Sauf entente contraire, [l'auteur] conserve la liberté de diffuser et de commercialiser ou non ce travail dont [il] possède un exemplaire.»
UNIVERSITÉ DU QUÉBEC
À MONTRÉAL
DURÉE EN CHÔMAGE PENDANT LA RÉCESSION DE 2008:
UNE ANALYSE STATISTIQUE DE L'EXPÉRIENCE
CANADIENNE
MÉMOIRE
PRÉSENTÉ
COMME EXIGENCE PARTIELLE
DE LA MAÎTRISE EN MATHÉMATIQUES
PAR
LENIN ARANGO CASTILLO
ACKNOWLEDGEMENTS
First and foremost, I would like to express my deep gratitude to my advisor, Pro-fessor Sorana FRODA, whose expertise, understanding, patience, and generosity added to my graduate experience. She spent a lot of time getting permission to access to the database used in this Master thesis. I appreciate her vast knowledge and skill in many areas as well as being open persan to new areas.
For the academic, technical, and financial support, I thank the Department of Mathematics at the Université du Quebéc à Montréal, its professors and its staff.
I would also like to thank professor François WATIER and my supervisor for the time they spent writing reference letters on my behalf for my Ph. D. school application. I appreciate your support throughout this process.
I am grateful to professor Juli ATHERTON for her advice and encouragement. Moreover, I have greatly benefited from following her course in survival analysis.
Last, but by no means least, I thank my family and friends.
For any errors or inadequacies that may remain in this work, of course, the res-ponsibility is entirely my own.
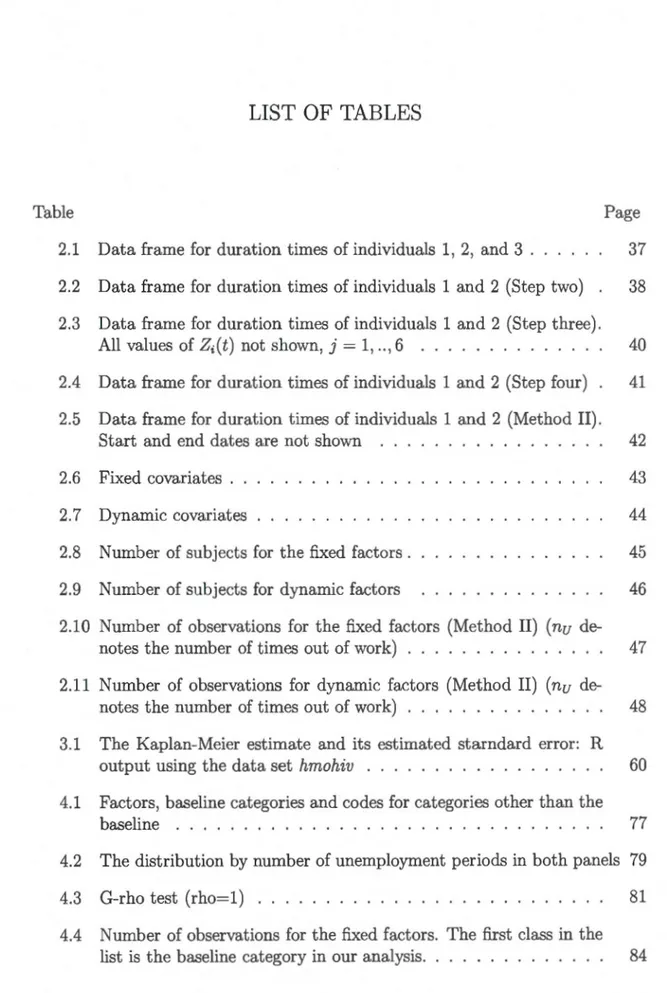
LIST OF TABLES . LIST OF FIGURES ABSTRACT RÉSUMÉ . . INTRODUCTION CHAPTER I
CONTENTS
THE GLOBAL CRISIS AND THE MAIN CHARACTERISTICS OF THE LABOUR MARKET . . . .
1.1 The crisis of 2008: an overview . . . . . . . . . . . . . . 1.2 The effects of the Global Crisis on Canada and the Canadian response CHAPTER II
THE DATABASES, DATA MANIPULATION, AND DESCRIPTIVE STATISTICS . . . . . . . .
2.1 The Labour Force Survey (LFS) . 2.1.1 Survey methodology 2.1.2 Data collection . . .
2.2 The Survey of Labour and Income Dynamics (SLID) 2.2.1 Survey design
2.3 Main definitions . . .
2.4 The Sample, Covariates, and Descriptive analysis 2.4.1 Theatment of the raw data .
2.4.2 Covariates . . . . 2.4.3 Descriptive Analysis Xl Xlll XV XVll 1 7 8 11 19 19 22 23 24
25
28 35 35 43 44Vlll
CHAPTER III
USEFUL METHODOLOGY: MAIN CONCEPTS IN SURVIVAL ANALYSIS 51 3.1 Notation, special features and main fonctions in survival analysis 52
3.1. l Survivor fonction and hazard fonction 3.1.2 Censoring . . . .
3.2 Non-parametric estimation .
3.2.l Kaplan-Meier (product-limit estimator) . 3.3 Comparing the survival of two groups .
3.3.1 Hypothesis testing procedures 3.4 Semi-parametric estimation . . . .
3.4.1 The Cox model: main idea.
3.4.2 Fitting the proportional hazard model 3.4.3 Residual analysis
3.5 Remarks on our data CHAPTER IV
DATA ANALYSIS 4.1 Method I . .
4.1.1 Non parametric estimation . 4.1.2 Semi-parametric estimation 4.1.3 Residuals
4.2 Method II . . . .
4.2.l Non parametric estimation . 4.2.2 Semi-parametric estimation 4.2.3 Residuals
4.3 Other analyses .
4.3.l Semi-parametric estimation 4.3.2 Residuals and conclusion . CONCLUSION . . . .
54
5657
58 61 62 65 66 68 70 71 75 78 79 83 88 8990
92 95 96 96 103 107lX
APPENDIX A. LOESS REGRESSION . . . . . . . . . . . . . . . 111 APPENDIX B. MODEL SELECTION . . . . . . . . . . . . . . . . . . 113 BIBLIOGRAPHY . . . . . . . . . . . . . . . . . . . . . . . . . . . . . . . 117
LIST
OF
TABLES
Table Page
2.1 Data frame for duration times of individuals 1, 2, and 3 . . . . . 37 2.2 Data frame for duration times of individuals 1 and 2 (Step two) 38 2.3 Data frame for duration times of individuals 1 and 2 (Step three).
AH values of Zi(t) not shown, j = 1, .. , 6 . . . . . . . . . . . 40 2.4 Data frame for duration times of individuals 1 and 2 (Step four) 41 2.5 Data frame for duration times of individuals 1 and 2 (Method II).
Start and end dates are not shown 42
2.6 Fixed covariates .. 43
2.7 Dynamic covariates 44
2.8 Number of subjects for the fixed factors . 45
2.9 Number of subjects for dynamic factors 46
2.10 Number of observations for the fixed factors (Method II)
(nu
de -notes the number of times out of work) . . . . . . . . . . . 47 2.11 Number of observations for dynamic factors (Method II)(nu
de-notes the number of times out of work) . . . . . . . . . . . . . . . 48 3.1 The Kaplan-Meier estimate and its estimated starndard error: R
output using the data set hmohiv . . . . . . . . . . . . . . . . 60 4.1 Factors, baseline categories and codes for categories other than the
baseline . . . . . . . . . . . . . . . . . . . . . . . . . . . . . . . . 77 4.2 The distribution by number of unemployment periods in both panels 79 4.3 G-rho test (rho=l) . . . . . . . . . . . . . . . . . 81 4.4 Number of observations for the fixed factors. The first class in the
Xll
4.5 Number of observations for dynamic factors. The first class in the list is the baseline category in our analysis. . . 85 4.6 Cox regression, "R" output for Method I when conditioning for
k
=
2 and more than 50 weeks in unemployment 874.7 The distribution of the factor Order. 90
4.8 Method II. Cox regression. 93
4.9 Cox regression for Panel 4 and k = 1 unemployment periods. 97 4.10 Cox regression for Panel 5 and k
=
1 unemployment periods. 98 4.11 Cox regression, Panel 4 and k=
2 unemployment periods. 99 4.12 Cox regression, Panel 5 and k= 2 unemployment periods.
100 4.13 Cox regression, Panel 4 and k = 3 unemployment periods. 101 4.14 Cox regression, Panel 5 and k= 3 unemployment periods.
102 4.15 Significant covariates for Panel 4 and Panel 5 103 B.1 Analysis of Deviance. Method I. Model presented in Table 4.6. 114 B.2 Analysis of Deviance. Method II. Madel presented in Table 4.8. 114 B.3 Analysis of Deviance for Panel 4 and k= 1 unemployment periods.
Madel presented in Table 4.9. . . 115
B.4 Analysis of Deviance. Panel 5 and k
=
1 unemployment periods.Model presented in Table 4.10. . 115
B.5 Analysis of Deviance. Panel 4 and k
=
2 unemployment periods.Madel presented in Table 4.11. . 115
B.6 Analysis of Deviance, Panel 5 and k
=
2 unemployment periods.Model presented in Table 4.12. . . . 116
B.7 Analysis of Deviance, Panel 4 and k
=
3 unemployment periods.Madel presented in Table 4.13. . 116
B.8 Analysis of Deviance, Panel 5 and k
=
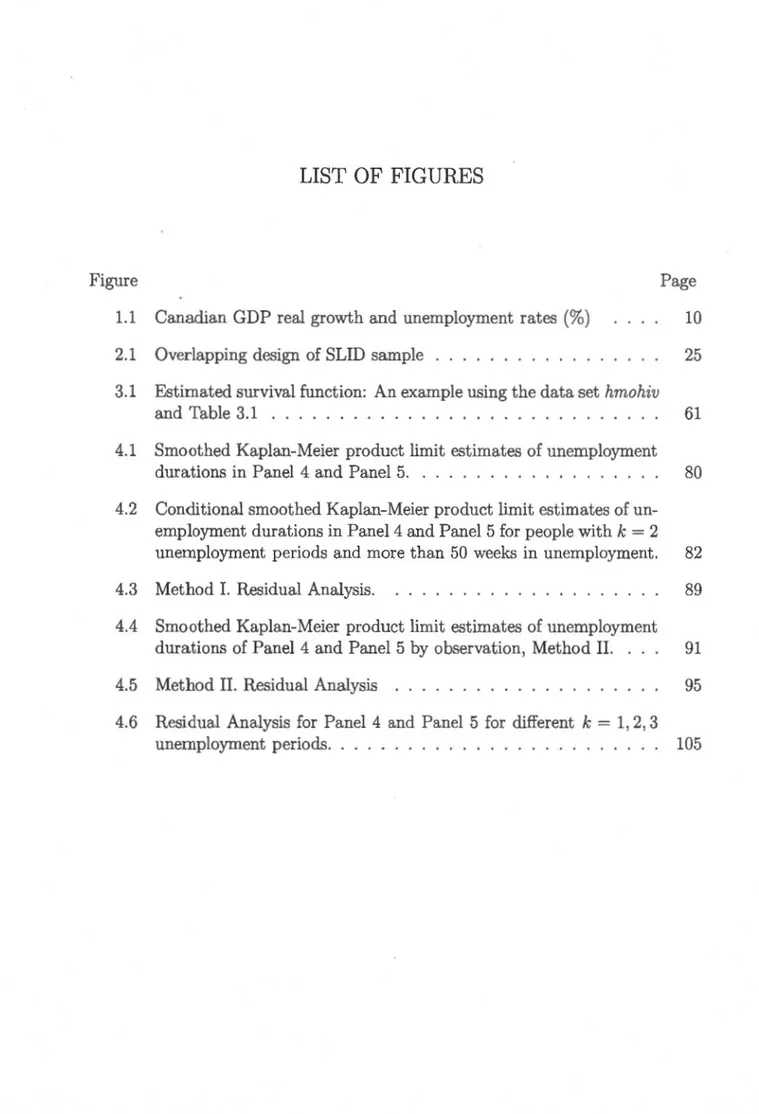
3 unemployment periods. Model presented in Table 4.14. . . . . . 116LIST OF FIGURES
Figure Page
1.1 Canadian GDP real growth and unemployment rates (%) 10 2.1 Overlapping design of SLID sample . . . . . . . 25 3.1 Estimated survival fonction: An example using the data set hmohiv
and Table 3.1 . . . . . . . . . . . . . . . . . . . . . . . . 61 4.1 Smoothed Kaplan-Meier product limit estimates of unemployment
durations in Panel 4 and Panel 5. . . . . . . . . . . . 80 4.2 Conditional smoothed Kaplan-Meier product limit estimates of
un-employment durations in Panel 4 and Panel 5 for people with k = 2 unernployment periods and more than 50 weeks in unemployment. 82
4.3 Method I. Residual Analysis. 89
4.4 Smoothed Kaplan-Meier product limit estimates of unemployment durations of Panel 4 and Panel 5 by observation, Method II. 91 4.5 Method II. Residual Analysis . . . . . . . . . . . . . . . . . 95 4.6 Residual Analysis for Panel 4 and Panel 5 for different k
=
1, 2, 3ABSTRACT
This Master thesis analyses the impact of the financial crisis that started in 2008 on unemployment duration in Canada, using the unweighted Survey of Labour and Incarne Dynamics (SLID) database. We perform a survival analysis after conditioning on the number of unemployment periods. It turns out that the sets of characteristics considered to explain the unemployment duration differ when the period covering the financial crisis is compared with a period before the crisis. We find weak evidence that individuals who entered unemployment during the financial crisis stayed for a longer time in unemployment than those who entered unemployment in a period preceding the crisis.
Key words: financial crisis, unemployment duration, SLID, survival analysis, Kaplan-Meier estimator, Cox regression, Cox-Snell Residuals.
RÉSUMÉ
Ce mémoire de maîtrise analyse l'impact de la crise financière qui a débuté en 2008 sur la durée au chômage au Canada, en se basant sur la base de données Enquête sur la dynamique du travail et du revenu (EDTR). On applique une analyse de survie en conditionnant selon le nombre de périodes de chômage. Il apparaît que l'ensemble de caractéristiques qui expliquent la durée au chômage est différent si on compare une période avant la crise avec une période qui couvre le début de la crise. Il y a aussi une faible indication que ceux qui sont allés au chômage pendant la crise sont restés plus longtemps au chômage que ceux qui sont entrés en chômage avant la crise.
Mots-clés : crise financière, durée au chômage, EDTR, analyse de survie, esti-mateur de Kaplan-Meier, régression de Cox, résidus de Cox-Snell.
INTRODUCTION
How much time did individuals spend in unemployment during the financial crisis
2008? How different is the unemployment duration observed in the 2002-2007 time window from the one observed in the period 2005-2010? How does the
duration in unemployment vary across individuals, region, age, gender, aboriginal status, visible minority status, immigration status and education levels? Answers
to questions such as these are needed for several reasons. First, unemployment can be a very unjust and undemocratic punishment. Often it hits disadvantaged
groups in society: the young, the unskilled, ethnie minorities or migrants. The long term unemployed not only lose their skills, they lose motivation, they fall
ill: in crude economic terms human capital is being depreciated. Second, the welfare of the unemployed is more closely related to the time they spend without a job than to the fact of their being unemployed. In this sense, the usual official
statistics i.e. the unemployment rate is a less useful statistic than the average
duration in unemployment. Third, the length of unemployment spells plays a critical role in the economic theories of job search. The unemployment duration is an important variable which can explain the changes in labour markets
and it is widely used in the job destruction and job creation models when an-alyzing the fiows between employment, unemployment and out of the labour force.
In specific terms, unemployment duration refers to the amount of time that an individual remains unemployed. During a recession both the unemployment rate
2
spending and financial solvency which requires specific labour market policies.
The effects of the 2008 crisis are still being felt, six years on. The Gross Domestic Product (GDP) is still below its pre-crisis peak in many rich countries, especially in Europe, where the financial crisis has evolved into the Euro crisis. The effects of the crash are still rippling through the world economy. Canada's financial system has been relatively less affected by the global financial crisis than those of other industrialized countries such as the United States and Great Britain. However, while the Canadian financial system seems to be doing relatively better than those of other countries, Canada's economy is nonetheless feeling the global economic slowdown. The economic difficulties experienced by its largest trading partner -the US- are resulting in weaker Canadian exports and further problems for the manufacturing sector. Moreover, the strong Canadian energy and natural resources sector is likely to suffer as the world economic slowdown brings about lower demand and weaker prices for commodities (Bergevin, 2008).
Although Canada has been relatively sheltered from the worst of the crisis, the impact of the economic slowdown in the US has affected, and will continue to affect, Canadian economy. For example, Canada's labour market recovery is not yet complete after the financial crisis, although it continues to outpace that seen in many other countries ( e.g. Spain, Greece, Ireland, the US, etc.) members of The Organisation for Economie Co-operation and Development (OECD). The unemployment rate, as defined by the International Labour Organization (ILO), was 7.13 in the first quarter of 2013, clown from a peak of 8.53 in the third quarter of 2009. According to the 2013 OECD Employment Outlook, the recovery will continue in Canada bringing unemployment clown to 6. 73 by the end of 2014, still moderately above its pre-crisis level of 6.13 (OECD, 2013). In
3
2012, Statistics Canada reported that the unemployment rate of youths aged 15
to 24 was 14.33, compared with a rate of 6.03 for workers aged 25 to 54 and workers aged 55 or older. The youth unemployment rate was 2.4 times that of
workers aged 25 to 54, the biggest gap recorded since 1977.
As previously mentioned, the unemployment rate, while certainly being one of the most closely watched economic indicators, offers on its own a rather incomplete picture of the labour market. An unemployment rate of say, 53 may express two very different realities: i) one is a situation in which 53 of the labour force
becomes unemployed each month and spends only a few weeks looking for a job, or ii) a case in which the same 53 of the labour force is unemployed for the entire year. In the first case the labour market is characterized by a great deal of
fluctu-ations with spells of unemployment not having serious consequences, while in the
latter we see a stagnant market with unemployment implying severe hardship. The implications of these two scenarios for the well being of the unemployed are very different. To accurately understand the situation requires a reliable
indi-cator of the average duration of a spell of unemployment (Corak and Reisz, 1995).
For these reasons, in recent years, various survival analysis and duration
tech-niques for modelling the length of unemployment spells and strike durations have gained popularity in the social sciences. This literature has drawn heavily
on statistical methodology developed largely in industrial engineering and in
the biomedical sciences. These methods have a natural application to many
economic problems. For example, seminal papers such as Econometric M ethods for the Duration of Unemployment (Lancaster and Nickell, 1980) or Estimating
the Probability of Leaving Unemployment (Nickell, 1979) propose and apply
4
mentioned papers were published, survival analysis has become a more common technique used in economics.
In this thesis we apply the survival analysis methodology to some Canadian public datasets to answer the questions mentioned above; in particular we use non-parametric and semi-parametric methods. These analyses identify the statistical effect of explanatory variables, .such as personal characteristics, on the exit rate out of unemployment. This in turn enables one to identify groups of
individuals with higher expected durations.
Two public datasets from Statistics Canada are used in this thesis. They are: i) the Labour Force Survey (LFS), and
ii)
the Survey of Labour and Income Dynamics (SLID). The former is used as a general reference for some definitions and to understand the survey methodology. The latter contains the information on unemployrnent durations and the main covariates used in our analysis. Both databases are longitudinal and are organized by Panels. In this thesis, we use the Panel 4 and Panel 5 from the SLID. Panel 4 covers the period from January lst, 2002 to December 31st, 2007, and Panel 5 covers the period from January lst, 2005 to Decernber 31st, 2010, i.e. it covers the peak year (2008) of the financial crisis.Two different methods are used to organize the SLID dataset before applying the statistical methods mentioned above. In Method I we group the information per person and we compute the total duration unemployment per persan during each Panel time window. Method II emulates Boudreau and Lawless (2006) and
5
as listed in the SLID dataset. In the following chapters we carefully explain each method. After treating the raw data provided by Statistics Canada we apply the following survival tools: Kaplan-Meier estimation, G-rho test, Cox model fitting (including deviance analysis and residual analysis). For confidential-ity reasons (see Section 4.1.1) we use LOESS regression to smooth survival curves.
This thesis is organized as follows. In Chapter I we discuss the global crisis's effects and the variables that characterize the Canadian labour market. Chap-ter II discusses the unemployment definitions, introduces the SLID data, the data manipulation and descriptive analyses. In Chapter III we introduce the main statistical concepts used in our analysis. Chapter IV is devoted to a detailed presentation of our analysis and results. Finally, we comment our main results and we draw conclusions.
CHAPTERI
THE GLOBAL CRISIS AND THE MAIN CHARACTERISTICS
OF
THE
LABOUR MARKET
As mentioned above, in this Master Thesis we are studying the global crisis of 2008 through specific unemployment Canadian statistics. Namely we focus. on data collected from 2002 to 2010.
It is well known that many economic data collected over time exhibit dramatic breaks in their behaviour, associated with events such as financial crises (Jeanne and Masson, 2000; Cerra, 2005; Hamilton, 2005) or abrupt changes in government policy (Hamilton, 1988; Sims and Zha, 2004, Davig, 2004). Of particular interest to economists is the apparent tendency of many economic variables to behave quite differently during economic downturns, when underutilization of factors of production (inputs to the production process) rather than their long-run tendency to grow governs economic dynamics (Hamilton, 1989, Chauvet and Hamilton, 2005). Time series of unemployment rates exhibit such behaviour.
In this section we discuss the effects of the Global financial crisis on Canada's economy as well as some institutional aspects of the Canadian labour market. Our purpose is to describe briefly the international context that motivates our
8
research, how the Canadian economy, in particular the labour market, has behaved under the recent Financial crisis, and some institutional aspects that give some advantage (or disadvantage) to Canada in its recovery.
1.1 The crisis of 2008: an overview
It is generally accepted that the acute phase of the current global financial
and economic crisis started in September 2008, with the demise of Lehman Brothers. The causes (both short- and long-term) of the current global economic and financial crisis have been discussed in a number of contributions, including Aiginger (2009), Eichengreen and O'Rourke (October 2008), IMF (2008, 2009,
2010), Krugman (2008, 2009, 2010), Ormerond (2010), Solow (2009), UNCTAD
(2008, 2009, 2010), UDESA (2010). Three main causes have been commonly accepted: deregulation in financial markets, world financial imbalance, and financial internationalization.
Before we go on to summarize the consequences of the financial crisis in Canada, we must understand the key features of economic data that define a business
cycle. The term business cycle refers to economy-wide fluctuations in production, trade and economic activity in general over several months or years in an economy organized on free-enterprise principles. We refer to these patterns in fluctuations as a comovement.
One can see that business cycles are qui te irregular, in that they are
unpre-dictable; macroeconomic forecasters often find it difficult to predict the timing of
a business cycle upturn or downturn. However, business cycles are qui te regular in terms of comovements.
9
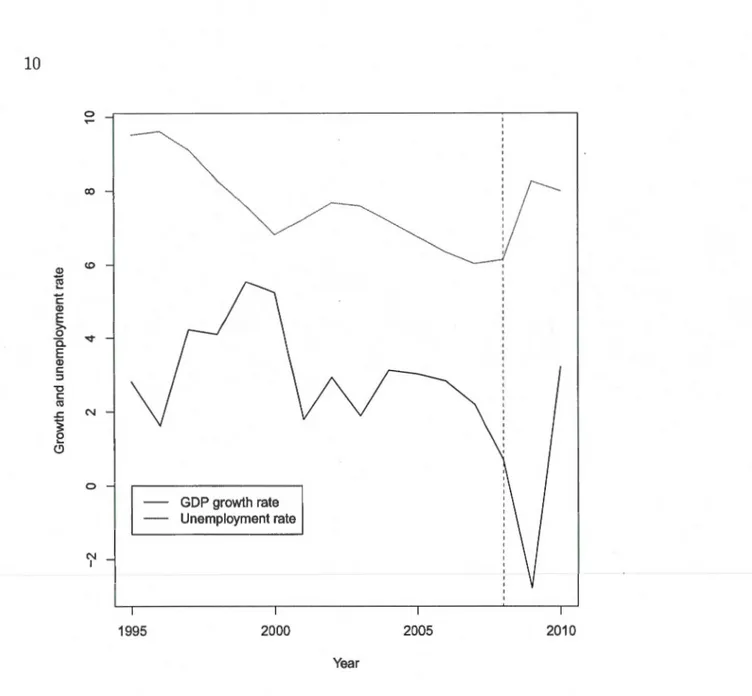
In Figure 1.1 we show the Gross Domestic Product (GNP) growth rate (in per-centage, %) and the unemployment rate in Canada over the period 1995-20101 (OECD, 2013). There are peaks and troughs in the GDP growth rate; a series of positive deviations from the mean culminating in a peak represents a boom, whereas a series of negative deviations from the mean culminating in a trough represents a recession. The figure illustrates two important recent recessions, in the following years: 2001-02, and 2008-09.
While the GDP fiuctuates in irregular patterns, macroeconomic variables exhibit strong regularities. In economic terminology, employment is a procyclical variable, that is, its deviations from the employment trend are positively correlated with the deviations from trend in GDP. Unemployment is countercyclical (negatively correlated). Figure 1.1 seems to confirm that unemployment rises when the GDP falls (OCDE, 2013).
A consequence of high unemployment is personal income decrease. In microe-conomics terms, a decrease in personal wealth (measured by income per-capita) causes consumers to reduce their expenditures on normal and superior goods, which reduces cash fiows for firms selling such goods and services and for suppliers of intermediate goods. With reduced demand for inputs of all sorts, employees are fired faster than they would be rehired elsewhere. Unemployment rose from 4.73 to 7.2% during 2007-2008 in the United States and from 6.13 to 8.3% in Canada during 2008-2009 (OECD, 2013). Therefore, it seems that the
1 In Canadian dollars, in constant prices (national base year, previous year prices and
10 0 CO 2 <D ~
c
Q) E ;., 0 '<t a. E Q) c:: ::i"
c:: Cil .I::. N ~ 0 .... <.9 0 1 1 GDP growth rate Unemployment rate 1 N 1 1995 2000 2005 2010 YearFigure 1.1: Canadian GDP real growth and unemployment rates (%)
consequences observed in the United States arrived in Canada one year later.
From Figure 1.1, it is important to note that the unemployment rate fell from 2002 to 2006 and it increased again from 2007 to 2010.
11
1.2 The effects of the Global Crisis on Canada and the Canadian response
As mentioned earlier, Canada went into recession la ter than the US and many other industrialized countries. However, Canada's recovery has seemed to evolve faster than in other OECD's members.
In Canada, one year after the beginning of the recession, the rate of job destruction (job losses) was as great as it was in the 1981-1982 recession and greater than in the 1990-1991 recession. As a result of the financial crisis, the business sector in Canada employed approximately 369 000 fewer individuals in 2009 compared to 2008 (Rollin, 2012). Part-time jobs were rising, and this is a sign of stress in the labour market. The official unemployment r·ate rose to 8.43 with more than one and a half million people looking for work.
Personal bankruptcies2 climbed, as were credit defaults and house foreclosures.
From 2007 to 2008, bankruptcies increased by 13.23 and from 2008-2009 they increased by 28.63. According to the Office of the Superintendent of Bankruptcy Canada Annual Reports (2008, 2009), the province of Ontario was the most affected and reported 6 840 cases of personal bankruptcies in 2009.
The Canadian International trade activity slowed down abruptly. Between 2008 and 2009, exports fell by 120 thousands millions (CAD), which is equivalent to 24.03.· Even if the export recovery started in 2010, in 2012 Canada's export activity was still lower than at its level before the financial crisis. This fall in the
2The state of a consumer or a business that has made an assignment in bankruptcy or
12
export activity was mainly driven by the lower demand from the US, reporting
a fall around 100 thousand million ( CAD) (Statistics Canada, CANSIM, table
228-0058, 2013).
The Canadian economy (measured by the GDP) shrank at a rate of 2.77% per
year starting in 2009. This contraction was similar to the previous deep recession
in 1981-1982 when the GDP fell by 2.86%. In Canada and the U.S. the fall in
industrial output since 2008 recession is closely tracking the decline of industrial
output following the 1930's.
However, by several economic measures, Canada was seen to be well-positioned
to provide a more effective policy response entering this recession - on both the
monetary and the financial front and fiscal front - than most other countries. The
Bank of Canada intervened repeatedly during the recent financial crisis to provide
large liquidity directly to the financial market participants in order to stabilize
the financial system (Zorn et al., 2009). Canada's comparative advantage derives
from its strong banking system and the low government debt to GDP ratio.
Although the latter gives to Canada fiscal room to implement an aggressive
stimulus package, this capacity is meaningless unless it is used effectively.
The Canadian labour market characteristics and regulations play an important
role in this recovery, essentially because of the factors given below.
a) The Public sector employment3. The split between the private sector and
the public sector employment is an important aspect of labour market
performance as the incentives, productivity, and performance of labour in the
13
The compound annual growth rate (geometric mean) of total employees from 2000 to 2012 was 1.66%. For the public sector and the private sector the corresponding rates were 2.32% and 1.46% respectively. The public sector em-ployees represent 26.00% and the private sector 84.00% of the total employees
for the same period. However, the growth rates changed dramatically during the financial crisis: the total growth rate fell from 1.90% in 2008 to -2.35% in 2009. This fall was mainly driven by the fall in the growth rate of the private
sector employees (1.18% in 2008 to -3.10% in 2009) while the public sector
employees growth rate fell from 4.32% in 2008 to 0.08% in 2009.
A key diff erence between the two sectors is that governments are preoccupied with fulfilling social goals and objectives rather than pursuing economic or
business objectives. In the public sector, political pressures often result in resources going to projects that are not in the best interest of society. In
addition, government businesses tend to develop with less capital and thus are
more labour-intensive than their counterparts in the private sector (Megginson and Netter, 2001).
Sorne researchers argue that a larger public sector leads to poorer outcomes
in the labour market and, more broadly, to poorer economic performance (Amela et al., 2012).
b) Minimum wages. Minimum wage legislation, one of Canada's oldest social policies, exists in every province and territory as part of employment
stan-dards legislation. The minimum wage is the lowest rate an employer can pay
14
Minimum-wage laws establish the lowest level of hourly pay that employers must legally pay their workers. Minimum wages have been shown to reduce employment opportunities for young and unskilled workers by restricting the ability of employers and employees to negotiate mutually beneficial contracts. In particular, minimum-wage legislation hinders low-skilled workers and new workforce entrants from negotiating for employment they might otherwise accept (Stigler, 1946; Palda, 2000). A large body of empirical research documents the adverse effects of high and increasing ( over time) minimum wages, which include a reduction in employment.
According to the real minimum wage per hour database from OECD, from 2000 to 2012, Canada's average minimum wage is 6.71 USD and ranked lüth among 26 members4. Excluding the period 2000-2003, Canada exhibits a positive growth rate in minimum wages. Canada's position seems to be stable, i.e., from 2000 to 2012 Canada remained in the lOth position, except for 2010 when Canada dropped to the llth position.
Data from Statistics Canada (Amela et al., 2012) reveal that, in 2010, 583 of all minimum-wage workers in Canada were between the age of 15-24, of which 85.73 lived at home with their family. As an aside, let's note that higher minimum wages are associated with higher school-dropout rates, as the
4Real hourly and annual minimum wages are statutory minimum wages converted into a common hourly and annual pay period for the 26 countries for which they are available. The resulting estimates are deflated by national Consumer Price Indices (CPI). The data are then converted into a common currency unit using either USD current exchange rates or USD Purchasing Power Parities (PPPs) for private consumption expenditures.
15
increase in the minimum wage encourages teenage workers to leave school in search of employment.
c) Unionization. Another important structural element of labour markets is unionization. Unionization has been demonstrated to impede the flexibility of labour markets, a key factor necessary for good labour market performance.
A literature review on unionization and its economic effects (Aidt and Tzan-natos, 2008) corroborates the finding of other studies. The authors concluded that union members and other workers covered by collective agreements receive, on average, wage premium over their non-unionized counterparts. Furthermore, the researchers noted that net profits, investment rates (physical capital), and spending on research and development tend to be lower m unionized than in non-unionized firms, even though unionized firms tend to adopt new technologies as fast as non-unionized firms.
Using the OECD database concerning trade union statistics, we found that the average rate of unionization in Canada, from 2000 to 2012, is around 29.9% using Administrative data and 27.8% using the Survey data5
. Based on the average rate of unionization, Canada is in the 12th position among 33 OECD countries6 for the same period.
5This analysis is based on the number of active trade union members and the number of wage and salary earners. Data on union membership are broken down by source of data (administrative or survey data). Membership corresponds to the number of wage and salary earners that are members of a trade union. Total number of wage and salary earners is taken from OECD Labour Force Statistics.
16
d) Other characteristics. All of the Canadian provinces have many other labour regulations including employment standard, occupation licensing, and worker's compensation.
i) Employment Standard Acts. All Canadian provmces have their own standard acts. These acts have in summary two core features of provincial employment labour standard laws and codes: mandatory overtime and exemptions from minimum wages.
ii) Occupation licensing. Regulation of occupation licensing can affect labour market performance by impeding the mobility of the worker. Occupation licensing governs the entry requirements need to hold job titles or to prac-tice in such professional fields as medicine, law, accounting, engineering, electric technician, etc.
To summarize, Canada's economy has been touched by the current financial crisis. However, as we mentioned above, its recovery seems to evolve faster than in other OECD members. This recovery can be explained by the monetary and fiscal policies implemented by the Bank of Canada.
Despite the great performance during this difficult period, the labour market did not recover its pre-crisis level. In what follows, we are addressing this issue from a more refined point of view than the one based only on the unemployment rates.
17
Given the above analysis, we propose to study the Canadian unemployment
por-'
trait before and during the crisis in relation with the most commonly used
CHAPTER II
THE DATABASES,
DATA
MANIPULATION, AND
DESCRIPTIVE STATISTICS
The data for our empirical investigation are obtained from Statistics Canada.
The main databases are "The Labour Force Survey" (LFS) and "The Survey of
Labour and Income Dynamics" (SLID). The analysis spans the time between
· 2002 and 2010, riamely, panels 4 and 5 of SLID. For each panel, unemployment duration and the variables gender, age, aboriginal background, immigration
status, region, and education level were considered in our analysis.
This chapter is organized as follows: Section 2.1 describes the Labour Force Survey, Section 2.2 describes The Survey of Labour and Income Dynamics, in
Section 2.3 we introduce the definition of the main variables in unemployment duration, and in Section 2.4 we describe the sample used in our analysis.
2.1 The Labour Force Survey (LFS)
Our analysis is based specifically on data from the SLID. However, because the
SLID samples are selected from the monthly LFS it shares the latter's sample
20
is designed. In what follows we refer to the Guide to the Labour Force Survey
(2013) available on the website of Statistics Canada.
The Labour Force Survey is a household survey carried out monthly by Statistics
Canada. The interviews are taken during the so-called reference week, which is
normally the week containing the 15th day of the calendar month. The labour
force is composed by the civilian non-institutional population 15 years of age and over who, during the survey reference week, were employed or unemployed. The
sampling unit is a household, which is, any person or group of persans living in
a dwelling. A household may consist of any combination of: one person living
alone, one or more families, a group of people who are not related but who share the same dwelling.
The objectives of the LFS have been to <livide the working-age population into
three mutually exclusive classifications - employed, unemployed, and not in the
labour force - and to provide descriptive and explanatory data on members
of each of these categories. The employed persons are those who, during the
reference week did any work for pay or profit, or had a job and were absent from work. The unemployed persons are those who, during the reference week, were available for work and were either on temporary layoff, had looked for work in
the past four weeks or were expecting to start a job within the next four weeks.
Persans not in the labour force are those who, during the reference week, were
unwilling or unable to offer or supply labour services under conditions existing
in their labour markets, that is, they were neither employed, nor unemployed. Data from the survey provide information on major labour market trends such as shifts in employment across industrial sectors, number of hours worked, labour
21
unemployment rates.
The LFS is the only source of monthly estimates of total employment, including the self-employment, full and part-time employment, and unemployment. It
publishes monthly standard labour market indicators such as the unemployment rate, the employment rate and the participation rate. The LFS is a major source
of information on the personal characteristics of the working-age population,
including age, sex, marital status, educational attainment, and family
character-istics.
Employment estimates include detailed breakdowns by demographic
character-istics, industry and occupation, job tenure, and usual and actual hours worked.
The survey incorporates questions permitting analyses of many topical issues, such as involuntary part-time employment, multiple job-holding, and absence
from work. The LFS also provides monthly information on the wages and union
status of the employees, as well as the number of employees at their workplace and
the temporary or permanent nature of their job. Other demographic variables as
belonging to a visible minority, immigration status, and aboriginal background
are also included.
Unemployment estimates are produced by demographic group, duration of
unemployment and activity before looking for work. Information on industry
and occupation, and reason for leaving the last job is also available for persans
currently unemployed or not in the labour market but with recent labour market involvement.
22
2.1. l Survey methodology
The LFS is conducted nationwide, in both the provmces and the territories. Its population coverage excludes: persons living on reserves and other Aboriginal settlements in the provinces; full-time members of the Canadian Forces and the institutionalized population. These groups together represent an exclusion of approximately 23 of the population aged 15 and over.
National Labour Force Survey estimates are derived usmg the results of the LFS in the provinces. Territorial LFS results are not included in the national estimates and are published separately. Geographical location and confidential issues are the sources of this exclusion. The same is applicable for Indian Reserves.
For the purposes of sampling, the population in geographic areas (provinces and regions within provinces) is further partitioned into strata, in order to maximize the reliability of the estimates, while keeping colle.ction costs at a minimum. Dwellings in strata are not selected directly. Small well-defined geographical areas called clusters are mapped across all parts of the 10 provinces. For example, in the 2006 Census, each cluster contains approximately 200 households. These clusters are used as the unit for stratification, as well as the unit for sample selection within stratum. A sample of clusters is selected in each stratum. All dwellings within selected clusters are listed and a sample of dwellings is chosen from each list.
The number of households sampled across the country has varied over the years as a result of varying levels of funding, and improvements in the survey design. Recently, the sample size bas been approximately 56,000 households. The sample is allocated to provinces and strata within provinces in the way that best
23
meets the need for reliable estimates at various geographic levels. These include
national, provincial, census metropolitan areas (large cities), economic regions,
and employment insurance regions.
The LFS follows a rotating panel sample design; in which households remain in
the sample for six consecutive months. The total sample consists of six
represen-tative sub-samples or panels, and each month a panel is replaced after completing
its six month stay in the survey. Outgoing households are replaced by households
in the same or a similar area. This results in a five-sixths month-to-month sample overlap, which makes the design efficient for estimating month-to-month changes.
The rotation after six months prevents undue respondent burden for households
that are selected for the survey.
Demographic information is obtained for all persons in a household for whom
the selected dwelling is the usual place of residence. Labour force information is
obtained for all civilian household members 15 years of age or older. Respondent
burden is minimized for the elderly (age 70 and over) by carrying forward their
responses for the initial interview to the subsequent five months in survey.
2.1.2 Data collection
Data collection for the LFS is carried out each month during the week following
the LFS reference week. LFS interviews are conducted by telephone (Computer
Assisted Telephone Interviews) by interviewers working out of a regional office
site or by a personal visit from a field interviewer. The interviewer first obtains
socio-demographic information for each household member and then obtains
24
of the regular armed forces. In subsequent monthly interviews the interviewer confirms the socio-demographic information collected in the first month and collects the labour force information for the current month.
2.2 The Survey of Labour and Income Dynamics (SLID)
The SLID is an important source of income data for Canadian families, house-holds and individuals. It is a longitudinal survey and it provides an added dimension to traditional surveys on labour market activity and mcome: the changes experienced by individuals and families through time. Among the survey's key objectives is to understand Canadians' economic well-being.
The subjects for SLID are selected from the monthly LFS and thus share the latter's sample design. As mentioned above, the LFS sample is drawn from an area frame and is based on a stratified, multi-stage design. The total sample is composed of six independent samples, called rotation groups because each month one sixth of the sample (or one rotation group) is replaced. By definition, the SLID sample is composed of two panels. Each panel consists of two LFS rotation groups and includes roughly 17,000 households. A panel is surveyed for a period of six consecutive years. A new panel is introduced every three years, so two panels always overlap.
The SLID main difference with the LFS is that the former interviews the same people from one year to the next for six years. The survey's longitudinal dimension enables evaluation of concurrent and often related events.
25
SLID also provides information on a broad selection of human capital variables, labour force experiences and demographic characteristics such as education, family relationships and household composition.
Similar to the LFS, the SLID covers all individuals in Canada, excluding residents of Yukon, the Northwest Territories and Nunavut, residents of institutions and persans living on Indian Reserves or in military barracks.
2.2.1 Survey design
As mentioned above, the SLID sample is composed of two panels. Each panel consists of roughly 17,000 households and about 34,000 adults, and is surveyed for six consecutive years. A new panel is introduced every three years, so two panels always overlap.
Reference Year
("')
~ .,., <Cl ,.._ a; Ol
§
... N ("')8
.,.,8
,.._"'
8
0 ... ~ O> O> O> O> O> 8~ ~
8 8 8....
....O> O> O> O> O> 0 0
.... .... ....
........
.... .... N N N N N N N N N N Panel 1 Panel 2 Panel 3 Panel 4 t;....
-
r..:~ Panel 5 Panel 6 Panel 7...
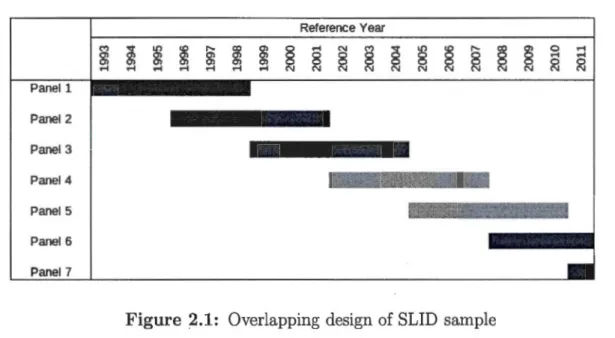
Figure 2.1: Overlapping design of SLID sample
Figure 2.1 shows the overlapping design of the SLID samples. For example, Panel 4 covers the period from January lst, 2002 to December 31st, 2007, and Panel
26
5 covers the period frorn January lst, 2005 to Decernber 31st, 2010. These two
panels overlap from January lst, 2005 to Decernber 31st, 2007. In our analysis, we analyze these two panels.
In a survey like SLID, the focus extends frorn static cross-sectional measures to
a range of longitudinal events: transitions, durations, and repeat occurrences
of people's financial and work situations. These yield a number of possible
longitudinal researches themes.
Longitudinal respondents are the people belonging to the selected households
when a new six-year panel of respondents is introduced. These respondents
are interviewed once a year whether they stay, move away or split up. New
participants, called cohabitants in SLID, are interviewed as long as they continue to live with a longitudinal respondent. That is because the family make-up
and farnily incarne situation of the longitudinal respondents is of key interest. Interviewing cohabitants also irnproves the quality of cross-sectional estimates.
Children present in the original households are interviewed starting the year
in which they reach 16 years. People aged 70 years and older are not asked
labour-related questions.
Data collection follows the same process as the LFS mentioned in Section 2.1.2.
Like the LFS, the SLID collects data on a wide range of tapies. Sorne are inherently
dynamic, involving transitions and spells, while others have important explanatory
27
A) Labour i) Activity ii) Experience iii) Jobless periods iv) Job information
• Job characteristics • Employer attributes • Absences from work B) Income
i) Income sources
ii) Employment insurance/Social assistance/Workers' compensation
C) Education
i) Educational activity ii) Training
iii) Level of schooling iv) Student loans D) Personal characteristics
i) Demographics ii) Ethnie-cultural iii) Activity limitation iv) Information on children
28
vi) Household and Family information
• Housing information E) Sample control
i) Identifiers ii) Weights
To comply with the strict confidentiality provisions of the Statistics Act, SLID longitudinal data are made available through special modes of dissemination.
We had access to the SLID database through the Research Data Centre from Queen's University and through the Quebec Inter-University Center for Social Statistics from the branches in the Université de Montréal and the Université du Quebéc à Montréal.
2.3 Main definitions
The concepts of employment and unemployment are derived from the theory of the supply of labour as a production factor1. In this section we focus on gen -eral concepts and definitions of employment and unemployment used in this thesis.
Accordirig to the standard definition employed by Statistics Canada, the unem-ployed and the employed constitute the labour force. Detailed definitions for the variables used in this thesis will follow.
1The supply of labour is the total hours (adjusted for physical or mental intensity of effort) that workers wish to work at a given real wage rate. In economics, factors of production are the inputs to the production process.
29 Employment: Employed persons are those who, during the reference week:
a) did any work at all at a job or business, that is, paid work in the context
of an employer-employee relationship, or self-employment. It also includes
unpaid family work, which is defined as unpaid work contributing directly to
the operation of a farm, business or professional practice owned and operated
by a related member of the same household; or
b) had a job but were not at work due to factors such as own illness or disability,
personal or family responsibilities, vacation, labour dispute or other reasons
( excluding persans on layoff, between casual jobs, and those with a job to start at a future date).
Unemployment: Given the concept of unemployment as the unutilized supply
of labour, the operational definition of unemployment is based primarily on the
activity of job search and the availability to take a job. In addition to being
conceptually appropriate, job search activities can, in a household survey, be
objectively and consistently measured over time. The definition of unemployment is therefore the following.
Unemployed persans are those who, during the reference week:
a) were on temporary layoff during the reference week with an expectation of
recall and were available for work, or
b) were without work, had looked for work in the past four weeks, and were
available for work, or
c) had a new job to start within four weeks from the reference week, and were
30
Persons are regarded as available if they reported that: i) they could have worked in the reference week if a sui table job had been offered (or recalled if on temporary layoff); ii) if the reason they could not take a job was of a temporary nature such as: own illness or disability, personal or family responsibilities; iii) they already
had a job to start in the near future; iv) they were on vacation (prior to 1997,
those who were on vacation were not considered available). Full-time students
currently attending school and looking for full-time work are not considered to
be available for work during the reference week. They are assumed to be looking
for a summer or co-op job or permanent job to start sometime in the future, and
are therefore not part of the current labour supply.
Note that in the above definition there are two groups for which job search is not required: persans on temporary layoff and persons with a job to start at a
definite date in the future. Persans on layoff are included among the unemployed
on the grounds that their willingness to supply labour services is apparent in
their expectation of returning to work. A similar argument is applied for persons
who will be starting in a new job in four weeks or less.
The variables in our empirical analysis include age, gender, educational
attain-ment, duration of unemployment, sex, immigration status, class of worker, and
union status. In what follows we introduce the definitions of the terms and
variables as used in the LFS and SLID as well as the variables selected from the SLID in our analysis.
Aboriginal identity: Persons who reported identifying with at least one
31
based on the individual's own perception of his/her Aboriginal identity, similar to the concept used with the Census. "Aboriginal identity" is not to be confused
with "Aboriginal ancestry", another concept measured by the Census, but not by the LFS.
Age: Age is collected for every household member in the survey, and the infor-mation on labour market activity is collected for all persans aged 15 and over.
Prior to 1966, information on labour market activity was collected for persans
aged 14 and over. Beginning January 1997, date of birth is collected to ensure
inclusion of respondents who turn 15 during their six month rotation in the survey.
Class of worker: There are two broad categories of workers: those who work for
others ( employees) and those who work for themselves (self-employed). The first
group is subdivided into two classes: public sector employees and private sector
employees.
a) The public sector includes employees in public administration at the federal,
provincial, territorial, municipal, First Nations and other Aboriginal levels as
well as in Crown corporations, liquor control boards and other government
institutions such as schools (including universities), hospitals and public
li-braries.
b) The private sector comprises all other employees and self-employed owners of businesses (including unpaid family workers in those businesses), and
self-employed persans without businesses.
32
In this study we use the variable with the following categories: Less than high school graduation (1), High school diploma/degree (2), Non-university postsecondary certificate (3), and University degree or certificate (4).
Duration of unemployment: Number of continuous weeks during which a
person has been on temporary layoff or without work and looking for work. Respondents are required to look for work at least once every four weeks, but they are not required to undertake job search activities each week in order to be counted as unemployed. A spell of unemployment is interrupted or completed by any period of work or withdrawal from the labour force.
In the SLID there exists the variable which indicates the total number of weeks in unemployment for each observation. We have also the start date and the end date for each period in unemployment. These three are used in our computation of unemployment duration.
Landed immigrant: Refers to people who are, or have been, landed immigrants
in Canada. A landed immigrant is a person who has been granted the right to live in Canada permanently by immigration authorities. Canadian citizens by birth and non-permanent residents (persans from another country who live in Canada and have a work or study permit, or are claiming refugee status, as well as family members living here with them) are not landed immigrants.
Region. It indicates the region of residence for the household as of December 31
33
i) Atlantic Canada ( 1). It is the region of Canada comprising the four provinces located on the Atlantic coast, excluding Quebec: the three Mar-itime Provinces - New Brunswick, Prince Edward Island, and Nova Scotia -and the east-most province of Newfoundland and Labrador.
ii) Quebec (2).
iii) Ontario ( 3).
iv) Prairies ( 4) The Prairie provmces or simply the Prairies comprise the
provinces of Alberta, Saskatchewan, and Manitoba.
v) British Columbia (5).
vi) Category -other- comprises the Canadian territories: Yukon, Northwest ter-ritories, and Nunavut.
Union status: Beginning January 1997, employees are classified as to their union status: a) union member; b) nota member but covered by a union contract or collective agreement; or c) non-unionized.
Visible minority: It refers to whether a person belongs to a visible minority group as defined by the Employment Equity Act and, if so, the visible minority group to which the person belongs. The Employment Equity Act defines visible minorities as "persans", other than Aboriginal peoples, who are non-Caucasian in race or non-white in colour". The visible minority population consists mainly of the following groups: Chinese, South Asian, Black, Arab, West Asian, Filipino, Southeast Asian, Latin American, Japanese and Korean.
34
In what follows, we <livide the covariates in two groups: i) the fixed covariates
(sex, aboriginal background, immigration status, and visible minority), and
ii)
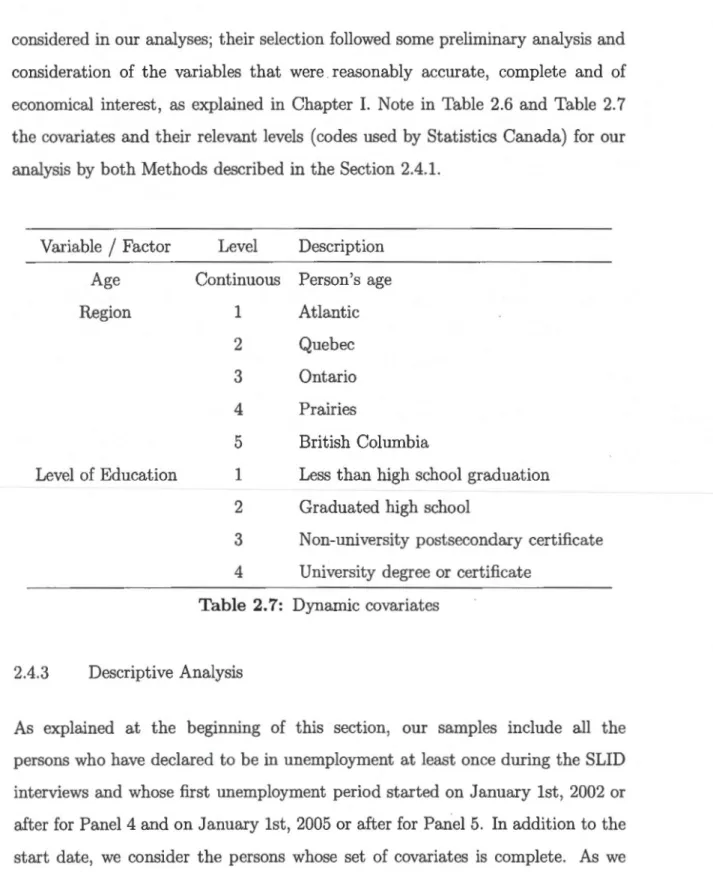
the dynamic covariates ( education attainment and region). The levelsconsidered for these factors in our thesis are summarized in Table 2.6 and
Table 2.7.
We remark that, in the case of the fixed covariates, some other codes exist. These
fixed covariates and the dynamic covariate related to education attainment share
additional range and codes such as: 6 (Interim processing code), 7 (don't know),
8 (refusal), and 9 (not applicable). The dynamic covariate related to the region
has additional codes such as 96 (Interim processing code), 97 (don't know), 98
(refusal), and 99 (not applicable).
The variable age is the only continuous variable. In this case, as for the fixed and
dynamic covariates, there exist some additional codes such as: 997 (don't know),
998 (refusal), and 999 (not applicable).
For our independent variable, the number of weeks in unemployment, there also
exist some additional codes named differently. These codes are: 9996 (Interim
processing code), 9997 (don 't know), 9998 ( refusal), and 9999 ( not applicable).
In this thesis, all additional codes to those mentioned in Table 2.6 and Table 2. 7
are excluded from our analysis. However, it is important to mention them in
35
2.4 The Sample, Covariates, and Descriptive analysis
For our analyses we were provided with the raw SLID sample data. Because our
analyses are based on unweighted information, they are not comparable with the
official statistics which are released by Statistics Canada. However, we believe
that our results give an idea on how the financial crisis of 2008 impacted the
Canada Labour Market.
2.4.1 Treatment of the raw data
As mentioned, we focus on the analysis of two panels to study the effect of the
financial crisis on unemployment duration: Panel 4 and Panel 5. Our main int
er-est is in considering individuals interviewed in these two panels. We study the
total duration in unemployment for each individual which is a random variable, T.
From the Data Centre we received two unsorted datasets for each panel: i)
jobless periods, and
ii)
job information. The first data set contains a list ofunemployment periods and information on the people who declared to have been
in unemployment during the reference month. It includes also variables such as
age, sex, start and end date of the Ïmemployment period, number of weeks in
unemployment, aboriginal status, visible minority status, immigration status,
level of education, and region. The second dataset contains information on all
the persans in the SLID panels and includes such variables as class of worker and
union status. Both datasets include the person's identifier (ID).
Thus, it is important to note that there is a difference between an observation
36
appear more than once in the database, whenever the same person has been in unemployment more than once during the Panel time window.
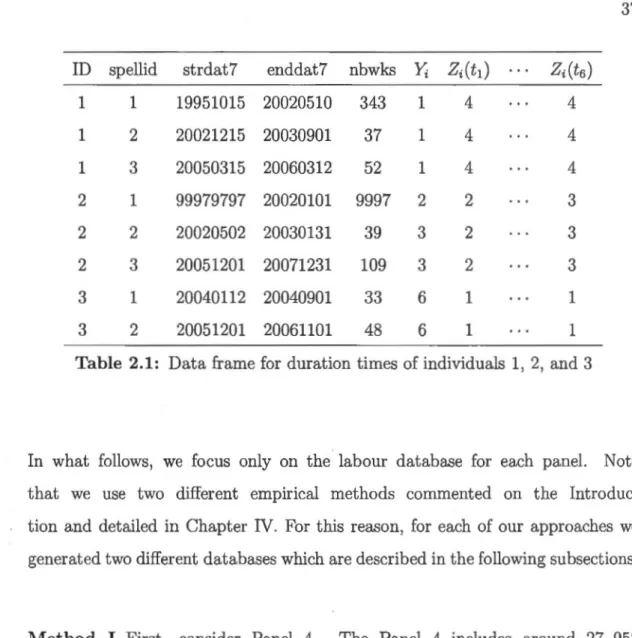
In what follows we illustrate our data manipulations by considering three individuals (Table 2.1), who were followed in Panel 4 from time t1 = 2002 to
t6 = 2007. The variables such as the person id (ID); the spell id (spellid);
the main information for computing the duration in unemployment: start date
(strdat7), end date (enddat7), and number of weeks in unemployment (nbwks). Further, one of the time independent fixed factors (Yi), and the value of one of
the dynamic factors ( Zi (
ti))
for person i = 1, ... , n and year j = 1, .. ., 6. We see that the same individual can be observed.more than once if he experienced more unemployment periods. The start date in unemployment could be before January lst 2002 (for person with ID=l, first observation), and there is some missing orincomplete information for some observations.
In Table 2.1 the person with ID=l has been in unemployment for three times,
the person whose ID=2 has also been three times in unemployment, and persan
with ID=3 has been unemployed only twice. For ID=l the first observation (first
unemployment period) has a starting date before January lst, 2002. For person
two, the first observation has a code 99979797 for the starting date meaning that we do not know when this unemployment spell started. As a consequence, we can not determine the number of weeks for this unemployment spell. For person
with ID=3, we observe a code 6 on at least one of the fixed covariates, which means that Statistics Canada is still processing the information. Therefore, this
37
ID spellid strdat7 enddat7 nbwks
Yi
Zi(t1)
Zi(t6)
1 1 19951015 20020510 343 1 4 4 1 2 20021215 20030901 37 1 4 4 1 3 20050315 20060312 52 1 4 4 2 1 99979797 20020101 9997 2 2 3 2 2 20020502 20030131 39 3 2 3 2 3 20051201 20071231 109 3 2 3 3 1 20040112 20040901 33 6 1 1 3 2 20051201 20061101 48 6 1 1
Table 2.1: Data frame for duration times of individuals 1, 2, and 3
In what follows, we focus only on the labour database for each panel. Note
that we use two different empirical methods commented on the
Introduc-tion and detailed in Chapter IV. For this reason, for each of our approaches we generated two different databases which are described in the following subsections.
Method 1 First, consider Panel 4. The Panel 4 includes around 27 958 observations (remember that each individual could have more than once
unem-ployment period, and each unemployment period is one observation). For some observations, the information related to the jobless duration is not available or
has not been processed. The codes for those cases were mentioned above and they were excluded in our analysis.
In the first step, observations with missing information for the starting date
(8 195 observations) and with starting date before January lst, 2002 (4 929 observations) were dropped out of our sample. In the case of Panel 4 (2002-2007),
38
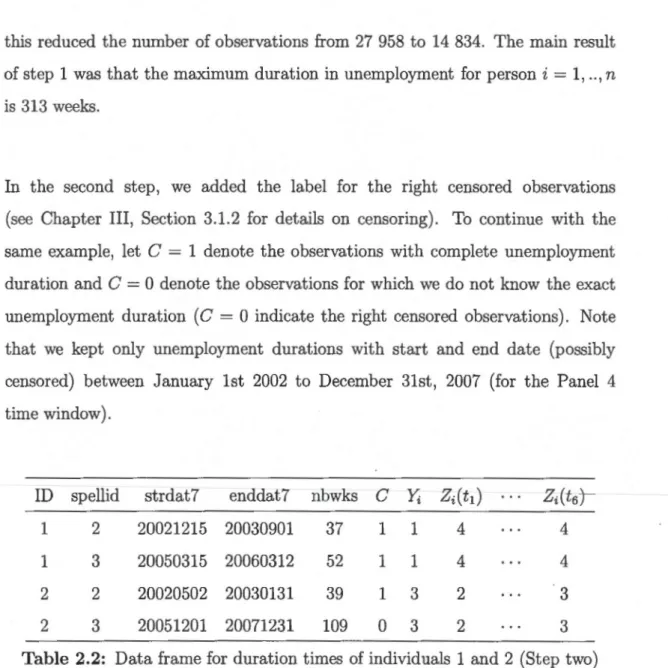
this reduced the number of observations from 27 958 to 14 834. The main result of step 1 was that the maximum duration in unemployment for persan i = 1, .. , n is 313 weeks.
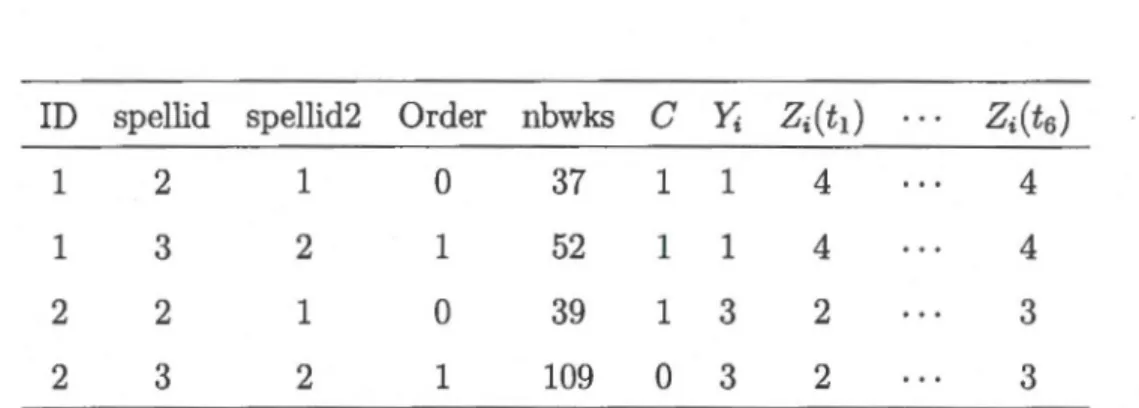
In the second step, we added the label for the right censored observations (see Chapter III, Section 3.1.2 for details on censoring). To continue with the same example, let C = 1 denote the observations with complete unemployment duration and C = 0 denote the observations for which we do not know the exact unemployment duration (C = 0 indicate the right censored observations). Note that we kept only unemployment durations with start and end date (possibly censored) between January lst 2002 to December 31st, 2007 (for the Panel 4 time window).
ID spellid strdat7 enddat7 nbwks
c
Yizi (
ti)Zi(t6)
1 2 20021215 20030901 37 1 1 4 4
1 3 20050315 20060312 52 1 1 4 4
2 2 20020502 20030131 39 1 3 2 3
2 3 20051201 20071231 109 0 3 2 3
Table 2.2: Data frame for duration times of individuals 1 and 2 (Step two)
In addition, when there was missing information on at least one of the covariates, we dropped the observation (and consequently persan in case of Method I). For example, the information available for persan with ID=3 three is currently declared in process (Code 6 in Yi) by Statistics Canada for at least one of the fixed covariates (Yi). Hence, both observations for the persan have missing information and both were dropped from our analysis. Table 2.2 shows the remaining data after step two. We remark that the persan with ID=2 stays with
39
only two observations and its corresponding observation with spellid=3 is right
censored.
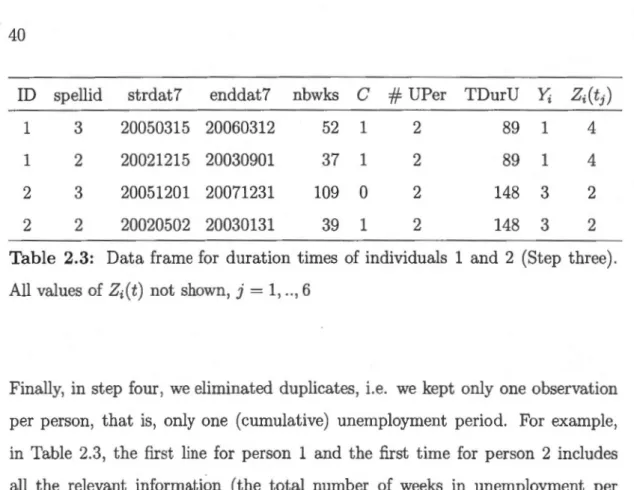
In step three, we consider the total duration in unemploymentt. This was done as follows
i) We sorted the current database (after step two) using the person's identifier
and by decreasing values of spellid;
ii)
We counted the number of periods in unemployment inside the Panel timewindow in the current data base. This sum is denoted by
#
UPer in thedatabase in Table 2.3.
iii) We summed up the number of weeks in unemployment for each person during
the Panel time window. We added this sum in the new variable named TDurU. Notice that TDurU denotes the total unemployment duration for
each persan remaining in our dataset.
After processing the raw information as mentioned above, the database looks as
in Table 2.3. It contains the person identifier, the spell identifier, the independent variable (total duration in unemployment per person) and the set of fixed and