To link to this article:
DOI:10.1016/j.ijadhadh.2015.12.021
URL:
http://dx.doi.org/10.1016/j.ijadhadh.2015.12.021
This is an author-deposited version published in:
http://oatao.univ-toulouse.fr/
Eprints ID:
18711
To cite this version:
Tramis, Olivier and Brethous, Romain and Hassoune, Bouchra and
Fazzini, Marina and Nassiet, Valérie Experimental investigation on the
effect of nanostructuration on the adherence properties of epoxy adhesives
by a probe tack test. (2015) International Journal of Adhesion &
Adhesives, vol. 67. pp. 22-30. ISSN 0143-7496
O
pen
A
rchive
T
oulouse
A
rchive
O
uverte (
OATAO
)
OATAO is an open access repository that collects the work of Toulouse researchers and
makes it freely available over the web where possible.
Any correspondence concerning this service should be sent to the repository
administrator:
[email protected]
Experimental investigation on the effect of nanostructuration
on the adherence properties of epoxy adhesives by a probe tack test
O. Tramis
n, R. Brethous, B. Hassoune-Rhabbour, M. Fazzini, V. Nassiet
Laboratoire Génie de Production, Ecole Nationale d’Ingénieurs de Tarbes, B.P. 1629, 65016 Tarbes cedex, Francea b s t r a c t
In this work, we aimed to characterize the energy of adherence of nanoscale structured epoxy adhesives Diglycidyl ether of bisphenol-A/Methylene–diethylaniline (DGEBA/MDEA) induced by phase separation triblock copolymers Poly (Methacrylate de Methyl)-b-Poly (Butyl Acrylate)-b-Poly (Methyl Methacrylate) (PMMA-b-PBA-b-PMMA) at gel state by a probe tack test, which is an original use of this kind of test for thermoset adhesives. For a set of mechanical parameters (probe’s roughness, contact time, contact pressure and debonding velocity), we measured the energy of adherence for both neat and filled adhesives. The probe tack test was performed at different steps of gelation. We compared the behavior of the adhesives and evaluated the dissipation contribution to the energy of adherence of the adhesives during the test. We finally discussed the nanoparticles' influence on the competition between cavitation and fibrillation. We report that the addition of nanoparticles leads to an overall improvement of the energy of adherence, with a significant increase of the dissipation contribution to the energy measured. .
1. Introduction
Epoxy resins are widely used as adhesives for structural bonding. Improving the resilience (i.e., the toughness) of those adhesives would be one way to reduce their brittleness while keeping a structural bonding. A compromise between the improvement of the resilience and the upkeep of other properties may be achieved by adding micro-or nano-particles to the adhesives.
Many approaches exist to achieve an improved resilience. Djilali et al.[1]and others[2,3]used micro particles (siloxane oligomers) in epoxy-amine systems to increase their flexibility. Several works
[4–6] used epoxy resins modified with various functionalized
butadiene–acrylonitrile rubbers (CTBN, HTBN, ATBN…). In other
approaches[7–9], thermoplastics such as polyethersulfones, poly-etherimides or polyetheresters were used as fillers.
A general trend observed is a significant improvement in toughening but a strong decrease of the glass transition tem-perature (Tg). The decrease of the Tgis generally attributed to a poor miscibility of the fillers with the epoxy-amine system.
Increasing the miscibility between the fillers and the epoxy resin is a key point to keep the Tgconstant, and the addition of antiplasticizers[10,11]may be one way to achieve it.
Thermoplastic polymer used as nanoparticles is another way to improve the flexibility of an epoxy network, thus improve its toughness, without depreciating the Tg. Indeed, it has been shown
that nanostructured epoxy has the same Tgas the neat epoxy it
was obtained from [12–15]. Nanostructuration by thermoplastic
polymers is often achieved by having block copolymers, with at least one block being miscible within the epoxy-amine matrix
[13,16], which creates a nanoscale phase separation. Several
authors reported by transmission electron microscopy (TEM)
[13,17,18], scanning electron microscope (SEM)[12,18]or atomic
force microscopy (AFM) [19], that this kind of fillers lead to a
regular distribution of nanodomains. It was also shown that the
nanoparticles filled epoxy had their toughness improved[20], as
well as their impact resistance[21].
We chose thermoplastic triblock copolymer to design our nanoparticles filled adhesives. This choice was made after the
study of Brethous et al. [22]. They demonstrated that triblock
copolymers (named M52 and M22N, supplied by Arkema) was a suitable solution to improve epoxy toughness without strongly depreciate the Tg. The nanoparticles filled adhesives (referred to as LTA in the following) are obtained by adding the copolymers to the neat adhesive (referred to as HTA in the following). Two of the three blocks of the nanoparticles have a good thermodynamical compatibility with the epoxy resin, which is a necessary condition to achieve nanostructuration of the epoxy resin[13], as reviewed earlier. The third block being insoluble, it is rejected out of the
n
Corresponding author. Tel.: þ33 5 62 44 27 00; fax: þ33 5 62 44 27 27. E-mail address:[email protected](O. Tramis).
matrix. Therefore, the nanostructured adhesive has 2 phases, and the insoluble phase presents a nodular shape, with domains of a few nanometer, as reported for similar epoxy toughened by ther-moplastic copolymer in the literature[13,23–25].
In order to be effective, an adhesive must wet the surface when the bond is formed and get solid cohesive properties to sustain a certain level of stress during the process of debonding. Structural epoxy-amine adhesives accomplish this by cross-linking.
This kind of adhesives exhibit a debonding energy higher than
the thermodynamic work of adhesion Wacharacterizing the
for-mation of chemical bonds at the interface[26]. Toughened
epoxy-amine adhesives exhibit an even higher debonding energy [21],
mainly due to an increase of viscoelastic dissipation. Many adhe-sive tests, classified in three categories following the solicitation mode (I, II or III) are used to quantify the total debonding energy
[27]. Amongst others, cleavage tests (Boeing wedge test, Double
Cantilever Beam), peel tests, shear tests, pull out tests (traction tests) are widely used to quantify this energy. An extensive review of mechanical tests can be found in[28]. For fully cross-linked adhesives, it is known that bulk energy losses are coupled to the
thermodynamic work of adhesion, Wa [26]. However, when the
adhesives are weakly cross-linked, it is possible to study one or another contribution to the debonding energy. Probe tack tests are usually used to evaluate the contribution of the dissipative energy of lightly cross-linked adhesives[29]. Indeed, tacky materials are often close to a nearly uncross-linked network, which is a suitable molecular structure to exhibit high tack energy (i.e., a high debonding energy)[30].
This paper brings a contribution to the field by studying the dissipative behavior of thermoset adhesives, and the impact of the addition of nanoparticles on this dissipation. We perform tack tests at different gelation steps for weak conversion rates, which is an original use of this method to measure the adherence of ther-moset adhesives.
Firstly, a rheological study is carried out to determine the gelation span (i.e., the interval within which the thermoset adhesives can be tested by a probe tack test) for both filled and neat adhesives. Secondly, we perform probe tack tests at different gelation steps. For each adhesives, we study the evolution of the energy of adherence as a function of the cross-linking time. Finally, we discuss the impact of the addition of nanoparticles on the dissipative behavior of thermoset adhesives.
2. Experimental 2.1. Materials 2.1.1. Adhesives
Diglycidyl ether of bisphenol-A (DGEBA) (DERR332, Sigma Aldrich, functionality of 2) is used as the epoxy resin. The epoxy resin is mixed to a tri-amine hardener (MDEA, Lonzacure, func-tionality of 4), with a stoechiometrical ratio of 1:0.31. This adhe-sive can be filled with two kinds of copolymers: M52 and M22N,
supplied as powders, by Arkema[22]. M52 and M22N are triblock
copolymers made of Poly (Methacrylate de Methyl)-b-Poly (Butyl Acrylate)-b-Poly (Methyl Methacrylate) (PMMA-b-PBA-b-PMMA). The suffix N indicates that dimethylacrylamide (DMA) is incor-porated into the PMMA block to increase the miscibility of the PMMA blocks with epoxies. The M22N has a lower Poly (Butyl Acrylate) soft block fraction content than the M52[31].
The neat adhesive is obtained by first heating up the DGEBA to 160 °C, then adding the MDEA hardener. The mixture is then stirred vigorously for 5 min at 160 °C. The nanostructured adhesives are obtain by first heating up the DGEBA to 160 °C. Then the nano-particles (either M52 or M22N) are added by step of 0.1 g to avoid
agglomeration of the powder. After putting the first 0.1 g, the mix-ture is vigorously stirred until complete dissolution of the powder in the epoxy resin. Then the next 0.1 g are added, and so on until the whole weight is completely mixed. The temperature is kept con-stant and equal to 160 °C during the copolymer incorporation to ensure phase inversion. Finally, the MDEA hardener is added as for the neat adhesive. In this study, we prepared three formulations: the first formulation is the neat adhesive, referred to as HTA. Both nanoparticles filled adhesives are filled with 10 wt% of nano-particles. The adhesive filled with the M52 is referred to as LTA M52, while the adhesive filled with the M22N is referred to as LTA M22N. The nature of the copolymers and their influence on the epoxy
network have been reported elsewhere [22]. They are briefly
summarized inTable 1. The most important trend is that filling the neat adhesive with 10 wt% of nanoparticles (either M52 or M22N)
does not change the Tgnor Young's modulus, while increasing the
toughness.
2.1.2. Substrates and probe preparation
Transparent glass slides (50 " 50 " 1 mm3) were used as the substrates. The probe is machined from a commercial steel tube to a final diameter of 6 mm. The surface of the probe is polished to a mirror-like roughness (Ra #3377 nm).
2.2. Methods
A probe tack test is used to characterize the energy of adherence of the thermoset adhesives. The probe tack test has been exten-sively used to characterize Pressure Sensitive Adhesives (PSA)[32–
34]. A PSA (which is commonly made of thermoplastic polymers) is usually considered as good if it can form a strong bond with a substrate over a short time, and dissipate a large amount of energy during debonding. Many variables are relevant in such a test: con-tact force, concon-tact time, debonding speed as well as interfacial free energy between the adhesives and the probe, and the rheological properties of the polymer. The relevant parameter is the tack energy (i.e., the energy of adherence), which is estimated as the area under the curve Force versus Time during the debonding step (or equivalently on the Force versus Displacement curve, since a constant speed is applied during debonding). Study of the shape of
the curve during debonding[35]and of the deformation behavior
during debonding[36]give additional insight on the energy
mea-sured, by splitting the total energy into cavitation and fibrillation contributions, as shown onFig. 1. Besides measurement of the force over time, optical video imaging has also been extensively used to explain the viscoelastic dissipation. It has been observed that a high tack adhesive exhibits cavitation during the early stage of
debonding, followed by extensive fibrillation [36]. Depending on
the rheological parameters of the adhesive, several cases can be observed during debonding (here, we consider a constant arbitrary debonding speed):
Table 1
Properties of the epoxy resins[22].
Uncured systems DER 332– MDEA DER 332-MDEA þ10% M52 DER 332– MDEAþ10% M22N Viscosity at 25 °C (Pa.s) 0.9 70.2 9.270.8 19.671.5 Fully cured systems DER 332– MDEA DER 332– MDEAþ10% M52 DER 332– MDEAþ10% M22N Tg(°C) 16773 17073 164 73 E (GPa) 2.7370.03 2.5570.03 2.61 70.03 KIC(MPa.m1/2) 0.89 70.04 1.2470.12 0.9870.05
(i) Failure during the debonding is brittle, and can be seen as either a cohesive or interfacial crack; this is likely to occur if the adhesive is highly entangled[35,37].
(ii) Cavitation occurs alone. Cavitation consists of the nucleation of existing bubbles or apparition of bubbles in liquid media, mainly due to a drop of pressure[38,39]. Cavitation may occur at either interfaces or in the bulk[30,40]; this is likely to occur if the adhesive has enough elasticity to allow the growth of bubbles, but not enough viscosity to be stretched;
(iii) Cavitation followed by fibrillation. Fibrillation consists of a bridge of polymer between the substrate and the probe; a good PSA will exhibit case (iii) behavior.
In case (ii), the separation can be seen as a competition between the propagation of a crack and the growth of the cavities
[41]. Case (iii) can be seen as a competition between either
(cavitation and fibrillation) or (cavitation, fingering and fibrilla-tion). Case (ii) and (iii) lead to different patterns, which are the witnesses of either kind of competition[42].
The experimental results reported in this paper focus on the influence of the addition of nanoparticles on the adherence of thermoset adhesives. Tack measurement on thermoset has not been yet reported, to our best knowledge. Since we use thermoset adhesives, we perform the tests before the adhesives are fully cross-linked. We then check if all the interpretations concerning the thermoplastic PSA can apply to thermoset adhesives at gel state.
The tack test is performed with a setup designed at our laboratory, schematically shown inFig. 2. The setup is adapted on a commercial, stress controlled rheometer (MCR302, Anton Paar). The force–dis-placement sensor of the device has a resolution in force of 0.05 N, and in vertical displacement 1 mm. Its compliance is estimated as 0.59 mN/ m. With the device, all the mechanical parameters of the test can be adjusted, such as the contact force, contact time and the rate of separation. A flat cylindrical steel probe (diameter: 6 mm) is mounted on the mobile arm of the device. The substrate is clipped on a steel fixture. Ballasts (i.e., weights) are added in order to prevent any movement of the fixture. The advantage of ballasts is that no screws are used to fix the sample on the fixture. This way, only the com-pliance of the rheometer is to take into account. The probe is brought into contact with the adhesive at a preselected rate, 0.1 mm/s. The motor is stopped when the preset force, F¼2 N, is reached upon contact. After a pre-selected time, tc¼5 s, the probe is separated from the adhesive at a constant rate, vdeb¼0.1 mm/s. The force–displace-ment sensor measures the force as a function of time during bond
formation and debond separation. The energy necessary to separate the probe from the adhesive is estimated as the area under the curve during the debonding step, by calculating the force versus the corre-sponding displacement. This energy, divided by the geometric contact area[35], gives the fracture energy per unit of interface, and char-acterize the bonding strength of the adhesive. Optical video imaging is performed by using high resolution cameras (1624 " 1236 pixels) synchronized with each other. One camera records the behavior of the adhesive during the test by the side, while the other records the adhesive under the probe, by focalizing on a flat mirror placed under the substrate fixture and oriented to 45°.
2.3. Protocol
The samples consist of a glass slide, a polytetrafluoroethylene (PTFE) mask and one of the adhesives to test. Firstly, the glass is cleaned by acetone ultra-sonication. In order to control the thickness of the adhesive prior to crosslinking, a PTFE mask is put on the glass slide. Profilometry experiment on several layer of PTFE shown a thickness of 100 mm71 mm. A mask consisting of 3 layers superimposed on each other lead to 300 mm. After posi-tioning carefully the PTFE mask, the adhesive is manually spread on the glass within the mask, by the help of a blade. Excess of adhesive is removed and once the desired thickness is achieved, the sample is placed under vacuum for 30 min, in order to remove air bubbles from the adhesive. Then, the sample is placed in an oven at 120 °C to allow crosslinking of the adhesive. After a given time, the sample is removed from the oven and cooled down to
0 5 10 15 20 25 Force (N) Time (s)
W
cav 0 20 40 0 20 40 0 5 10 15 20 25 Force (N) Time (s)W
fibFig. 1.Splitting the tack energy into two distinct contributions[36]. (a) Contribution of the cavitation to the tack energy. (b) Contribution of the fibrillation to the tack energy.
Side view
Bottom view
Cameras
Sample
Sensor
Steel probe
Mirror
Fig. 2.Schematic view of the experimental setup. The fixtures which maintain the sample and the sensor are not shown for clarity.
room temperature within 2 min. Cooling down the sample is necessary to stop the cross-linking reaction.
3. Results
3.1. Rheological characterization
The goal of the characterization is to define a gelation span. The main difficulty is to find a crosslinking temperature that gives reproducible results, while not having a too long crosslinking time. At our laboratory, these adhesives are usually cured 4 h00 at 160 °C followed by 1h15 at 190 °C. Dynamic isotherm rheological measurement were performed using a commercial rheometer (MCR302, Anton Paar), with the following parameters: strain: 0.01%, frequency: 1 Hz, parallel plate fixture (upper plate dia-meter: 25 mm, basin diadia-meter: 37 mm). The storage modulus G’ and the loss modulus G’’ were recorded during curing as a function of time at a constant temperature. The slope of the G’’ modulus gives an insight on the gelation kinetic: the more vertical the slope, the faster the kinetic. As can be seen inFig. 3, the HTA adhesive reaches its gel point after 40 min at 160 °C. To reduce the fast gelation, a lower temperature is required, which will require a longer crosslinking time. The same experiment was performed at 140 °C. At this temperature, the gel point is reached after 75 min. However, the gelation kinetic is still too fast, leading to poor reproducible preliminary tests. Finally, the choice falls on 120 °C with a crossover of the modulus around 200 min. This tempera-ture allowed reproducible preliminary results for the three adhe-sives. The isothermal kinetics of crosslinking are not shown for the two LTA adhesives.
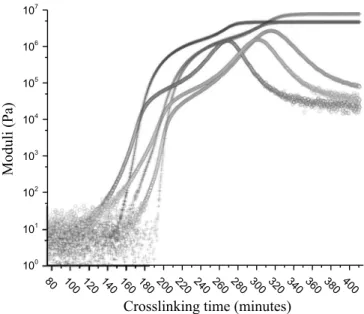
The storage modulus G’ and the loss modulus G’’ were recorded during curing as a function of time at a constant temperature of 120 °C, and are reported inFig. 4for the three adhesives. During the first moment of the curing, the adhesives are liquid, which can be seen on the curve by a wide scattering of the data. The main cause is that both moduli are below the range of measurement of the device. After a certain amount of time, the loss moduli begins to increase, as the adhesive approaches the gelation. When more time passes, G’ crosses G’’: the cross-over, in ideal network, cor-responds to the gelation point. This particular moment has been extensively studied for ideal and non-ideal networks[43,44]. After
the cross-over, gelation is over (i.e., the network begins 3D con-nections), which leads to an increase in G’ and a solid-like beha-vior. Vitrification can be seen by the “hill” on the G’’ curve[45]. It can be seen from those curves that the HTA adhesive needs a longer time (around 150 min) to reach gelation, but that the gelation kinetic is the shortest-the slope of the G’’ modulus is the highest. However, both LTA adhesives need less time to reach gelation (around 80 min), but their gelation kinetics is slower than the HTA, the slowest being the LTA M22N.
To check the gel state of an adhesive at room temperature, we measured the dynamic viscosity as a function of frequency. It has been shown that, in a liquid-like state, the dynamic viscosity in independent of frequency, with a zero slope at low frequencies. In a gel-like state, the dynamic viscosity behaves as a power law,
with a slope of %1 at low frequencies[44]. We first checked the
behavior of the HTA adhesive after it cured 200 min at 120 °C.
10-3 10-2 10-1 100 101 102 103 104 105 10-1 100 101 102 103 104 105 0 10 20 30 40 50 40 50 60 70 80 90 140 160 180 200 100 101 102 103 104 105
Moduli (Pa)
Time (Minutes)
Fig. 3.Isothermal kinetics of crosslinking for the HTA for three temperatures: 160 °C (left), 140 °C (middle), 120 °C (right). Solid cross: storage modulus G’. Open circle: loss modulus G’. 80 100 120 140 160 180 200 220 240 260 280 300 320 340 360 380 400 100 101 102 103 104 105 106 107
Moduli (Pa)
Crosslinking time (minutes)
Fig. 4.Isothermal crosslinking at 120 °C for HTA (red), LTA M52 (blue), and LTA M22N (green). The cross-over occurs respectively for the LTA M52, LTA M22N and HTA at 170, 190 and 200 min. (For interpretation of the references to color in this figure legend, the reader is referred to the web version of this article.)
FromFig. 5, it can be seen that the HTA adhesive behaves a solid at low frequencies, with a slope of %0.98. Then, we decreased the crosslinking time for each test by ten minutes, until we obtain a
liquid-like behavior. On Fig. 5, time from 190 min to 160 min
overlap and were omitted for clarity. During those times, the adhesive has a similar behavior as for 200 min. After curing 110 min at 120 °C, the adhesive behaved as a liquid. It can be seen inFig. 5
that this time corresponds to the last liquid-like state, at room temperature. The gelation span is thus defined as the interval between the last liquid-like state, and the first gel-like state. From
Fig. 5, the gelation for the HTA adhesive extends from 110 min and 150 min. Both LTA's gelation span were determined with the same method: the span for the LTA M52 extends from 80 min to 130 min, the one for the LTA M22N extends from 80 min to 150 min. 3.2. Influence of crosslinking time
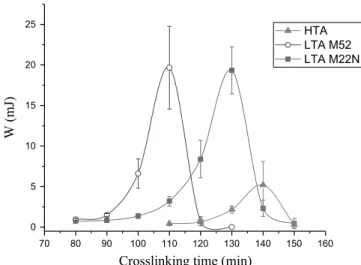
The tack energy is plotted against the crosslinking time for the
HTA, the LTA M52 and the LTA M22N inFig. 6. The first trend is
that the tack energy increases as the crosslinking time increases, up to a maximum, then abruptly decreases as the crosslinking time increases further. The maximum value is different for the three adhesives, and is much higher for both LTA compared to the HTA. However, the maximum values are close for both LTA. Up to and including the maximum value, the failure mode is cohesive in the adhesive. After the maximum value, the failure is interfacial at the probe/adhesive interface. This trend is observed for the three adhesives. Such behavior can be explained by the fact that, on a molecular point of view, the already cross-linked molecules form the gel part. The unlinked ones form the sol part. As cross-linking goes forward, the gel part increases, and the sol part is consumed in the process. This leads to a decrease in the ability of the adhesives to flow and relax stresses, hence a decrease in the tack energy for crosslinking time close to the gelation time (see
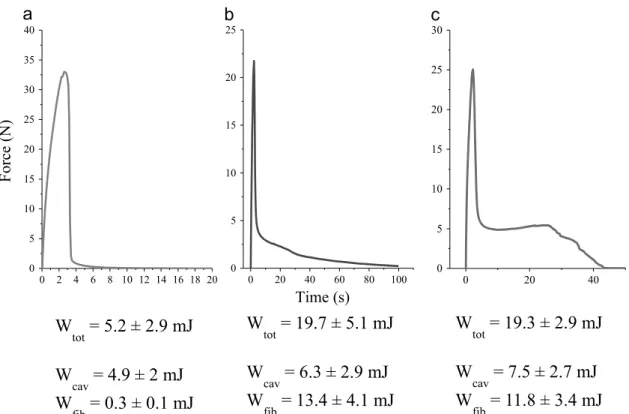
Fig. 5). For each adhesives, it is interesting to focus on the max-imum value of the energy, in order to attempt an explanation to this difference.Fig. 7shows a curve for the HTA, the LTA M52 and the LTA M22N, at respective cross-linking time of 140 min, 110 min and 130 min, corresponding to the maximum value of the energy. At those time of interest, the conversion rate was found to be respectively for the HTA, LTA M52 and LTA M22N equal to 0.5170.04, 0.4270.04 and 0.2970.04. The influence of those
values will be discussed later (see Interpretations section). The tack energy has been split up into a cavitation contribution Wcav and a fibrillation contribution Wfib, following Lakrout et al.[36]. It can be seen that both contributions increase when nanoparticles are added. The M52 nanoparticles increase mostly the fibrillation behavior of the adhesives, up to 68% of the tack energy (seeFig. 7). The M22N nanoparticles also, increase the fibrillation contribution, but to a lesser extent (61%). The next section deals in greater details of the influence of the nanoparticles on the tack energy measured. 3.3. Influence of the addition of nanoparticles
3.3.1. Observations: HTA
A curve Force versus Time is shown onFig. 8(left), for the HTA with a crosslinking time of 140 min. From the curve, it is clear that cavitation is the dominating phenomenon. The cavitation repre-sents up to 96% of the tack energy measured. On the right ofFig. 6
are shown images recorded by the cameras. The left column shows the adhesive under the probe. The right column shows the adhe-sive by the side. Images are taken respectively from top to bottom after 2, 4 and 20 s. After 2 s, many small bubbles are nucleated, and are expanding even though fibrillation did not occur yet. Those cavities are responsible of the peak force on the curve. At this time, a noise is often heard. 4 s after debonding, the force has dropped by a huge amount, due to the fact that cavities have expanded to their maximum. However, the force does not reach zero yet, as some fibrillation occurs. This fibrillation is weak, and as can be seen on the images, there are only a few fibrils bridging the sub-strate and the probe. Surprisingly, the fibrils can be stretched up to 2 cm without breaking, even if no force is required to stretch them. More, those fibrils are thin and narrow while stretched, which may explain that they do not dissipate energy while stretched. 3.3.2. Observations: LTA M52
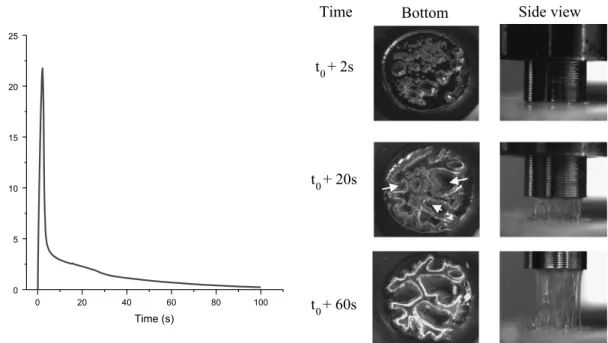
A curve Force versus Time is shown onFig. 9(left), for the LTA M52 with a crosslinking time of 110 min. 2 s after debonding, cavitation occurs at a relative slow rate, while fibrillation has not begun yet. The shape and size of the bubbles seem random: small, circular bubbles appear, as well as bigger, ellipsoidal ones. Cavi-tation may takes place in the bulk, but close to the adhesive/ substrate interface, as the post-mortem fracture profile does not show neat substrate part. It should also be noted that most of the bubbles nucleate at the center of the probe. At this time, the force measured is maximum. 20 s after debonding, the force measured has drop by a strong amount represented by a shoulder, but at this
0 1 1 1 , 0 102 103 104 105 106 107 108
Complex viscosity (Pa.s)
Frequency (Hz)
110 min 120 min 130 min 140 min 150 min 200 minFig. 5.Dynamic (complex) viscosity versus frequency at different crosslinking times for the HTA.
70 80 90 100 110 120 130 140 150 160 0 5 10 15 20 25
W (mJ)
Crosslinking time (min)
HTA LTA M52 LTA M22N
Fig. 6.Tack energy versus crosslinking time for the three adhesives. Solid lines are guides for eyes.
time, fibrillation already begun. From the bottom, it can be seen that some of the biggest bubbles formed swallowed smaller bub-bles. Also, some bubbles reached the border, allowing air to enter, and leading to the formation of a fingering pattern. On this image, the yellow arrows show the displacement of the bubbles. From the side view, fibrils are formed. Those are thick, and the density of fibrils is important. More, at this time, the fibrils stretch but do not
narrow. 60 s after debonding, a finger-like pattern can be seen from the bottom. From this time to the end of the test, this pattern will keep its shape: the pattern is now stable. From the side, the adhesive is still stretched. The main difference is that now, fibrils narrow over time. The beginning of the narrowing match the stabilization of the fingering pattern, which can be seen on the Force versus Displacement curve by a change in slope around 40 s.
0 2 4 6 8 10 12 14 16 18 20 0 5 10 15 20 25 30 35 40 0 20 40 60 80 100 0 5 10 15 20 25 0 20 40 0 5 10 15 20 25 30
Force
(N)
Time (s)
W
tot= 5.2 ± 2.9 mJ
W
cav= 4.9 ± 2 mJ
W
fib= 0.3 ± 0.1 mJ
W
tot= 19.7 ± 5.1 mJ
W
cav= 6.3 ± 2.9 mJ
W
fib= 13.4 ± 4.1 mJ
W
tot= 19.3 ± 2.9 mJ
W
cav= 7.5 ± 2.7 mJ
W
fib= 11.8 ± 3.4 mJ
Fig. 7.Typical curves Force versus Time for each adhesives ((a): HTA at 140 min, (b): LTA M52 at 110 min, (c): LTA M22N at 130 min) obtained at the maximum value of the tack energy.
Bottom view
Side view
Time
+ 2s
+ 4s
t
0t
0t
0+ 20s
0 1 2 3 4 5 6 7 8 9 10 11 12 13 14 15 16 17 18 19 20 0 5 10 15 20 25 30 35 40 Force (N) Time (s)The fibrils can be stretched up in a stable fashion up to 2 cm tall and certainly more if the device allowed it. After the test, the substrate and the probe are covered with adhesive: failure is cohesive in the bulk of the adhesive. It is noteworthy that the same finger-like pattern is formed on the probe, once the latter is removed for cleaning before the next test. This means that the whole description of the events that happen close to the adhesive/ substrate interface holds for the adhesive/probe interface. 3.3.3. Observations: LTA M22N
A curve Force versus Time is shown onFig. 10(left), for the LTA M22N with a crosslinking time of 130 min. 2 s after debonding, cavitation occurs at a slow pace. The bubbles formed are random
in shape and size, even if the differences between bubbles is not big. Bubbles also seem to appear randomly on the surface, and may be located close to the interface adhesive/substrate. As stated for the other adhesives, at this time, fibrillation has yet to begin. After 20 s, a foam-like pattern is formed. The bubbles grew, but none of them was able to coalesce with others. This pattern is slowly growing, and the border between bubbles is narrowing at the same rate. From the side view, the fibrils formed are stretched. Stretching the fibrils causes the foam-like pattern to narrow, until its stabilization. Once the foam-like pattern is stable, the fibrils cannot be stretched anymore, and begin to harden: this adhesive exhibits strain-hardening, which can be seen on the corresponding curve by an increase of the slope. 30 s after the debonding, the
0 20 40 60 80 100 0 5 10 15 20 25 Force (N) Time (s)
Bottom
Side view
Time
t
0+ 2s
t
0+ 20s
t
0+ 60s
Fig. 9.Left: curve Force versus Time of the LTA M52 after 110 min. Right: Optical-video images of the behavior of chosen time, corresponding to the three part of the curve.. The yellow arrows show the direction of the displacement of the bubbles (see text). (For interpretation of the references to color in this figure legend, the reader is referred to the web version of this article.)
Bottom view
Side view
Time
t
0+ 2s
t
0+ 20s
t
0+ 30s
0 20 40 60 0 5 10 15 20 25 Force (N) Time (s)Fig. 10.Left: curve Force versus Time of the LTA M22N after 130 min. Right: Optical-video images of the behavior of chosen time, corresponding to the three part of the curve.
fibrils have been extended to their maximum, and now begin to break. The fibrils sequentially break close to the adhesive/probe interface, but the locus of failure is in the fibrils.
3.3.4. Interpretations
The visualization of the HTA adhesive shows that the cavitation within the adhesive occurs in a short time, such as the bubbles have no time to merge. This can be seen as crack propagating in the bulk of the adhesive, since a noise is often (but not always) heard. The HTA adhesive exhibits case (i) debonding: the failure is brittle-like, and cohesive in the bulk of the adhesive. However, the crack does not separate completely the two sides, since some fibrils exist after. The fibrils seem to be located on the border of the initial contact area: the only locus where bubbles didn’t nucleate. As stated in the observations section, fibrillation does not dissipate energy. In fact, in the case of the HTA, forming the fibrils costs energy, but stretching the fibrils does not. In a rheological point of view, the adhesive is not a gel yet. It still contains singles mole-cules (pre-polymer or hardener) which have yet to react. Indeed, at this time, the crosslinking conversion rate is 0.5170.04. This means that there is the same amount of already cross-linked molecules (gel part) as singles molecules (sol part). Then, the gel part, which is responsible of elasticity, may be screened by the sol part[46], preventing physical entanglements of the gel part and leading to a liquid-like behavior during fibrillation.
The behavior of the LTA M52 is quite different. The curve
shown inFig. 9may be separated in 3 regions: a force peak, and
two different slopes. As stated above, the peak force is attributed to the cavitation. The first slope (between 5 and 40 s) is due to a case (iii) debonding. During this time, the bigger bubbles grow to a point where they swallow surroundings bubbles, leading to a finger-like pattern. This pattern is mainly due to vertical flow of the adhesive: for the debonding rate applied, the adhesive first behaves as a liquid, and is swallowed by the probe. Around 40 s, the maximal quantity of swallowed adhesive is reached: adhesive flow is not possible anymore. At this point, a change in slope is noticeable: since the adhesive cannot flow anymore, it begins to be stretched, leading to a stable finger-like pattern, and an extensive stretching of fibrils (more than 2 cm tall). At first, the molecules are re-organized (i.e., the molecules flow) to follow the probe’s movement. Once all the molecules are oriented, the adhesive is stretched. The crosslinking conversion rate being 0.4270.04, les-ser than HTA at the maximum of tack energy, the elasticity increase of the adhesive is mainly due to the nanoparticles added by providing more physical entanglements, allowing stable stretching after flowing, hence an increase of the fibrillation con-tribution seen inFig. 7.
The behavior of the LTA M22N is again different from the other adhesives.
The Force versus Time curve may be split up into three parts: the force peak is due to cavitation.
After nucleating, the bubbles and fibrils grow at the same time, leading to a competition between those two phenomena. This competition is seen on the curve by an increase in slope between 5 and 25 s. During this time, the fibrils harden: the adhesive exhibits strain-hardening. The maximum strain the fibrils can withstand is about 7%, which corresponds to a maximal height of 2.5 mm. The crosslinking conversion rate is 0.2970.04, lesser than the two other adhesives at the maximum of tack energy. The behavior of the LTA M22N may be explained this time by the presence of DMA units on the PMMA block of the M22N. After the supplier, the DMA unit add more polarity to the copolymer. Hence, polar interaction should be taken into account in addition of the physical entanglements, explaining that a tack energy similar to the one of the LTA M52 is achieved at a lower conversion rate. The polar interactions increase the cohesive strength of the adhesive,
preventing the adhesive to be extensively stretched, leading to the failure of fibrils.
The addition of nanoparticles increases both the cavitation and fibrillation behavior of the adhesives, allowing more energy to be dissipated. FromFig. 7it can be seen that the LTA M22N dissipates more energy by cavitation than the LTA M52 (respectively, adding M22N nanoparticles increase this contribution by 35%, and by 23% for M52 addition, compared to the HTA). This difference may be explained by the difference in viscosity, the LTA M22N having the highest, which means a higher ability to dissipates energy. Hence, it would require more energy to nucleate and expand a bubble in this adhesive. Also, it would explain that the LTA M22N is able to form a foam-like pattern (which can be seen as a crack arrest), while the LTA M52 is only able to slow down crack propagation. However, the LTA M52 dissipates more energy by fibrillation than the LTA M22N. This trend may be due to a more ductile behavior of the LTA M52 (it has the highest KIcvalue, seeTable 1). Indeed, this adhesive has a higher Poly(Butyl-acrylate) soft block content[31]
which should mean a higher elongation at break. This fact would explain why the fibrils broke in the case of the LTA M22N but not in the LTA M52.Of course, the increased polarity of the LTA M22N plays a major role in this phenomenon, by supposedly enhancing the cohesive strength of this adhesive.
4. Conclusion
We took on the challenge to measure the energy of adherence of thermoset adhesives at gel state by a probe tack test. From a rheolo-gical point of view, the addition of thermoplastic copolymer tri-block changed the cross-linking kinetic. Both LTA adhesives reached the moduli cross-over faster than the HTA adhesive (respectively 170, 190 and 200 min for the LTA M52, the LTA M22N and the HTA). However, both LTA had a slower gelation kinetic than the HTA: the LTA adhe-sives needed more time to reach the cross-over. A method was pro-posed to determine the interval within which the thermoset adhesives behave as a gel at room temperature. This method was found to be reliable for thermoset adhesives, and may be used when one needs to check the gel state of a thermoset adhesive after a given amount of curing. By using a probe tack test, we were able to study the impact of the addition of nanoparticles on the dissipative behavior of thermoset adhesives in a gel state. We reported the influence of crosslinking on the energy of adherence, for each adhesive. It was shown that this energy increases up to a maximum before decreasing abruptly. This maximum occurred when the adhesive behaves as a gel at room temperature, for the three adhesives. Both nanoparticles filled adhe-sives had a lower conversion rate than the reference adhesive, but showed an improved energy of adherence. The overall enhancement of the energy of adherence measured was attributed to an increase in both the cavitation and the fibrillation behavior of the adhesives. The enhancement of the cavitation contribution was attributed to an increased viscosity, which helps to dissipate more energy by slowing down the nucleation and expansion of the cavities. The enhancement of the fibrillation contribution was attributed to the ability of the nanoparticles to develop more elasticity, supposedly by providing more physical entanglements between epoxy chains. We showed that the failure criterion for explaining the behavior of the adhesives during the debonding can apply to thermoset adhesives at gel state as well. In-depth investigations on the application of those criterion are required, especially to attempt a deeper explanation of the differences between the LTA adhesives. An on-going investigation concerns the impact of the surface treatment of the substrate on the adherence measured. Changing the substrate/adhesive interactions will help to a better understanding of the differences between the two nanoparticles filled adhesives. Ultimately, wedge tests will be performed on all adhesives (HTA, LTA M52 an LTA M22N). This will allow to study the
influence of the addition of the nanoparticles on the structural bonding properties of the fully cross-linked adhesives.
References
[1]Djilali T, Nassiet V, Hassoune-Rhabbour B. Graft interpenetrating continuous epoxy-polysiloxane polymeric network. Key Eng Mater 2010;446:111–9. [2] Yorkgitis EM, Eiss Jr. NS, Tran C, Wilkes GL, McGrath JE. Epoxy resins and
composites I. In: Siloxane-modified epoxy resins. Springer; 1985. p. 79–109. [3]Yilgor E, Yilgor I. 1, 3-bis (γ-aminopropyl) tetramethyldisiloxane modified
epoxy resins: curing and characterization. Polymer 1998;39:1691–5. [4] McGarry FJ, Willner AM. Research Report R68-8. Massachusetts Inst 1968. [5]Ikram S, Munir A, et al. Mechanical and thermal properties of chemically
modified epoxy resin. Open J Synth Theory Appl 2012;1:36.
[6]Sultan JN, McGarry FJ. Effect of rubber particle size on deformation mechan-isms in glassy epoxy. Polym Eng Sci 1973;13:29–34.
[7]Pearson RA, Yee AF. Toughening mechanisms in thermoplastic-modified epoxies: 1. Modification using poly (phenylene oxide). Polym (Guildf) 1993;34:3658–70.
[8] Franco M, Corcuera MA, Gavalda JNA, Valea A, Mondragon I. Influence of curing conditions on the morphology and physical properties of epoxy resins modified with a liquid polyamine. J Polym Sci Part B Polym Phys 1997;35:233–40.http: //dx.doi.org/10.1002/(sici)1099-0488(19970130)35:2o233::aid-polb443.0. co;2-t.
[9]Franco M, Mondragon I, Bucknall CB. Blends of epoxy resin with amine-terminated polyoxypropylene elastomer: Morphology and properties. J Appl Polym Sci 1999;72:427–34.
[10]Sauvant V, Halary JL. Novel formulations of high-performance epoxy–amine networks based on the use of nanoscale phase-separated antiplasticizers. J Appl Polym Sci 2001;82:759–74.
[11]Sauvant V, Halary JL. Improvement of the performance of epoxy-amine ther-mosets by antiplasticizer-induced nano-scale phase separation during cure. Compos Sci Technol 2002;62:481–6.
[12] Girodet C, Espuche E, Sautereau H, Chabert B, Ganga R, Valot E. Influence of the addition of thermoplastic preformed particles on the properties of an epoxy/anhydride network. J Mater Sci 1996;31:2997–3002.http://dx.doi.org/ 10.1007/BF00356014.
[13] Girard-Reydet E, Sautereau H, Pascault JP. Use of block copolymers to control the morphologies and properties of thermoplastic/thermoset blends. Polymer 1999;40:1677–87.http://dx.doi.org/10.1016/S0032-3861(98)00302-4. [14] Rio TG, Rodriguez J, Pearson RA. Compressive properties of nanoparticle
modified epoxy resin at different strain rates. Compos Part B Eng 2014;57:173– 9.http://dx.doi.org/10.1016/j.compositesb.2013.10.002.
[15] Halawani N, Auge J-L, Pruvost S, Gain O. Epoxy composites for insulating properties. Adv. Commun. Comput. Technol. (ICACACT), Int. Conf. 2014, p. 547– 550.
[16]Yang X, Yi F, Xin Z, Zheng S. Morphology and mechanical properties of nanostructured blends of epoxy resin with poly (ɛ-caprolactone)-block-poly (butadiene-co-acrylonitrile)-block-poly (ɛ-caprolactone) triblock copolymer. Polymer 2009;50:4089–100.
[17] Hernandez M, Sixou B, Duchet J, Sautereau H. The effect of dispersion state on PMMA–epoxy–clay ternary blends: In situ study and final morphologies. Polymer 2007;48:4075–86.http://dx.doi.org/10.1016/j.polymer.2007.05.013. [18] Gómez-Del Río T, Rodríguez J, Pearson R a. Compressive properties of
nano-particle modified epoxy resin at different strain rates. Compos Part B Eng 2014;57:173–9.http://dx.doi.org/10.1016/j.compositesb.2013.10.002. [19] Remiro P, Marieta C, Riccardi C, Mondragon I. Influence of curing conditions on
the morphologies of a PMMA-modified epoxy matrix. Polymer 2001;42:09909– 14.http://dx.doi.org/10.1016/S0032-3861(01)00564-X.
[20] Barsotti R. Nanostrength block copolymers for epoxy toughening. In: Pro-ceedings of the 67th Annu Tech Conf Soc Plast Eng. 2009. p. 1337–41.
[21] Chae H, Hyun K, Ok S, Moon D, Choe Y. Preparation and mechanical char-acterization of tack-free surfaced CSR/Epoxy Adhesive Films. Mol Cryst Liquid Cryst 2012;566(100):15.http://dx.doi.org/10.1080/15421406.2012.701845. [22] Brethous R, Nassiet V, Hassoune-Rhabbour B. Models of adhesive bonding of
hybrid structures. Key Eng Mater 2013;550:143–55.
[23] Fine T. SBlock copolymers designed for epoxy/General presentation : nanos-trength for epoxy. Arkéma 2009.
[24] Chen J, Taylor AC. Epoxy modified with triblock copolymers: morphology, mechanical properties and fracture mechanisms. J Mater Sci 2012;47:4546–60.
http://dx.doi.org/10.1007/s10853-012-6313-6.
[25] Brethous R. Assemblages collés modèles à base d’adhésifs nanostructurés: interdiffusion entre des copolymères triblocs et une résine époxyde. France: Univérsité de Toulouse; 2013.
[26] Gent AN, Hamed GR, Kroschwitz JI, Mark HF, Bikales NM, Overberger CJ, et al. Encyclopedia of Polymer Science and Technology. . New York: Wiley; 1985. [27] Mittal KL. Adhesion measurement of thin films. Act Passiv Electron
Compo-nents 1976;3:21–42.
[28] Kinloch AJ. The science of adhesion. J Mater Sci 1982;17:617–51.
[29] Hooker JC, Creton C, Tordjeman P. Probe tests investigations of bulk and sur-face cavitation processes on model Psa’ S. In: Proceedings of the 5th Eur. Adhes. Conf. 2000.
[30] Creton C, Fabre P Tack. Adhes Sci Sci Eng, vol I, Mech Adhes, II 2002. p. 535–76. [31] Arkéma. Technical data sheet-nanostrength for epoxies. Paris, Fr. 2011. [32] Ondarçuhu T. Tack of a polymer melt: adhesion measurements and fracture
profile observations. J Phys II 1997;7:1893–916.
[33] Wu G, Jiang Y, Ye L, Zeng S, Yu P, Xu W. A novel UV-crosslinked pressure-sensitive adhesive based on photoinitiator-grafted SBS. Int J Adhes Adhes 2010;30:43–6.
[34] Gdalin BE, Bermesheva EV, Shandryuk G a, Feldstein MM. Effect of tempera-ture on probe tack adhesion: extension of the dahlquist criterion of tack. J Adhes 2011;87:111–38.http://dx.doi.org/10.1080/00218464.2011.545325. [35] Zosel A. Effect of cross-linking on tack and peel strength of polymers. J Adhes
1991;34:201–9.http://dx.doi.org/10.1080/00218469108026514.
[36] Lakrout H, Sergot P, Creton C. Direct observation of cavitation and fibrillation in a probe tack experiment on model acrylic pressure-sensitive-adhesives. J Adhes 1999;69:307–59.http://dx.doi.org/10.1080/00218469908017233. [37] Nakamura Y, Yamamura K, Karyu N, Shitajima K, Fujii S, Urahama Y. Influences
of debonding rate and temperature on tack properties and peel behavior of polyacrylic block copolymer/tackifier system. J Adhes Sci Technol 2015;29:821–38.http://dx.doi.org/10.1080/01694243.2015.1004509. [38] Plesset MS. The dynamics of cavitation bubbles. J Appl Mech 1949;16:277–82. [39] Brennen CE. Cavitation and Bubble Dynamics. 2013 doi: 10.1017/
CBO9781107338760.
[40] Crosby AJ, Shull KR, Lakrout HCC. Deformation and failure modes of adhesively bonded elastic layers. J Appl Phys 2000;88:2956–66. http://dx.doi.org/ 10.1063/1.1288017.
[41]Teisseire J, Nallet F, Fabre P, Gay C. Understanding cracking versus cavitation in pressure-sensitive adhesives: The role of kinetics. J Adhes 2007;83:613–77. [42] Poivet S, Nallet F, Gay C, Teisseire J, Fabre P. Force response of a viscous liquid
in a probe-tack geometry: fingering versus cavitation. Eur Phys J E Soft Matter 2004;15:97–116.http://dx.doi.org/10.1140/epje/i2004-10040-2.
[43] Chambon F, Winter HH. Stopping of crosslinking reaction in a PDMS polymer at the gel point. Polym Bull 1985;13:499–503.
[44]Chambon F, Winter HH. Linear viscoelasticity at the gel point of a crosslinking PDMS with imbalanced stoichiometry. J Rheol 1987;31:683–97.
[45] Lairez D, Adam M, Emery JR, Durand D. Rheological behavior of an epoxy/ amine system near the gel point. Macromolecules 1992;25:286–9. [46] Muller R, Gerard E, Dugand P, Rempp P, Gnanou Y. Rheological
characteriza-tion of the gel point: a new interpretacharacteriza-tion. Macromolecules 1991;24:1321–6.
![Fig. 1. Splitting the tack energy into two distinct contributions [36]. (a) Contribution of the cavitation to the tack energy](https://thumb-eu.123doks.com/thumbv2/123doknet/3202961.91531/4.892.125.761.122.392/fig-splitting-energy-distinct-contributions-contribution-cavitation-energy.webp)