OATAO is an open access repository that collects the work of Toulouse
researchers and makes it freely available over the web where possible
Any correspondence concerning this service should be sent
to the repository administrator:
[email protected]
This is an author’s version published in: http://oatao.univ-toulouse.fr/21109
To cite this version:
Perez Gallardo, Jorge Raúl
and Azzaro-Pantel, Catherine
and Astier,
Stéphan
Combining Multi-Objective Optimization, Principal Component
Analysis and Multiple Criteria Decision Making for ecodesign of photovoltaic
grid-connected systems. (2018) Sustainable Energy Technologies and
Assessments, 27. 94-101. ISSN 2213-1388
Official URL:
https://doi.org/10.1016/j.seta.2018.03.008
Combining
Multi-Objective Optimization, Principal Component Analysis
and
Multiple Criteria Decision Making for ecodesign of photovoltaic
grid-connected
systems
J.
Raul Perez-Gallardo
a,1,
Catherine Azzaro-Pantel
a,⁎,
Stéphan Astier
baLaboratoire de Génie Chimique, Université de Toulouse, CNRS, Toulouse, France bLAPLACE, Université de Toulouse, CNRS, Toulouse, France
A B S T R A C T
Photovoltaic grid-connected systems (PVGCS) promise to be a major contributor of the future global energy system. Even if no GreenHouse Gases (GHG) are emitted during their operation phase, emissions are generated by the use of fossil fuel-based energy during the manufacture, building and recycling of the components. An integrated ecodesign framework that simultaneously manages technical, economic and environmental criteria for the design and sizing of PVGCS (cradle-to-gate approach) is presented in this work. A Multi-Objective Optimization problem embedded in an external multi-objective Genetic Algorithm (NGSA II) optimization loop generates a set of Pareto solutions representing the optimal trade-off between the objectives considered. Then a decision-making tool (M-TOPSIS) selects the solution providing the best compromise. The Life Cycle Assessment (LCA) method was selected to assess the environmental impact. Five commercial PV technologies were evaluated to generate alternatives of PVGCS configurations through a set of 18 objectives (two technical and one economic criteria as well as the 15 midpoint categories of the IMPACT 2002+ method). After a statistical analysis of the first results, the Principal Component Analysis (PCA) method was applied to remove redundant objectives, thus leading to only four contradictory objectives. The results highlight the advantage of the use of thin-film PV modules over crystalline-Si based PV modules.
Introduction
Photovoltaic grid-connected systems (PVGCS), a “clean” energy supplier, represent an important alternative for dealing with the in-creasing demand for energy worldwide and the widespread damage caused by intensive use of fossil sources as well as for coping with the scarcity of fossil fuels by transforming incident solar energy to elec-tricity[1]. Even if they do not generate any particulate matter emis-sions during the operation phase and require no fluid maintenance, emissions are generated by the use of fossil-fuel-based energy during the manufacture of the components, the building of the system and the subsequent recycling of the components[2,3].
The growing awareness in society for environmental issues has motivated the development of strategies that include environmental
consideration through the design process of a product or service espe-cially for those labeled as eco-friendly. Integrating the environmental dimension into system design can yet result in a complex process. Indeed, the designer must ensure that the functions, techniques and technological solutions are integrated in an appropriate manner while respecting the best possible environmental performance over the whole life-cycle of the system. Ecodesign is the term used to group almost all the processes and approaches related to the integration of environ-mental considerations in the product or system design throughout their life-cycle[4]ensuring similar or improved services to the end customer [5,6].
Fargnoli and Kimura[7]evaluate some ecodesign tools considering six main properties able to address designers in choosing the most suitable design tools for the development of sustainable products,
Abbreviations: AA, Aquatic Acidification; AE, Aquatic Ecotoxicity; AEU, Aquatic Eutrophication; C, Carcinogen; CdTe, Cadmium-Telluride; CIS, Copper-Indium-Selenide; CUT, cut-off value; EPBT, Energy Payback Time; GA, Genetic Algorithms; GW, Global Warming; IR, Ionizing Radiation; LCA, Life Cycle Assessment; LO, Land Occupation; MCDM, Multiple Criteria Decision Making; ME, Mineral Extraction; NC, Non-Carcinogen; NR, Non-Renewable energy; OLD, Ozone Layer Depletion; PBT, Investment Payback Time; PC, principal component; PCA, Principal Component Analysis; PV, Photovoltaic; PVGCS, photovoltaic grid-connected systems; RA, Risk Assessment; RI, Respiratory Inorganic; RO, Respiratory Organic; a-Si, amorphous silicon; c-Si, crystalline-Silicon; m-Si, mono-crystalline; p-Si, poly-crystalline; TAN, Terrestrial Acidification/Nitrification; TE, Terrestrial Ecotoxicity; TF, thin film
concluding that there is not one method that emerges significantly from others. This work highlights the advantages of using a quantitative method to assess the environmental performance of the product or service under study that has to be considered at the early design stage. According to Sadler and Verheem[8], environmental assessment is defined as a systematic process for evaluating and documenting in-formation on the potentials, capacities and functions of natural systems and resources in order to facilitate sustainable development planning and decision-making in general, and to anticipate and manage the ad-verse effects and consequences of proposed undertakings in particular. There are many different procedures and methods to assess the en-vironmental issues or impacts such as Enen-vironmental Impact Assess-ment, Material Flow Analysis, Material Intensity per Unit Service, Risk Assessment (RA) and Life Cycle Assessment (LCA). LCA and RA methods are the most cited approaches in literature works to support decision-making in environmental management. The strengths and weaknesses of both methods have been reported by several authors [9,10]. It is generally highlighted that the boundaries of a risk analysis (including Risk Assessment and risk management) can be too narrow compared to those considered in LCA, encompassing the systemic en-vironmental consequences of a typical product, process or service. The important distinction between LCA and more narrowly focused analytic approaches such as RA is the accounting of emissions and/or resource consumption such as extraction of raw materials, processing, distribu-tion, use of the product, recycling and, disposal offinal waste. This
motivates the choice of LCA as a systemic environmental assessment method. Let us recall that LCA is also widely used in industry[11,12] and allows comparing the assessment of the alternatives focused on a specific functional unit. It evaluates each life-cycle stage of the product under evaluation, classifies and characterizes the emissions in several and diverse environmental categories. More generally, LCA can be in-tegrated into an environmental decision support tool combining social, political, economic and technical considerations, as highlighted in this work.
In the quest for more sustainable energy systems, the design of PVGCS is of tremendous importance. PVGCS, the most popular type of solar PV system, is integrated with three key elements: PV modules, DC/AC inverter, and mounting system. PV modules constitute the core of the system to convert solar energy into electricity. They are also the most sensitive component because the type of material used in their manufacture, the solar irradiance and weather condition principally affect their conversion efficiency. In general, the cost of the PV modules still dominates the price of large-scale PVGCS even if the prices of PV modules have been reduced substantially in recent years.
PV modules are grouped intofirst, second or third generation ac-cording to the technology used for solar cell manufacturing. The crys-talline-Silicon technology (c-Si), i.e., the first generation includes modules made by silicon cells as mono-crystalline (m-Si) or poly-crys-talline (p-Si). The so-called thinfilm (TF) PV modules are considered as second-generation of PV technologies. It includes three main families: Nomenclature
β PV collector inclination angle, degree
A+, A− ideal and non-ideal solution in M-TOPSIS method
aij normalized result of alternative i into the criterion j
D distance between PV sheds, m
Dmin minimum distance between PV sheds, m
Di+, Di– Euclidean distance for ideal and non-ideal solution for
alternative i
Emax maximum PV collector height above ground, m
H PV collector height, m
Hmax maximum PV collector height, m
K number of PV sheds L solarfield length, m LC PV collector length, m
Lmax maximum solarfield length, m
LossPVη number of energy loss due to module efficiency, kWh
LossDC / ACη number of energy loss due to DC/AC inverter
effi-ciency, kWh
LossShading number of energy loss due to the shading effect, kWh
LossMismatch number of energy loss due to the mismatch, kWh
Nc number of PV modules columns in the collector
Nr number of PV modules rows in the collector
Qout yearly output energy of thefield, kWh
QMAX maximum incident energy that the PVGCS can
re-ceive, kWh W solarfield width, m
Wmax maximum solarfield width, m
vij weighted normalized result of alternative i into the
criterion j
wj weight of the individual criterion j
Xij value of alternative i into the criterion j
Decision Making (MCDM) tools.
Solar irradiance estimation and mathematical sizing model
The first three models of the methodological framework are in charge of:
a) estimating solar radiation received by the system according to the geographic location (see Perez-Gallardo et al.[25]for more details of this model);
b) sizing the PVGCS based on a mathematical model that provides the annual energy generated from the characteristics of the system components and limitations on the design of the installation; and, c) evaluating the economic, technical and environmental criteria.
The multi-objective problem formulated for the ecodesign of PVGCS considers as techno-economic objectives the output energy (Qout), the
Investment Payback Time (PBT) and the Energy Payback Time (EPBT). The losses inherent in any energy conversion have a variety of origins, e.g. shading between PV modules, the efficiency of elements, and array mismatch losses. So, Qoutcan be expressed as:
= − + + +
Qout QMAX (LossPVη LossDC ACη/ LossShading LossMismatch) (1) where QMAXis the maximum incident energy that the facility can
re-ceive. LossPVη , LossDC/ACη, LossShading and LossMismatch represent the
number of energy losses due to the four most important causes (module efficiency, inverter efficiency, shading, and mismatch).
PBT refers to the estimation of the time to recover the initial in-vestment is necessary for an investor:
=
PBT Initial investment
Annual cash inflows (2)
The initial investment of the project considers the purchasing cost of all the components that make up the installation (PV modules, cables, mounting system, etc.), the construction and the edification cost as well as the cost of connection to the grid. The annualized cash flow re-presents the income derived from selling all the energy production.
EPBT is the period needed by the renewable energy system to generate the same amount of energy (in terms of primary energy equivalent) as the mount that is consumed in its whole life cycle[26]. To convert annual power generation (kWh) of electricity to primary energy, the efficiency of power plants in the country under considera-tion is taken into account[27].
=
EPBT Primary energy required for manufacturing
Annual primary energy produced (3)
DC/AC inverter local D D H cos β
...
...
...
...
K = 1 K = 2 K-1 KZ
Y
X
ȕ ȕ HE
maxD
W
L
C W E N SK=1
K=2
Fig. 2. Stationary solar collectorfield design used to formulate the multi-objective problem.
amorphous silicon (a-Si), Cadmium-Telluride (CdTe) and Copper-Indium-Selenide (CIS). There are four types of third-generation PV technologies: concentrating PV (CPV), dry-sensitized solar cells (DSSC), organic solar cells and, novel and emerging solar cell concepts. PV modules of first and second generations have currently the highest market share (more than 90%).
The main difference among PV technologies is related to the con-version efficiency of the PV module. Even if c-Si technologies have the highest performance, TF technologies have substantially improved their performance due to the advances in recent years [13]. The type of PV technology selected for a PVGCS has a big relevance depending on the context in which it will be used. At present, PVGCS larger than 50 megawatts in current net capacity use either c-Si or TF PV modules.
LCA analysis carried out for PV systems show that the PV modules contribute the most to the overall environmental impact. Among the common PV modules, the CdTe PV technology presents the best en-vironmental performance whereas the m-Si PV module demonstrates the worst because of its high energy consumption during the solar cells’ production process [14–16].
Despite the interest in considering environmental impact at the early design stage of a PVGCS, the majority of the reported works can be grouped into two categories, those considering the technical feasi-bility and/or economic concerns [17–21], and those relative to en-vironmental assessment [22–24].
The main objective of this paper is to develop a methodology that includes environmental assessment in the early stages of the design and sizing of a PVGCS and takes the techno-economic aspects into account. Methods and tools
Methodological framework
In any PV system, sizing represents an important part. Sizing of a PV system means determining how much energy is required and how many PV modules are needed to generate it. The design model which evalu-ates the techno-economic and environmental criteria simultaneously presented in detail in a previous work [25] was built in an open manner in order to interface easily with an external optimization loop. Fig. 1 shows the extended flow diagram of the methodology proposed for optimizing a PVGCS, taking into account both the Multi-Objective Optimization framework and the reduction of objectives via Principal Component Analysis (PCA).
The developed system is a simulation tool coupled with an optimi-zation module for optimal configuration alternatives combining a Multi-Objective Optimization method, PCA and Multiple Criteria
− + − ⩽ ⩾ ⩽ ⩽ ⩽ ⩽ ⩽ ∈ ∘ ∘ +
Qout PBT EPBT AA AE AEU C GW IR LO ME NC NR OLD RI RO TAN TE KH β K D W D D H β E H H β K Z Minimize{ , , , , , , , , , , , , , , , , , } Subject to: cos ( 1) sin 0 90 2 min max max (4) Multi-objective Genetic Algorithm
In many real-life problems, the objectives under consideration conflict with each other. A reasonable solution is to investigate a set of alternatives that satisfies the objectives at an acceptable level without being dominated by any other solution. Genetic Algorithms (GA) are well suited to solve Multi-Objective Optimization problems [30,31]. The ability of GA to simultaneously search different regions of a solu-tion space makes it possible to find a diverse set of non-dominated solutions for difficult problems.
When moving from one Pareto optimal solution to another one, there is always a certain amount of sacrifice of one objective to achieve a certain amount of gain in another. For a given Pareto optimal set of solutions, the corresponding objective function values in the objective space are called the Pareto front. The ultimate goal of a Multi-Objective Optimization algorithm is to identify solutions in the Pareto optimal set. The MULTIGEN environment previously developed by our research group[32]was chosen as the Genetic Algorithm platform. A variant of NSGA-II developed for mixed problems and implemented in the MUL-TIGEN environment was selected.
Multiple-criteria decision-making
To select the alternative that represents the best trade-off among those of the Pareto front, an MCDM has proved to be a solution in
engineering applications. MCDM methods deal with the process of making decisions in the presence of multiple objectives. The objectives are usually conflicting and, therefore, the solution is highly dependent on the preferences of the decision-maker and must be a compromise. Environmental applications of MCDM are reviewed in[33,34]. Among those considered, TOPSIS (Technique for Order Preference by Similarity to the Ideal Solution) is attractive because it requires only subjective input from decision makers, via the assignation of a weight to each objective, which makes it popular in engineering applications and Ecodesign processes[35–37]. The basic idea of TOPSIS method is to choose a solution that is closest to the ideal solution (better on all criteria) and furthest away from the worst (which degrades all criteria). M-TOPSIS [38], a variant of TOPSIS, was adopted in this work. The steps of the M-TOPSIS procedure are listed below.
Step 1: Build the decision matrix. Establish a matrix which shows m alternatives evaluated by the n criteria chosen. Usually, the cost criteria are transformed into benefit criteria by the reciprocal ratio method as it shown in Eq.(5) [38].
′ =
Xij 1/Xij (5)
In where Xijrepresents the value of alternative i into the criterion j.
Step 2: Calculate the normalized decision matrix A. The values in the decision matrix X are transformed into normalized, non-dimen-sional values in order to convert the original values within the interval [0,1] as follows:
∑
= = ′ ′ = A [ ],aij aij Xij/ (X ) i n ij 1 2 (6) where aijstands for the normalized value; i = 1, 2,…, m; j = 1, 2, …, nStep 3: Coefficient vector of the importance of each criterion. Assign weights of importance to a criterion relative to others. The weighted normalized matrix V is calculated by:
= =
V [ ],vij vij w aj ij (7)
where wjstands for the weight of the individual criterion j; i = 1, 2,…,
m; j = 1, 2,…, n.
Step 4: Determine the positive ideal (A+) and negative ideal (A–)
solution from the matrix A:
= = ∈ ∈ + + + + + + − A {v v, ,...,vn}, vj {max( ),v j J ;min( ),v j J } i ij i ij 1 2 (8) = = ∈ ∈ − − − − − + − A {v v, ,...,vn}, vj {min( ),v j J ;max( ),v j J } i ij i ij 1 2 (9)
where J+= {i = 1, 2,…, m} when i is associated with benefit criteria;
J−= {i = 1, 2,…, m} when i is associated with cost criteria. j = 1, 2, …, n.
Step 5: Calculate Euclidean distance:
∑
= − + = + Di (v v) j n j ij 1 (10)∑
= − − = − Di (v v) j n j ij 1 (11) for i = 1, 2,…, m.Step 6: Calculate the relative closeness to the ideal solution, i.e. the distance between the ideal criteria set values (A+) and non-ideal
cri-teria set values (A−). The ratio value of Riis calculated as follows:
= +− + + −− −
Ri (Di min(D ))2 (Di max(D ))2 (12)
where i = 1, 2,…, m.
Step 7: Rank alternatives in increasing order according to the ratio value of Ri. The best alternative corresponds to the M-TOPSIS
coeffi-cient Rinearest to 0.
The environmental assessment was performed following the guide-lines given by the LCA methodology [26] using the software tool Si-maPro 7.3. To evaluate different PV technologies, the number of panels required to meet a given amount of energy is considered. The minimum number of panels required to meet a demand of 1 kWh with an average daily irradiance of 1 kWh/m2 is computed. The functional unit is the
demand of 1 kWh.
The system boundaries were the same as in Perez-Gallardo et al. [25]. The boundary includes the extraction of materials to the design of PV module. The recycling processes of the different components of PVGCS are not included in this study due to lack of reliable information for all PV modules technologies evaluated. A 20-year operation period for the PVCGS was selected. The 15 IMPACT 2002+ environmental midpoint categories [28] are used: Aquatic Acidification (AA), Aquatic Ecotoxicity (AE), Aquatic Eutrophication (AEU), Carcinogen (C), Global Warming (GW), Ionizing Radiation (IR), Land Occupation (LO), Mineral Extraction (ME), Non-Carcinogen (NC), Non-Renewable energy (NR), Ozone Layer Depletion (OLD), Respiratory Inorganic (RI), Respiratory Organic (RO), Terrestrial Acidification/Nitrification (TAN) and Terres-trial Ecotoxicity (TE).
The multi-objective problem has 18 objectives (Eq. (4)). The con-straints represent the reliability and maintenance aspects as well as requirements related to the available area considered by Weinstock and Appelbaum [29]. The model considers a horizontal field without ele-vation, with a fixed length L and a fixed width W. It comprises K rows of solar collectors with a horizontal distance D between rows. Each col-lector has a length LC, a height H, and is tilted at an angle β with respect
to the horizontal. Each collector is an array of PV modules arranged in Nr rows and Nc columns. Fig. 2 shows the schematic representation of
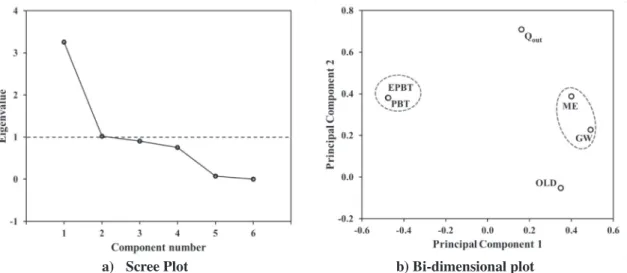
optimal front, PCA was applied to the Pareto optimal set of the original problem. The results of the 15 environmental categories were stan-dardized by subtracting the average of each column from each data point in the matrix so that PCA could work properly. Following the PCA guidelines described, the correlation matrix was generated (seeTable S4). FromTable S4, high correlation values between many of the ca-tegories can be observed. The princom function integrated into the Statics toolbox of MATLAB was used to generate the eigenvalues (see thefirst 10 of 15 eigenvalues inTable 1) and eigenvector matrix (see Table S5).
As it was mentioned above, PCA permits to explain the variance structure of a set of variables through a few linear combination (PC) of them in order to reduce the original data set and identify the relation that exists between the variables. Each PC corresponds to a percentage of the total variance among the variables and is ranked according to this percentage from the maximum to the minimum. InTable 1, PC1
re-presents the linear combination that explains the maximum variance (79.85%), while the last four PCs (PC7–PC10) contribute to less than
0.1%, i.e. thefirst six of 15 PCs represent almost 100% of the total variance among the data set. The next step is to define the number of PCs retained.
Applying the Kaiser-Guttman rule (λe> 1), only the first two
principal components (PC1, PC2) were kept for further analysis. A
threshold cut-off value (CUT) adopted by Deb and Saxena[42]was considered for the second reduction. As the cumulative variance of the two remaining principal components (0.9144) was lower than the de-fined CUT (0.95), PC1 and PC2 were finally selected. The first and
second columns in the eigenvector matrix give the weight used in the linear combination of the 15 environmental categories data in PC1and
PC2respectively. The values of the eigenvector of PC1and PC2could be
represented by a bi-dimensional plot in order to identify the relations between the 15 environmental categories.
Fig. 3a shows the corresponding screen plot while the bi-dimen-sional plot representing the component loadings of the environmental objectives projected onto the sub-spaces of the first two principal components is illustrated inFig. 3b. As observed, the two-dimensional plot and the correlation matrix (Table S4) suggests that NC, IO, AE, TE, TAN, AA, AEU, LO, GW, NR, RI categories have a high correlation. Si-milarly, a high correlation exists between the OLD-RO and ME-C cate-gories. The heuristic rules determine that only three environmental indicators (RI, OLD, ME) must be kept for further analysis. RI is replaced by GW (expressed in kg CO2equivalent). GW is, in fact, a significant
indicator when energy systems are involved. A very slight difference between the values of the eigenvector PC1for RI and GW supports our
decision.
Following the methodology proposed, a new set of optimizations was then carried out with only six objective functions: Qout– PBT –
EPBT– GW – OLD – ME. M-TOPSIS was applied to select the best trade-off among the alternatives generated. A weight of 1 was allocated to Qout, PBT and EPBT, and 1/3 to GW, ME and OLD.Table 2shows the
values of the six objectives function and thefinal ranking of the five PV module configurations.
Thefinal ranking identifies the CdTe-based PV module configura-tion as the best opconfigura-tion because it leads 3 of the 6 objectives under evaluation. It differs from the original ranking even though c-Si tech-nologies continue having the worst compromise. PCA is then applied once more to the six remaining objectives in order tofind a possible
PC1 PC2 PC3 PC4 PC5 PC6 PC7 PC8 PC9 PC10
Eigenvalue (λe) 11.978 1.746 0.678 0.320 0.169 0.097 0.013 0.000 0.000 0.000
Variability (%) 79.852 11.637 4.520 2.130 1.124 0.647 0.088 0.001 0.000 0.000
Cumulative % (Gj) 79.852 91.490 96.010 98.140 99.265 99.911 99.999 100.00 100.00 100.00
Principal Component Analysis (PCA) for Multi-Objective Optimization Sabio et al. [39] and Gutierrez et al. [40] have pointed out that some of the environmental midpoint categories considered for the en-vironmental assessment may be correlated. Another problem is the difficulty of visualizing the solution space because of the dimensionality of the problem. Thus, a multivariate statistical procedure will be useful and must be applied to reduce the objectives.
PCA constitutes an interesting alternative to identify the relation-ships that may exist between some objectives in order to eliminate re-dundant environmental impacts [40,41]. This action will facilitate the visualization and interpretation of the solution space. PCA allows identifying the correlated variables with a view to reducing the di-mensionality taking into as much variation of the data set as possible. The original variables are reduced into a smaller set of uncorrelated linear combination, known as principal components (PCs). PCs are ranked according to the amount of variance they explain. Following the guidelines proposed by Sabio et al. [39] and Deb and Saxena [42], the same set of heuristic rules will be used to reduce the dimensionality of the problem based on the eigenvectors of the correlation matrix. Results and discussion
The proposed methodology was applied to the following case study. A photovoltaic grid-connected power plant is considered to be installed near the city of Toulouse, France (43.4° N, 1.2° E). It is assumed that the DC /AC inverter has a nominal power of 300 kW DC with an efficiency of 97.5% and a lifetime of 10 years. A 20-year lifetime is assumed for PV modules and other electrical components. The dimensions and char-acteristics of the five PV modules used are those presented by Perez-Gallardo et al. [25] (see Table S1).
The available area was Wmax (150 m) × Lmax (100 m). The technical
constraints indicated in the mathematical formulation were fixed: the minimum distance between each shed was Dmin = 1.00 m; the
dimen-sions of the PV collectors had to respect Hmax = 3.00 m and
Emax = 4.00 m and the minimum number of sheds (K) was 2. No mix of
technologies was allowed. The percentage of loss caused by the array module wiring and mismatch was set at 5%. The panels are mounted on a fixed structure. Table S2 shows the characterization values to perform the environmental assessment for the elements considered.
According to the methodological framework of Fig. 1, a Multi-Ob-jective Optimization taking 18 obMulti-Ob-jectives into account was performed. Each optimization case was run three times to guarantee the stochastic nature of the algorithm with a population size of 200 individuals during 400 generations. The common parameters of the GA used were de-termined following the guidelines suggested by Gomez [32]: a cross-over rate of 90% and a mutation rate of 50%.
The selection of the best configuration of the PV grid-connected power plant involved a two-step application of the M-TOPSIS method: first, the best alternative in each of the five technologies was chosen (M-TOPSIS application 1); then, from these results, the best configuration was selected (M-TOPSIS application 2). The weight allocated to each objective under study was: 1 for Qout, PBT, and EPBT, and 1/15 for each
of the environmental categories.
The best trade-off was found when a-Si modules were used, while c-Si technologies gave the worst compromise (See Table S3).
In order to decrease dimensionality and complexity in terms of calculation as well as to facilitate the analysis of the resulting
Pareto-Table 1
influence of the other criteria to the final ranking and to continue re-ducing the complexity of the problem and the computational cost. The correlation matrix (Table S6), the eigenvalues (Table 3) and the ei-genvectors matrix (Table S5) were generated according to PCA guide-lines.
The results show that (EPBT– PBT) on the one hand and (ME – GW) on the other hand were correlated (seeFig. 4). This analysis led us to reject 2 objectives (EPBT and ME). A new multi-objective process was then conducted with only PBT, GW, OLD and Qout.Table 4shows the
values of the objectives corresponding to thefive configurations chosen by M-TOPSIS. The weighting for Qoutand PBT was equal to 1 and 0.5 for
GW and OLD. Thefinal ranking suggests that the best option is the a-Si-based configuration. By comparing the ranking of the five PV technol-ogies selected according to the three multi-objective cases treated in this work (Table 5), it can be observed, on the one hand, that both a-Si and CdTe PV modules achieve a better compromise regardless of the number of objectives under study. On the other hand, c-Si PV tech-nologies have the lowest rank in all the three cases. Even if the c-Si PV technologies are the most energy efficient options and have the lowest PBT, they are the least environmentally friendly.
It can be highlighted that thefinal ranking of the last case with 4 objectives is quite similar to thefirst case treated. The position between the c-Si technologies is the only difference. The main reason is probably the precision used to calculate the value of the M-TOPSIS score for establishing the final ranking. It can be concluded that only four ob-jectives (2 techno-economic: Qoutand PBT; and 2 environmental: GW
and OLD) are sufficient to size a PVGCS taking into account the 3 cri-teria simultaneously.
Recent advances in the efficiency conversion of the PV modules technologies, the commercialization of the next generation PV modules as well as the variation in the price of the components of a PVGCS may affect the ranking.
In order to assess in more detail the results obtained and to un-derstand why PV modules based on c-Si have the worst environmental impacts, the manufacturing processes for thefive PV technologies have
been studied. Figure FS1 (seesupporting information), describes the processflows for each PV technology under study. Three main steps can be identified: (1) production and preparation of raw materials, (2) solar cell/thinfilm manufacturing and (3) PV module assembly. First, GW ca-tegory has been considered since this impact is strongly linked to the supply of energy coming from fossil fuels. The energy mix used has a large influence on climate change.Fig. 5shows the contribution of each of the three steps to the total value of the GW category for each PV technology. Even though thefirst step (production and preparation of raw material) has the highest contribution in all PV technologies, the c-Si contribution is the most significant one.
Furthermore, for c-Si technology, the production and preparation of raw material step can be divided into two sub-steps. Thefirst sub-step involves the environmental impact related to the activities leading to solar-grade silicon (SoG-Si), while the second one considers the en-vironmental impact generated by the activities which produce the si-licon ingot and sisi-licon wafers. The results of this analysis are presented inFig. 6.
The highest contribution is found at silicon ingot/wafer production. Looking at the process followed to form the wafer, the high energy demand to achieve the formation of the ingot is the main cause. In the case of m-Si, the energy requirements are still greater due to high en-ergy consumption involved during CZ crystal growth to obtain a reg-ular, perfectly-ordered crystal structure.
It is important to mention that the decommissioning and recycling of PV modules were not taken into account since data on the environ-mental impacts associated with these end-of-life steps are relatively
a) Screen Plot
b) Bi-dimensional plot
Fig. 3. PCA for the 15 environmental categories.
Table 2
Values of the six objectives and PV technologies ranking after applying M-TOPSIS.
PV Techno Qout(MW h) PBT (year) EPBT (year) GW (kg CO2eq) OLD (CFC-11 eq) ME (MJ) Rank
m-Si 2,250.96 8.50 1.73 2,343,221 0.43 77,316.43 4 p-Si 1,615.37 10.34 1.90 1,983,472 0.41 69,675.70 5 a-Si 947.38 10.59 1.78 1,272,499 0.04 132,210.36 2 CdTe 1,384.24 10.49 1.31 1,429,545 0.06 48,175.48 1 CIS 1,524.48 9.29 1.72 1,778,691 0.08 124,433.07 3 Table 3
Eigenvalues for the 6 remaining objectives.
PC1 PC2 PC3 PC4 PC5 PC6
Eigenvalue (λe) 3.252 1.023 0.904 0.751 0.070 0.000
Variability (%) 54.203 17.046 15.063 12.520 1.168 0.000
scarce and are not yet included in the classical LCA database. We are aware, however, that the recycling process may also change thefinal classification because some PV module technologies contain hazardous
materials such as cadmium, tellurium, lead and selenium. For example, cadmium compounds are currently regulated in many countries be-cause of their toxicity tofish and wildlife. Cadmium has also been as-sociated with numerous human illnesses[43,44].
Conclusion
An ecodesign framework that considers simultaneously several technical, economic and life cycle environmental criteria was devel-oped and tested through a case study. Different optimization cases have been investigated to evaluate the developed approach for sizing PV systems. Redundant environmental objectives were identified and grouped through PCA on a post analysis keeping only four objectives (Qout, PBT, GW, and OLD). An MCDM tool based on M-TOPSIS allowed
to select the alternative that provides a better compromise among all the objective functions that have been investigated.
The results presented in this paper highlight the advantage of second-generation PV modules (thinfilm) over c-Si-based PV modules. While the latter have better performance in energy generation, the environmental aspect is what makes them fall to the last positions. The recycling process of PV modules constitutes an important issue that must affect the final ranking.
Even though the mathematical design model used has its own lim-itations and assumptions for PVGCS sizing problems, it is enough flexible to fit new conditions, for instance to size PVGCS mounted on
a) Scree Plot
b) Bi-dimensional plot
Fig. 4. PCA for the 6 remaining categories: Output energy (Qout), Investment Payback Time (PBT), Energy Payback Time (EPBT), Global Warming (GW), and Ozone Layer Depletion (OLD).
Table 4
Values of the six objectives and PV technologies ranking after applying M-TOPSIS.
PV Techno Qout(MW h) PBT (year) GW (kg CO2
eq) OLD (kg CFC-11 eq) Rank m-Si 2,323.27 8.46 2,420,954 0.44 4 p-Si 1,668.83 10.28 2,051,091 0.42 5 a-Si 945.45 10.59 1,271,289 0.04 1 CdTe 1,483.10 10.40 1,532,570 0.06 2 CIS 1,625.54 9.20 1,903,321 0.09 3 Table 5
Ranking position of the 5 PV modules technologies at the three cases.
PV Techno 18 objectives ranking 6 objectives ranking 4 objective ranking
m-Si 5 4 4
p-Si 4 5 5
a-Si 1 2 1
CdTe 2 1 2
CIS 3 3 3
Fig. 5. Contribution of the three main steps of PV manufacturing process to GW category score for each PV technology under study (1) production and pre-paration of raw materiasl, (2) solar cell/thinfilm manufacturing and (3) PV module assembly.
Fig. 6. Environmental contribution of the two sub-steps to production and pre-paration of raw material step for c-Si-based PV technology.
[1] EPIA. Solar photovoltaic on the road to large scale grid integration. Belgium; 2012. [2] Fthenakis VM, Kim HC, Alsema E. Emissions from photovoltaic life cycles. Environ
Sci Technol 2008;42:2168–74.
[3] de Wild-Scholten MJ, Alsema E. Towards cleaner Solar PV. Refocus 2004:46–9. [4] ISO/TR 14062. Environmental management, integrating environmental aspects into
product design and development. Geneva, Switzerland; 2002.
[5] Karlsson R, Luttropp C. EcoDesign: what’s happening? An overview of the subject area of EcoDesign and of the papers in this special issue. J Clean Prod 2006;14:1291–8.http://dx.doi.org/10.1016/j.jclepro.2005.11.010.
[6] Borchardt M, Wendt MH, Pereira GM, Sellitto MA. Redesign of a component based on ecodesign practices: environmental impact and cost reduction achievements. J Clean Prod 2011;19:49–57.http://dx.doi.org/10.1016/j.jclepro.2010.08.006. [7] Fargnoli M, Kimura F. Sustainable Design of Modern Industrial Products. Proc. LCE
2006 2006;14062:189–94. Leuven, Belgium.
[8] Sadler B, Verheem R. Strategic Environmental Assessment. Status, challenges and future directions. The Hague; 1996.
[9] Linkov I, Seager TP. Coupling multi-criteria decision analysis, life-cycle assessment, and risk assessment for emerging threats. Environ Sci Technol 2011;45:5068–74.
http://dx.doi.org/10.1021/es100959q.
[10] Cowell SJ, Fairman R, Lofstedt RE. Use of Risk Assessment and Life Cycle Assessment in Decision Making: A Common Policy Research Agenda. Risk Anal 2002;22:879–94.http://dx.doi.org/10.1111/1539-6924.00258.
[11] Heijungs R, Huppes G, Zamagni A, Masoni P. Life Cycle Assessment: Past, Present, and Future. Environ Sci Technol 2011;45:90–6.
[12] Finnveden G, Hauschild MZ, Ekvall T, Guinée J, Heijungs R, Hellweg S, et al. Recent developments in Life Cycle Assessment. J Environ Manage 2009;91:1–21.http://dx. doi.org/10.1016/j.jenvman.2009.06.018.
[13] Green MA, Emery K, Hishikawa Y, Warta W, Dunlop ED. Solar cell efficiency tables (version 43). Prog Photovoltaics Res Appl 2014;22:1–9.http://dx.doi.org/10.1002/ pip.2452.
[14] Fthenakis VM, Kim HC. Photovoltaics: Life-cycle analyses. Sol Energy 2011;85:1609–28.http://dx.doi.org/10.1016/j.solener.2009.10.002. [15] Peng J, Lu L, Yang H. Review on life cycle assessment of energy payback and
greenhouse gas emission of solar photovoltaic systems. Renew Sustain Energy Rev 2013;19:255–74.http://dx.doi.org/10.1016/j.rser.2012.11.035.
[16] Sherwani AF, Usmani JA. Life cycle assessment of solar PV based electricity gen-eration systems: A review. Renew Sustain Energy Rev 2010;14:540–4.http://dx. doi.org/10.1016/j.rser.2009.08.003.
[17] Notton G, Lazarov V, Stoyanov L. Optimal sizing of a grid-connected PV system for various PV module technologies and inclinations, inverter efficiency characteristics and locations. Renew Energy 2010;35:541–54.http://dx.doi.org/10.1016/j.renene. 2009.07.013.
[18] Kazem HA, Khatib T. Techno-economical assessment of grid connected photovoltaic power systems productivity in Sohar, Oman. Sustain Energy Technol Assess 2013;3:61–5.http://dx.doi.org/10.1016/j.seta.2013.06.002.
[19] Paudel AM, Sarper H. Economic analysis of a grid-connected commercial photo-voltaic system at Colorado State University-Pueblo. Energy 2013;52:289–96.
http://dx.doi.org/10.1016/j.energy.2013.01.052.
[20] Bakhshi R, Sadeh J, Mosaddegh H. Optimal economic designing of grid-connected photovoltaic systems with multiple inverters using linear and nonlinear module
models based on Genetic Algorithm. Renew Energy 2014;72:386–94.http://dx.doi. org/10.1016/j.renene.2014.07.035.
[21] Wissem Z, Gueorgui K, Hédi K. Modeling and technical–economic optimization of an autonomous photovoltaic system. Energy 2012;37:263–72.http://dx.doi.org/ 10.1016/j.energy.2011.11.036.
[22] Menoufi K, Chemisana D, Rosell JI. Life Cycle Assessment of a Building Integrated Concentrated Photovoltaic scheme. Appl Energy 2013;111:505–14.http://dx.doi. org/10.1016/j.apenergy.2013.05.037.
[23] Desideri U, Proietti S, Zepparelli F, Sdringola P, Bini S. Life Cycle Assessment of a ground-mounted 1778kWp photovoltaic plant and comparison with traditional energy production systems. Appl Energy 2012;97:930–43.http://dx.doi.org/10. 1016/j.apenergy.2012.01.055.
[24] Ito M, Komoto K, Kurokawa K. Life-cycle analyses of very-large scale PV systems using six types of PV modules. Curr Appl Phys 2010;10:S271–3.http://dx.doi.org/ 10.1016/j.cap.2009.11.028.
[25] Perez-Gallardo JR, Azzaro-Pantel C, Astier S, Domenech S, Aguilar-Lasserre A. Ecodesign of photovoltaic grid-connected systems. Renew Energy 2014;64:82–97.
http://dx.doi.org/10.1016/j.renene.2013.10.027.
[26] Fthenakis V, Frischknecht R, Raugei M, Kim HC, Alsema E, Held M, et al. Methodology guidelines on life cycle assessment of photovoltaic electricity; 2011. [27] Bhat IK, Prakash R. LCA of renewable energy for electricity generation systems—A review. Renew Sustain Energy Rev 2009;13:1067–73.http://dx.doi.org/10.1016/j. rser.2008.08.004.
[28] Jolliet O, Margni M, Charles R. IMPACT 2002+: A new life cycle impact assessment methodology. Int J LCA 2003;8:324–30.
[29] Weinstock D, Appelbaum J. Optimization of Solar Photovoltaic Fields. J Sol Energy Eng 2009;131:31003.http://dx.doi.org/10.1115/1.3142705.
[30] Coello Coello CA, Becerra RL. Evolutionary Multi-Objective Optimization in Materials Science and Engineering. Mater Manuf Process 2009;24:119–29. [31] Papandreou V, Shang Z. A multi-criteria optimisation approach for the design of
sustainable utility systems. Comput Chem Eng 2008;32:1589–602.http://dx.doi. org/10.1016/j.compchemeng.2007.08.006.
[32] Gomez A, Pibouleau L, Azzaro-Pantel C, Domenech S, Latgé C, Haubensack D. Multiobjective genetic algorithm strategies for electricity production from genera-tion IV nuclear technology. Energy Convers Manag 2010;51:859–71.http://dx.doi. org/10.1016/j.enconman.2009.11.022.
[33] Huang IB, Keisler J, Linkov I. Multi-criteria decision analysis in environmental sciences: ten years of applications and trends. Sci Total Environ 2011;409:3578–94.
http://dx.doi.org/10.1016/j.scitotenv.2011.06.022.
[34] Huang YP, Poh KL. B.W. A. Decision analysis in energy and environmental mod-eling. Energy 1995;20:843–55.
[35] Boix M, Montastruc L, Pibouleau L, Azzaro-Pantel C, Domenech S. A multiobjective optimization framework for multicontaminant industrial water network design. J Environ Manage 2011;92:1802–8.http://dx.doi.org/10.1016/j.jenvman.2011.02. 016.
[36] Morales Mendoza LF, Perez Escobedo JL, Azzaro-Pantel C, Pibouleau L, Domenech S, Aguilar-Lasserre A. Selecting the best portfolio alternative from a hybrid multi-objective GA-MCDM approach for New Product Development in the pharmaceutical industry. 2011 IEEE Symp. Comput. Intell. Multicriteria Decis., IEEE
2011;2011:159–66.http://dx.doi.org/10.1109/SMDCM.2011.5949271. [37] Ahmadi MH, Dehghani S, Mohammadi AH, Feidt M, Barranco-Jimenez MA.
Optimal design of a solar driven heat engine based on thermal and thermo-eco-nomic criteria. Energy Convers Manag 2013;75:635–42.http://dx.doi.org/10. 1016/j.enconman.2013.07.078.
[38] Ren L, Zhang Y, Wang Y, Sun Z. Comparative analysis of a NovelM-TOPSISMethod and TOPSIS. Appl Math Res eXpress 2007;2007.http://dx.doi.org/10.1093/amrx/ abm005. 10 pages.
[39] Sabio N, Kostin A, Guillén-Gosálbez G, Jiménez L. Holistic minimization of the life cycle environmental impact of hydrogen infrastructures using multi-objective op-timization and principal component analysis. Int J Hydrogen Energy
2012;37:5385–405.http://dx.doi.org/10.1016/j.ijhydene.2011.09.039. [40] Gutiérrez E, Lozano S, Adenso-Díaz B. Dimensionality Reduction and Visualization
of the Environmental Impacts of Domestic Appliances. J Ind Ecol 2010;14:878–89.
http://dx.doi.org/10.1111/j.1530-9290.2010.00291.x.
[41] Pozo C, Ruíz-Femenia R, Caballero J, Guillén-Gosálbez G, Jiménez L. On the use of Principal Component Analysis for reducing the number of environmental objectives in multi-objective optimization: Application to the design of chemical supply chains. Chem Eng Sci 2012;69:146–58.http://dx.doi.org/10.1016/j.ces.2011.10. 018.
[42] Deb K, Saxena DK. Onfinding pareto-optimal solutions through dimensionality reduction for certain large-dimensional multi-objective optimization problems emo for many objectives; 2005.
[43] Fthenakis VM. Life cycle impact analysis of cadmium in CdTe PV production. Renew Sustain Energy Rev 2004;8:303–34.http://dx.doi.org/10.1016/j.rser.2003. 12.001.
[44] Bernard A. Cadmium and its adverse effects on human health. Indian J Med Res
2008;128:557–64.
single or double tracking system.
The methodology developed in this work can be useful for PVGCS designers to find the optimal configuration among a list of commer-cially available system devices, in such a way that the total benefit achieved during the system operational lifetime period is maximized with the lowest environmental impact. Likewise, it is a decision support tool for implementing strategies of renewable energy generation that can be considered as truly green.
This framework integrating Multi-Objective Optimization, PCA and MCDM can be useful for applying ecodesign policies to other renewable energy generation technologies.
Appendix A. Supplementary data
More information relative to the features of PV modules considering the environmental assessment as well as the correlation and eigenvec-tors matrix (Tables S1−S7) can be found in Supporting information file Supplementary data associated with this article can be found, in the online version, at http://dx.doi.org/10.1016/j.seta.2018.03.008. References