OATAO is an open access repository that collects the work of Toulouse
researchers and makes it freely available over the web where possible
Any correspondence concerning this service should be sent
to the repository administrator:
tech-oatao@listes-diff.inp-toulouse.fr
This is an author’s version published in: http://oatao.univ-toulouse.fr/21
574
To cite this version:
Chan, Sitha
and Kanchanatawee, Sunthorn and Jantama, Sirima
Suvarnakuta and Jantama, Kaemwich and Joannis-Cassan, Claire
and
Tailland
ier, Patricia Using a combined oxygen-supply and
substrate-feeding strategy to improve 2,3-butanediol production by metabolically
engineered Klebsiella oxytoca KMS005. (2017) Journal of Chemical
Technology & Biotechnology, 93 (2). 600-608. ISSN 0268-2575
DOI 10.1002/jctb.5409
Using a combined oxygen-supply and
substrate-feeding strategy to improve
2,3-butanediol production by metabolically
engineered Klebsiella oxytoca KMS005
Sitha Chan,
a,b,c
Sunthorn Kanchanatawee,
a
Sirima Suvarnakuta Jantama,
c
Kaemwich Jantama,
a*
Claire Joannis-Cassan
b
and Patricia Taillandier
b*
Abstract
BACKGROUND: There is much demand for and extensive application for 2,3-butanediol (2,3-BD) in various fields, and micro-aerobic and substrate-feeding conditions greatly affect microbial growth and production. The theoretical maximum of 2,3-BD fermentative yield has rarely been reported. Therefore, our study aimed to develop an efficient combined oxygen-supply and substrate-feeding strategy to improve 2,3-BD production yield in metabolically engineered Klebsiella oxytoca KMS005. RESULTS: The optimized oxygen consumption for 2,3-BD production by strain KMS005 was demonstrated at 9.2 g for 1 L working volume corresponding to KLa of 25.2 h−1. During fed-batch, a glucose feeding rate of 2 g h−1 starting at the end of the growth
phase for 48 h followed by a final batch phase of 40 h was found likely to be satisfactory for 2,3-BD production by the strain KMS005. A final 2,3-BD concentration was obtained at 74.7 g L−1 with few by-products formation. A theoretical maximum of
2,3-BD production yield of 0.5 g g−1 substrate used was also approached.
CONCLUSION: Our oxygen-supply strategy with the specific feeding pattern developed in this study allowed the highest fermentative production yield of 2,3-BD ever reported. The KMS005 strain may be used as a biocatalyst for cost-effective 2,3-BD production from renewable substrates. In addition, the outcome might bring a message for further developments of simple fed-batch fermentation under micro-aeration conditions into larger scales for 2,3-BD production by K. oxytoca KMS005 or even other microorganisms.
Keywords: biocatalysis; aeration; fermentation; metabolic engineering
INTRODUCTION
Bio-based bulk chemicals have been intensively developed to replace fossil-based chemicals owing to gradually increas-ing prices of petrochemical feedstocks and their diminishincreas-ing availability.1 Many derivatives of 2,3-butanediol (2,3-BD) have
been recognized on the global market in the forms of methyl ethyl ketone (MEK), diacetyl, polyurethane-melamides, and others. Their applications include fuel, additives and flavoring agents for food and fragrances, pharmaceutical products, bio-plastics, and solvent productions.2 2,3-BD production via fermentation
from biomass is a good option to supply the increasing global market demand. Fermentative 2,3-BD production is required to meet high final concentrations and yields but to minimize residual sugars and by-products to limit the cost of downstream processes. Some key factors of 2,3-BD production via fermentation process, including microorganisms, inexpensive substrates and media, simple modes of operation, and low costs of separation and purifi-cation steps, need to be considered for the making of a profit on a commercialized scale.
2,3-BD can be produced by anaerobic and facultative aerobic microorganisms. Oxygen supply is the most important parameter
since the 2,3-BD pathway participates in the regulation of the NADH/NAD+ ratio to maintain the redox balance in the cells.
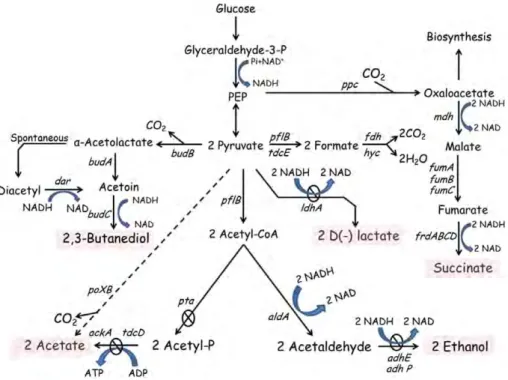
Under less than fully aerobic cultivation, lactate dehydrogenase, pyruvate-format lyase and 𝛼-acetolactate synthase enzymes act upon pyruvate (Fig. 1). 2,3-BD is generally produced under micro-aerobic conditions under slightly acidic pH.3Several 2,3-BD
production runs were performed to optimize the oxygen supply by various control strategies, including oxygen mass transfer coefficient (kLa), respiratory quotient (RQ), or oxygen uptake
∗ Correspondence to: K Jantama, School of Biotechnology, Suranaree University of Technology (SUT), Thailand. E-mail: kaemwich@sut.ac.th or P Taillandier, Laboratory of Chemical Engineering, Institute National Polytechnique (INP), Toulouse, France. E-mail: patricia.taillandier@ensiacet.fr
a Institute of Agricultural Technology, Suranaree University of Technology,
Nakhon Ratchasima, Thailand
b Laboratory of Chemical Engineering, Université de Toulouse, Toulouse, France
c Faculty of Pharmaceutical Sciences, Ubon Ratchathani University, Ubon
Figure 1. Fermentation pathways in K. oxytoca KMS005 under micro-aerobic conditions. Central metabolism indicating genes deleted in the engineered strain for 2,3-BD production. Solid arrows represent central fermentative pathways. Dashed arrow represents alternative acetate-producing pathway via pyruvate oxidase (poxB). Circled-crosses represent the gene deletions performed to obtain KMS005. Genes and enzymes: ldhA, lactate dehydrogenase;
pflB, pyruvate formate-lyase; pta, phosphate acetyltransferase; ackA, acetate kinase; tdcD, propionate kinase; tdcE, threonine decarboxylaseE; adhE, alcohol
dehydrogenase; aldA, acetaldehyde dehydrogenase; ppc, phosphoenol- pyruvate carboxylase; mdh, malate dehydrogenase; fumABC, fumaraseisozymes;
frdABCD, fumaratereductase; fdh, formate dehydrogenase; poxB, pyruvate oxidase; budA,𝛼-acetolactate decarboxylase; budB, 𝛼-acetolactate synthase; budC, butanediol dehydrogenase and dar, diacetylreductase (modified from Jantama et al.10).
rate (OUR). Fages et al.4attempted to use k
La to optimize 2,3-BD
production by Bacillus polymyxa. High (R,R)-2,3-BD concentration of 44 g L−1 was obtained with a productivity of 0.79 g L−1h−1
by varying the values of kLa during fermentation. A two-stage air
supply strategy by varying agitation speeds and aeration rates was also reported. For example, a two-stage agitation speed strategy was performed to supply different oxygen levels for optimizing cell growth and 2,3-BD production by Klebsiella oxytoca.5RQ was
also assigned to determine optimal oxygen supply. Zeng et al.6
employed an optimum RQ values ranging between 4 and 4.5 to obtain a high 2,3-BD concentration of around 96 g L−1. Zhang
et al.7also demonstrated 2,3-BD production at the concentration
of 140 g L−1by Serratia marcescens by switching RQ values from
1–1.5 to 1.8–2.0.
A fed-batch strategy was also superior compared with batch and continuous cultivations to obtain high concentrations of 2,3-BD. This improves the final product concentration thus avoiding the effect of substrate inhibition by the maintenance and supply of additional sugar at a relatively low level.8 A fed-batch strategy
providing a constant feeding rate is commonly considered as the simplest method, due to the lack of requirements for a com-puter coupled with a peristaltic pump, substrate sensors, and other sophisticated equipments for monitoring the fermentation condition. However, the feeding pattern to maintain a constant sugar residue concentration was likely to be preferential for 2,3-BD production by Klebsiella spp.9
The aim of this study was to improve the 2,3-BD production yield by a metabolically-engineered strain of K. oxytoca KMS005. In this work, the oxygen supply for efficient 2,3-BD batch production under micro-aerobic conditions was first optimized by varying kLa
values under conditions of either constant or two-stage aeration.
Then, several fed-batch conditions were carried out to investigate the optimized feeding strategy for maximizing 2,3-BD yield and concentration but minimizing substrate inhibition.
EXPERIMENTAL
MicroorganismA previously metabolically-engineered K. oxytoca KMS00510was
used throughout this study. The strain KMS005 was developed by deleting genes involved in NADH competing pathways, includ-ing adhE (alcohol dehydrogenase E), ackA/pta (acetate kinase A/phosphotransacetylase), and ldhA (lactate dehydrogenase A). Luria-Bertani (LB) agar composed (per liter) of 5 g yeast extract, 5 g NaCl, 10 g peptone, and 20 g agar was used to maintain the culture at 4 ∘C.
Culture method
For seed preparation, KMS005 was cultured on a Luria-Bertani (LB) agar. The plate was incubated at 37 ∘C for 24 h. A full single loop of the fresh seed was inoculated into 250 mL Erlenmeyer flasks containing 60 mL LB medium. The inoculum was incubated at 37 ∘C, 250 rpm for 16–18 h. A simple AM1 mineral salts medium (adapted from Martinez et al.11) in which KCl was excluded, was
used as the fermentation medium throughout this study. The optimized glucose concentration at the concentration of 90 g L−1
was estimated from our previous study in 2,3-BD production from maltodextrin.12
Batch fermentations
Fermentations were carried out in 2 L bioreactors (BIOFLO 110, New Brunswick Scientific, USA) containing 1 L of AM1 medium
supplemented with 14% (w/v) glucose in duplicate. The seed cul-ture was inoculated to the fermentation medium at the final OD550
of 0.1. The temperature was regulated at 37 ∘C. The pH of the medium fermentation was maintained after being dropped to 6.0 by the automatic addition of 3 mol L−1KOH. The inlet gas flow rate
was controlled at 0.8 or 1 vvm. Two Rushton turbines were agitated at speeds of 250 or 400 rpm. The bioreactor was equipped with an automatic gas analyzer (SERVOMEX 4100, UK) for on-line mea-surement of CO2and O2concentrations in the exit gas. Dissolved
oxygen (DO) was measured by DO probe (Mettler Toledo 6800, USA). Cell dry weight, and concentrations of glucose, 2,3-BD, suc-cinate, acetate, and ethanol samples were determined every 24 h. Batch operations (B) were performed to study effects of different oxygen levels supplied during both growth and stationary phases of 2,3-BD production. For one-stage oxygen supply (1), oxygen was provided at the same level throughout the fermentation time with either low (L: 400 rpm and 0.8 vvm; kLa: 25.2 h−1) or high (H:
400 rpm and 1.0 vvm; kLa: 36.1 h−1) aeration. The conditions were
designated as B1L and B1H, for batch-one stage oxygen supply under low and high aeration, respectively. For two-stage oxygen supply (2), levels of oxygen were provided at the same level as conditions of one-stage oxygen (low or high) supply during the growth phase. After that, levels of oxygen provided were switched to lower values for both low aeration (L: 250 rpm and 0.8 vvm; kLa:
19.6 h−1) and high aeration (H: 400 rpm and 0.8 vvm; k
La: 25.2 h−1)
during the stationary phase. The conditions were designated as B2L and B2H, for batch-two stage oxygen supply under low and high aeration, respectively.
Fed-batch fermentations
At first, the fed-batch (FB) fermentation was carried out in the same way as batch mode except for the initial sugar concentrations. Initial glucose concentrations (S) were varied among experiments (90, 120, or 140 g L−1). Then, the bioreactor was fed with a glucose
stock solution (800 g L−1 of glucose in a diluted AM1 medium
(1:4)) at constant flow rates depending on the targeted glucose concentration in the medium. The starting and duration of the feeding phase were varied among experiments. The feeding rate was initially estimated based on the optimum sugar consumption rate obtained from the batch condition, and was varied at rates of 1.25, 2.0, or 2.5 mL h−1. The feeding rate at 2 g glucose h−1was
equivalent to 2.5 mL h−1in this study. Each fed-batch condition
with different initial sugars and feeding patterns is indicated in Table 2.
Analytical methods
Cell dry weight
The optical density (OD) at 550 nm of a 1 mL sample was measured by a spectrophotometer Spekol®1500. Cell mass was estimated from a linear equation derived from a plot of OD versus cell dry weight (CDW).
Glucose, 2,3-BD, acetate, succinate, and ethanol concentrations The fermentative culture broth was centrifuged at 13 500 rpm for 4 min to separate cells and supernatant. The supernatant was filtrated through a 0.2 μm filter membrane. Twenty-five micro-liters of injection volume were automatically analyzed by HPLC (Thermo Scientific, France) equipped with a column, Rezex ROA organic acid H+(8%), 250×4.6 mm phase–reverse column (Phenomenex,
France) thermostated at 30 ∘C, and associated with a Refractive Index detector in series with a UV detector. The elution with an
aqueous solution of 10 mmol L−1H
2SO4was performed at 170 μL
per min.
Determination of volumetric oxygen mass transfer coefficient (kL.a)
The kLa values were estimated by a dynamic gassing-out method13
by monitoring an increase in DO concentration in AM1 medium containing 14% (w v−1) glucose monohydrate without inoculation
at the working volume of 1 L in the bioreactor. Different gas flow rates (between 0.8 and 1 vvm) and stirring speeds (between 250 and 400 rpm) were used as parameters for determining kLa values.
Calculation of respiratory quotient
The gas balancing method was used to calculate OUR (oxygen uptake rate) and CPR (CO2production rate) by an assumption of
well-mixed bioreactor under steady-state conditions.14
Concentra-tions of O2and CO2in the inlet gas were approximately constant
and considered equal to 21% and 0%, respectively. The respiratory quotient (RQ) was then calculated as:
RQ = CPR∕OUR(mol mol−1)
Calculation of total O2consumed during batch fermentation
Mass balance for the DO can be written as:
dCL∕dt = kLa ( C∗ L–CL ) –OUR
where CLis the concentration of DO in the liquid phase and CL* is
the concentration at which the DO was saturated (CL* = 8×10⁻³g
L−1). Since C
Lis constant and close to zero after approximately 8 h
of fermentation, it can be written as: kLa ( C∗ L ) = OUR
O2consumed (g) = kLa.C∗L.t.V for 8 < t < 52 h
where V is the volume of the liquid phase and t is the duration of the oxygen limitation phase. For the first 8 h incubation, the oxygen consumed was calculated by integration. Therefore, the total amount of consumed oxygen could be estimated.
Carbon balances
Quantities (Q in gram unit) of glucose consumed and fermentative products produced (2,3-BD, acetate, succinate, ethanol, CO2,and
biomass) were calculated during fermentation. For biomass, the calculation was based on the average formula of K. oxytaca equiv-alent to CH1.73O0.43N0.24.15The percentage of carbon recovery was
calculated as: %C recovery = Σ[ni ( Qi∕Mi )] ∕[6 (Qglucose∕Mglucose )] where index i refers to fermentative products, niis equal to the
number of carbon mole by mole of compound i, Qiis the mass of
compound i produced during fermentation, and Miis the
molecu-lar weight of compound i. Qglucose(g) is the glucose consumed
dur-ing fermentation and Mglucoseis the molecular weight of glucose.
Statistical analysis
The mean values and the standard errors were expressed from the data obtained with duplicate experiments. Differences between the sample means were analyzed by Duncan’s Multiple Range tests at𝛼 = 0.05, and 95% (P < 0.05) significance level by SPSS software version 17.0.
Table 1. Comparison of the performance of batch fermentation for 2,3-BD production by the strain KMS005 from initial glucose concentration of
140 g L−1with different aeration strategies
One-stage aeration Two-stage aeration
B1L B1H B2L B2H
Phases (Low aeration) (High aeration) (Low aeration) (High aeration)
kLa (h−1) [rpm, vvm] (min−1) Growth 25.2 36.1 25.2 36.1 (0–24 h) [400, 0.8] [400, 1.0] [400, 0.8] [400, 1.0] Stationary 25.2 36.1 19.6 25.2 (24–52 h) [400, 0.8] [400, 1.0] [250, 0.8] [400, 0.8] Max CDWa(g L−1) 4.9 ± 0.1e,μ 4.6 ± 0.2μ 5.1 ± 0.4μ 5.0 ± 0.4μ 2,3-BD (g L−1) 49.4 ± 3.0μ 45.1 ± 2.0𝛼 44.8 ± 5.5𝛼 50.2 ± 0.1μ Yieldb(g g−1) 0.37 ± 0.01μ 0.37 ± 0.01μ 0.36 ± 0.01μ 0.37 ± 0.01μ Av. Prodc(g L−1h−1) 0.95 ± 0.06μ 0.86 ± 0.04 0.78 ± 0.10𝛼 0.96 ± 0.01μ %Sugar consumed 93 85 87 97 %Carbon balance 96 93 99 95 By-productsd(g L−1) Succinic acid 0.4 ± 0.0μ 0.4 ± 0.0μ 6.1 ± 0.1𝛼 0.3 ± 0.1μ
Ethanol 0.1 ± 0.1μ 0.1 ± 0.0μ Not detected 0.1 ± 0.1μ
Acetic acid 1.8 ± 0.6μ 2.8 ± 0.1𝛼 1.9 ± 0.0μ 2.8 ± 0.1𝛼
aCell dry weight (CDW) was determined at the end of growth phase.
bYield was calculated as grams of 2,3-BD produced divided by grams of glucose consumed.
cAverage productivity was calculated at 52 h incubation.
dNo lactate was found in all tested conditions.
eAll data represent the averages of two fermentations with standard errors. Values bearing different Greek symbols were significantly different
between columns (P< 0.05).
RESULTS AND DISCUSSION
Effect of oxygen supply strategy in batch fermentation
Oxygen transfer rate (OTR) is considered the most important oper-ating parameter for 2,3-BD production. High levels of OTR usu-ally result in high growth of cells leading to an increase in 2,3-BD productivities. In contrast, even though the limitation in oxygen increases 2,3-BD yield, a decrease in overall production rate of 2,3-BD is observed due to a lower cell density. In addition, at an extremely low oxygen level, equal molar amounts of 2,3-BD and ethanol are regularly formed by natural 2,3-BD producers.16Hence,
conditions providing high 2,3-BD concentration and productiv-ity do not guarantee the high production yield of 2,3-BD. With these considerations, several oxygen supply strategies were ini-tially screened in batch fermentations to obtain an optimized oxy-gen level suitable for efficient 2,3-BD production. Table 1 shows the kLa values at different aeration and stirring rates. Values of kLa
of 36.1, 25.2, and 19.6 h−1were observed at stirring and aeration
conditions of 400 rpm with 1.0 vvm, 400 rpm with 0.8 vvm, and 250 rpm with 0.8 vvm, respectively.
In one-step aeration experiments, low (B1L) and high (B1H) OTR conditions were applied (Table 1). For both conditions, the growth phase of the strain occurred at 24 h (Fig. 2(a), (b)). At the begin-ning, oxygen transfer was not a limiting parameter since DO values did not reach zero. In addition, the specific growth rate reached maximum (data not shown). After 8 h incubation, oxygen transfer became limiting and the rate became linear. Meanwhile, 2,3-BD production started (likely growth-associated production). During the stationary phase (from 24 to 52 h), 2,3-BD production did not follow the growth-associated pattern. The 2,3-BD productivity dur-ing the growth phase (1.3 g L−1h−1for both B1L and B1H) was
also higher than those observed during the stationary phase (1.0 g L−1h−1for B1L and 0.9 g L−1h−1for B1H). No significant difference
was observed in the maximum CDW but there was significance
in the final 2,3-BD concentration and the 2,3-BD productivity between B1L and B1H conditions (Table 1). The significantly lower productivity observed during the stationary phase for B1H may be explained by the accumulation of more by-products and lower consumption of sugar. In addition, high percentages of carbon bal-ance (93–99%) obtained for each tested condition revealed that the carbon distribution through the 2,3-BD production pathway of KMS005 strain was nearly conserved in which all consumed glucose was almost totally dedicated to the combined concen-trations of 2,3-BD, cell biomass, by-products and carbon dioxide (Table 1). RQ profiles were similar for both conditions (B1L and B1H). They reached a maximum value during the growth phase then started to decrease when oxygen started to deplete. Notice-ably, the RQ value of the B1H condition was constant (around 3.5) until the end of the growth phase. In contrast, lower RQ val-ues during the stationary phase were in the range of 1–2. It was more likely that 2,3-BD was produced during both growth and non-growth phases regardless of RQ values. However, higher RQ values during the growth phase caused higher 2,3-BD produc-tion rate compared with that of lower RQ values observed in the stationary phase.
In two-step aeration experiments, decreased OTR conditions during the stationary phase were applied. These were B2L with lower aeration and B2H with higher aeration (Table 1). The B2L condition resulted in decreased 2,3-BD concentration compared with the one-stage lower aeration (B1L). However, the B2H con-dition significantly improved 2,3-BD production and productivity compared with observations under B2L and B1H conditions. No significant differences in the 2,3-BD production yield were observed for all conditions except for B2L where the yield was lower. Results confirmed that oxygen supply during two-stage experiments may be suitable for mixed growth-associated 2,3-BD production. The accumulation of by-products significantly
0 20 40 60 80 100 120 140 160 0 1 2 3 4 5 6 (a) Batch-1stage-Lowk La Time (h) Cel l bi om a s s ( g L -1 ) and RQ 2, 3 -B D , S ugar ( g L -1); a n d D iss ol v e d oxy g en ( % ) 0 20 40 60 80 100 120 140 160 0 1 2 3 4 5 6 (b) Batch-1stage-Highk La 0 4 8 12 16 20 24 28 32 36 40 44 48 52 Time (h) C e ll bi om a ss ( g L -1 ) and R Q 2 ,3 -B D , S u g a r (g L -1 ); a n d Di s s ol v e d ox y ge n ( % ) 0 20 40 60 12 16 20 24 28 32 36 40 44 48 52 80 100 120 140 160 0 1 2 3 4 5 6 (c) Time (h) Batch-2stages-LowkLa C el l bi om as s ( g L -1 ) an d R Q 2 ,3 -BD, S u g a r ( g L -1); a n d D iss ol v e d ox y ge n ( % ) 0 20 40 60 0 4 8 12 16 20 24 28 32 36 40 44 48 52 0 4 8 12 16 20 24 28 32 36 40 44 48 52 0 4 8 80 100 120 140 160 0 1 2 3 4 5 6 (d) Time (h) Batch-2stages-HighkLa 2 ,3-B D , Su ga r ( g L -1); a n d D iss ol v e d oxy g en (% ) C e ll bi om a ss ( g L -1 ) an d R Q
Figure 2. Time course of 2,3 BD production by K. oxytoca KMS005 during batch fermentation with different aeration strategies: one-step aeration with (a) low aeration and (b) high aeration, and two-stage aeration with (c) low aeration and (d) high aeration. The symbols represent: 2,3-BD ( ), dissolved oxygen ( ), RQ ( ), cell biomass ( ), sugar consumed ( ). The vertical dashed line represents the change in aeration rate.
7.0 9.2 10.1 12.4 10 20 30 40 50 60 0 1 2 3 4 5 6 7 Ethanol
2,3-BD Succinic acid Acetic acid
Oxygen consumed during experiments (g)
B2L B1L B2H B1H a b b a 2 2 1 1 β θ β μ
*
*
*
2, 3-B D ( g L -1 ) S u c c in ic a c id , a c e tic a c id and et ha nol ( g L -1 )Figure 3. Effect of oxygen consumption on final concentrations of 2,3-BD, succinate, ethanol and acetate during batch fermentation (7.0 for B2L, 9.2 for B1L, 10.1 for B2H, and 12.4 for B1H). Bar graphs bearing different lower case letters, Greek symbols, numbers and asterisks were significantly
different between treatments (P< 0.05) for 2,3-BD, succinic acid, acetic acid
and ethanol, respectively.
increased during the B2L two-stage aeration experiment com-pared with those in the one-stage aerations.
Figure 3 shows variations in final concentrations of 2,3-BD and by-products (mainly acetate and succinate) depending on total O2 consumption by the strain KMS005 in batch fermentation.
According to these results, B1L appeared to be the best condi-tion among others due to minimizing formacondi-tion of by-products but maximizing 2,3-BD concentration. However, no significant
difference in 2,3-BD production yield (around 0.37 g g−1glucose
used) was observed among conditions. For the B1L condition, the OUR value was 6.3 mmol L−1h−1, which was equivalent to a total
oxygen consumption of 9.2 g. A kLa of 25.18 h−1 was obtained
under stirring and aeration of 400 rpm and 0.8 vvm, respectively. The condition obtained in this study was comparable with the findings of Ji et al.,5in which a k
La value of 26.7 h−1was obtained
under stirring and aeration of 300 rpm and 1.0 vvm, respectively. Our findings were also supported by previous reports of the effect of aeration strategy for improvement of 2,3-BD production.4,5,7As
shown in Table 1, B2H resulted in the highest 2,3-BD concentra-tion at 50.2 ± 0.1 g L−1, while low initial aeration conditions in B2L
significantly decreased 2,3-BD production to the lowest concen-tration of 44.8 ± 5.5 g L−1. Interestingly, the highest 2,3-BD
concen-tration was achieved when total transferred oxygen supplied was only in the range 9.2 to 10.1 g (Fig. 3). The RQ was able to reach the range from 3.5 to 4.5 at 12 h during the growth phase and between 1 and 2 during the stationary phase (Fig. 2(c), (d)). Our results were in an agreement with Zeng et al.6who reported that the optimum
2,3-BD production was observed at an RQ between 4.0 and 4.5. However, Zhang et al.7claimed that the RQ should be separately
controlled at 1.0–1.5 for cell growth and at 1.8 to 2.0 for 2,3-BD production by S. marcescens H30 based on the stoichiometric cal-culation of sucrose metabolism under anaerobic or micro-aerobic conditions. The different RQ values found in our study and the work of Zhang et al.7 may result from the strains used. In
addi-tion, Zhang et al.7performed 2,3-BD production from sucrose in
a complex medium supplemented with peptone and yeast extract while our study employed K. oxytoca KMS005 to utilize glucose to
2,3-BD in a simple mineral salts medium without supplementation of complex and rich nutrients. Metabolic responses among strains to different supplemented nutrients might result in different RQ values during 2,3-BD production.
Our finding may imply that the strain KMS005 preferred an oxygen supply at the optimal level (kLa ≈ 25.2 h−1) to drive
the 2,3-BD production pathway and to maintain proper regu-lation of NAD+/NADH ratio inside the cells. Proper regulation
was observed when minimized concentrations of by-products were obtained under appropriate micro-aerobic conditions. The 2,3-BD metabolism by the strain KMS005 become a partially growth-associated product similar to those reported by Wong et al.17 and Chan et al.12 In addition, 2,3-BD was produced at
different rates during growth and stationary phases. These obser-vations may be explained with an understanding of enzymatic pathways via mixed acid fermentation between wide type and metabolically engineered strain KMS005. Klebsiella strains are microorganisms growing and obtaining energy by respiration and fermentation. Under excessive oxygen supply, the only products from its metabolism are mostly CO2and biomass. However, under
anaerobic conditions, mixed organic acids and ethanol serve as major products. The strain KMS005 was metabolically engineered via deletions of genes encoding alcohol dehydrogenase (adhE), acetate kinase-phosphotrans acetylase (ackA/pta), and lactate dehydrogenase (ldhA) enzymes. Thus, there are few amounts of by-products such as lactic acid, acetic acid, and ethanol.10 Even
though the transferred oxygen amount was increased to over 9.2 g, increased acetate formations were observed in both B1H and B2H conditions. Syu16also reported that further increase in O
2
availability caused higher production of acetic acid. Furthermore, Jantama et al.10claimed that the production of acetic acid was still
detectable, even though acetate kinase-phosphotrans acetylase (ackA/pta) genes were successfully deleted in the strain KMS005. This result may postulate the activation of other acetate-producing pathways under micro-aerobic conditions instead. Abdel-Hamid et al.18 stated that pyruvate oxidase (POXB encoded by poxB)
was necessary for cell survival during the stationary phase under micro-aerobic conditions (Fig. 1). Therefore, this may imply that POXB compensated ACKA-PTA activities and high oxygen supply over 9.2 g stimulated this pathway for acetic acid production in the KMS005 strain.
Unlike acetate, succinate sharply increased when the oxygen amount consumed was lowered to 7.0 g in B2L (the lowest aera-tion and kLa). In contrast, the succinate level was constant at very
low concentration when the amount of total oxygen consump-tion increased from 9.2 to 12.4 g in the other three condiconsump-tions (B1L, B2H, and B1H). It suggested that low oxygen level in the B2L condi-tion was preferable to succinate produccondi-tion compared with other conditions, and thus might activate enzymes involving succinate production in the strain KMS005. It was likely that the more aer-ation increased, the more succinate decreased. Levanon et al.19,20
revealed that malate dehydrogenase (MDH) was usually respon-sible for succinate production from oxaloacetate by the reduc-tive branch of TCA cycle under anaerobic and micro-aerobic con-ditions in E. coli and other bacteria in the family of Enterobacte-riaceae including K. oxytoca. Then, lower succinate detection in the strain KMS005 might result from very low malate dehydro-genase (MDH) activity under high oxygen supply conditions. In addition, Guest et al.21suggested that putative fumarate-nitrate
reductase (FNR) proteins regulate transcription levels of functional genes in 2,3-BD-producing pathways (bud operon). The operon contains a cluster of genes encoding for𝛼-acetolactate synthase,
𝛼-acetolactate decarboxylase, and acetoin reductase. FNR also activated genes involved in succinate production anaerobically. In the absence or with low amounts of oxygen (lower than 7.0 g), FNR may down-regulate the expression of budABC genes resulting in the highest production of succinate. By increasing the consumed oxygen amount until micro-aeration (9.2 g), more oxygen stim-ulated𝛼-acetolactate synthase while FNR was down-regulated resulting in low expression for genes involved in succinate produc-tion. On the other hand, aerobic supply (more than 10.1 g oxygen) resulted in the succinate production pathway being less active. However, the conditions were more preferable for the activation of acetate-producing pathways while 2,3-BD production declined because of the inactivation of BudABC enzymes by high O2levels.
Effects of feeding pattern in fed-batch fermentation
A series of fed-batch experiments was carried out with the objec-tive to increase the final 2,3-BD concentration in comparison with B1L batch experiment by extending the stationary phase beyond 52 h. During all these experiments, aeration was constant (kLa = 25.2 h−1) while sugar feeding rates, feeding times, and initial
sugar concentrations were varied (Table 2).
The first experiment (FB-S140-2.5) was similar to batch B1L except that after 48 h, sugar started to be fed to the culture at a flow rate of 2 g h−1(2.5 mL h−1of stock solution of 800 g L−1of glucose).
This corresponded with the sugar consumption rate observed in batch B1L during the stationary phase. The production of 2,3-BD was similar to the B1L condition in the first 48 h (Fig. 4(a)). After sugar feeding, the 2,3-BD production rate was maintained at 0.8 g L−1h−1until 76 h while sugar and biomass concentrations were
constant. After 76 h, a decrease in 2,3-BD production rate (0.4 g L−1h−1) was observed. Simultaneously, sugar and DO
concentra-tions increased (data not shown). This indicated that the metabolic activity of cells decreased. Consequently, the global productivity of 2,3-BD was lower than that observed in the batch experiment even though the final concentration and yield were higher (Table 2).
In FB-S140-2.5b, sugar feeding began earlier (at 36 h) and the flow rate was decreased when sugar concentration in the medium increased (Table 2). This resulted in higher production of 2,3-BD during the first part of feeding (until 75 h) thus providing a higher final concentration (77 g L−1) compared with FB-S140-2.5.
How-ever, the global productivity was still lower because of decreasing metabolic activity of the cells after 75 h. By calculating the global production rate at time 75 h, when the final concentration was similar to that obtained in FB-S140-2.5 (65 g L−1), the
productiv-ity was 0.88 g L−1h−1. However, a 2,3-BD yield of 0.49 g g−1
glu-cose used, which is close to the theoretical maximum of 0.5 g g−1,
was obtained. Besides, residual sugar concentrations in these two fed-batches were very high (Table 2). This may cause a decrease in the efficacy of the down-stream process.
For FB-S140-1.25, sugar feeding rate (started at 36 h) was decreased to 1.25 mL h−1to avoid substrate accumulation in the
bioreactor. During 36 to 56 h incubation, 2,3-BD production rate was lower than that observed in FB-S140-2.5b (0.66 g L−1h−1for
FB-S140-1.25 and 0.9 g L−1h−1for FB-S140-2.5b). After 56 h, the
sugar concentration was constant at 20 g L−1(Fig. 4(a)) and the
2,3-BD production rate decreased to 0.25 g L−1h−1at 120 h.
Jan-tama et al.10found that butanediol dehydrogenase (BudC) activity
was up-regulated in the strain KMS005 in medium containing 100 g L−1 glucose compared with that in medium containing
50 g L−1glucose. This was due to inactivation of other enzymes
Table 2. Comparison of the performance of fed-batch fermentation for 2,3 BD production with different sugar feeding strategies. All experiments were performed in duplicate
FB-S140-2.5 FB-S140-2.5b FB-S140-1.25 FB-S90-2.5 FB-S120-2.5 Max CDW, g L−1(%g g−1)a 4.5 (3.1) 5.3 (3.4) 4.7 (3.0) 6.1 (3.5) 5.2 (3.5) Initial sugar (g L−1) 140 140 140 90 120 Glucose 2.5 2.5 (36–75 h) 1.25 2.5 2.5 Feeding rate (48–120 h) 2.0 (75–100 h) (36–120 h) (24–76 h)c (20–68 h)d (mL h−1) 1.25 (100–120 h) 2,3-BD g L−1, (%g g−1) 65.3 ± 2.1𝛽(45.0) 77.3 ± 1.2μ(49.0) 60.4 ± 0.9 (39.0) 66.6 ± 3.2𝛽(37.9) 74.7 ± 0.6𝛼(50.0) 2,3-BD Yield (g g−1) 0.45 ± 0.01 0.49 ± 0.00μ 0.39 ± 0.02𝛽 0.38 ± 0.01e,𝛽 0.50 ± 0.01μ Overall Prod (g L−1h−1) 0.56 ± 0.01μ 0.54 ± 0.02μ 0.51 ± 0.01 0.65 ± 0.01𝛽 0.64 ± 0.00𝛽 Residual sugar (g L−1) 67.3 ± 2.3𝛽 77.1 ± 3.6μ 17.8 ± 1.5𝛼 4.9 ± 0.1𝜋 32.4 ± 0.3¥ By-productb, g L−1(%g g−1) Succinate 0.4 ± 0.2μ(0.2) 0.2 ± 0.1𝛼(0.1) 0.3 ± 0.3μ(0.2) 0.1 ± 0.1𝛼(0.1) 0.5 ± 0.1μ(0.3) Ethanol 0.6 ± 0.0𝛼(0.4) 0.3 ± 0.0£(0.2) 0.7 ± 0.0𝛼(0.4) 0.1 ± 0.0μ(0.1) 0.2 ± 0.0𝜋(0.1) Acetate 2.6 ± 0.2𝜋(1.8) 2.2 ± 0.1𝛽(1.4) 2.3 ± 0.2𝛼(1.5) 3.8 ± 0.1μ(2.2) 4.3 ± 0.1 (2.9) % Carbon balance NA NA 116 90 105
aYields (%g g−1) were calculated as grams of 2,3-BD, cells or by-products produced divided by grams of glucose consumed.
bBy-products were ethanol, succinate, and acetate. No lactate was detected.
cFermentation time from 76–100 h without sugar feeding.
dFermentation time from 68–116 h without sugar feeding.
eAll data represented the averages of two fermentations with standard errors. Values bearing different Greek symbols were significantly different
between columns (P< 0.05).
and lactate dehydrogenase. This suggested that the 2,3-BD pro-duction rate may be increased at higher sugar concentrations. High yield and 2,3-BD concentration may be correlated with high residual sugar concentration in which the high glycolytic flux was triggered. Therefore, this might activate enzymes involving NAD+
regeneration to relieve constraints to prevent halting glucose consumption.
The two last experiments (FB-S90-2.5 and FB-S120-2.5) were performed with the aim to decrease residual sugars. Two strate-gies were proposed to vary different sugar concentrations during the feeding phase (about 20 g L−1 for FB-S90-2.5 and 50 g L−1
for FB-S120-2.5). Also, feeding phases were shortened (52 h for FB-S90-2.5 and 48 h for FB-S120-2.5) in which the feeding was started at the end of the growth phase. The fermentation was prolonged to ensure the complete utilization of substrate (Fig. 5). Maximum biomass at 6.05 g L−1 was obtained in FB-S90-2.5 g
L−1. This was the highest cell concentration among all fed-batch
experiments. During the feeding phase, 2,3-BD production rate was 1.0 g L−1h−1along with the residual glucose concentration of
50 g L−1(FB-S120-2.5). In FB-S90-2.5, the 2,3-BD production rate
was only 0.72 g L−1h−1while the sugar concentration was 20 g
L−1. Therefore, the production rate decreased to 0.69 g L−1h−1
for FB-S120-2.5 and 0.4 g L−1h−1 for FB-S90-2.5 during the last
batch phase (Fig. 5). For FB-S90-2.5, the sugar was almost totally consumed (< 5 g L−1) after 116 h whereas the residual sugar
concentration of 32 g L−1 was still found in FB-S120-2.5 (Fig. 5;
Table 2). Even though, 2,3-BD yield at FB-S120-2.5 approached the theoretical maximum of 0.5 g g−1substrate used; the carbon
balance was 105% for this experiment thus indicating a slight experimental error. The approaching of theoretical maximum may result from modification of the 2,3-BD metabolism in the modi-fied strain KMS005 thus changing to partially growth-associated production.17 A greater 2,3-BD production rate was observed
when the sugar concentration in the medium was maintained at 50 g L−1(1.0 g L−1h−1) rather than that at 20 g L−1(0.72 g L−1h−1).
Garge and Jain22 reported that the most commonly-used initial
sugar concentrations were in the range of 5 to 10%. Célinska et al.3also suggested that the range of sugars may be adjusted
depending on the type of substrates, inhibitory compounds, and types of media. Remarkably, slight increases in acetate and higher biomass concentrations were also detected in FB-S90 and FB-S120 conditions (Table 2). It can be observed in Fig. 4(b) that the RQ profiles are similar to the batch experiments, with higher values during the growth phase, except for experiment FB-S140.2.5b with the highest residual sugar concentration. This suggested that the feeding substrate in the exponential phase may affect the metabolic activity of cells. This could be supported by the work of Jantama et al.10They reported that more activations of pyruvate
oxidase (PoxB) in which CO2and acetyl-CoA are usually generated,
and acetolactate synthase (BudB) with butanediol dehydrogenase (BudC) activities in the strain KMS005 were found when a higher sugar concentration was supplied under micro-aerobic conditions during mid and late exponential phases.
Our 2,3-BD concentration was lower than, but 2,3-BD yield was superior to, those of other previous reports.23,24They were also
higher than some using K. oxytoca as producers.25,26Nevertheless,
all previous works in 2,3-BD production by Klebsiella species or other microorganisms were mostly conducted with rich media supplemented with EDTA, yeast extract and casamino acid. Media increased the fermentation cost and caused more steps in the purification process. Unlike the expensive complex nutrients, the simple mineral salts medium with less inorganic nitrogen sources and trace metals used in our study was expected to reduce some obstacles to product recovery.
CONCLUSION
Klebsiella oxytoca KMS005 was optimized to evaluate suitable fer-mentative parameters for 2,3-BD production under micro-aerobic cultivation. Optimum oxygen supply and sugar feeding profile improved the final concentration and yield of 2,3-BD. Employ-ing a constant kLa at 25.2 h−1 under a constant feeding rate
(a) 0 12 24 36 48 60 72 84 96 108 120 0 1 2 3 4 5 6 7 (b) Time (h) RQ 0 10 20 30 40 50 60 70 80 90 0 20 40 60 80 100 120 140 160 0 12 24 36 48 60 72 84 96 108 120 Time (h) 2,3-BD (g L -1) Sugar concentration (g L -1 )
Figure 4. Fermentation profile of (a) 2,3-BD and sugar concentrations, and (b) RQ during fed-batch fermentation with initial sugar
concentra-tion of 140 g L−1. The symbols represent (a): 2,3-BD for FB-S140-2.5 ( ),
FB-S140-2.5b ( ), and FB-S140-1.25 ( ); sugar consumption for FB-S140-2.5 ( ), FB-S140-2.5b ( ), and FB-S140-1.25 ( ); feeding time for FB-S140-1.25
and 2.5 b ( ); feeding times for FB-S140-2.5 ( ). The symbols
repre-sent (b): FB-S140-2.5 ( ), FB-S140-2.5b ( ), FB-S140-1.25 ( ), FB-S90-2.5 ( ), FB-S120-2.5 ( ). 0 10 20 30 40 50 60 70 80 0 20 40 60 80 100 120 140 160 0 12 24 36 48 60 72 84 96 108 120 Time (h) 2,3-BD (g L -1) Sugar concentration (g L -1 )
Figure 5. Fermentation profile of 2,3-BD and sugar concentrations during fed-batch fermentation with varied initial sugar concentration and feeding time. The symbols represent: 2,3-BD for FB-S90-2.5 ( ), and FB-S120-2.5 ( ); sugar consumption for FB-S90-2.5 ( ) and FB-S120-2.5 ( ); feeding period
for FB-S90-2.5 ( )., and FB-S120-2.5 ( ).
of 2 g h−1, fed-batch fermentation by starting the feeding at
the end of the growth phase (FB-S120-2.5) may enhance 2,3-BD production to reach 74.7 g L−1 with less residual sugar
con-centration. In addition, 2,3-BD yield approached the theoretical maximum of 0.5 g g−1 substrate consumed using this strategy.
The use of a simple medium and fed-batch mode in this study may also reduce the 2,3-BD production costs related to medium
preparation, process operation, and waste disposal. Therefore, this study may provide insights into development of fermentative con-ditions for producing other microbial products by engineered or non-engineered microorganisms under micro-aerobic conditions.
ACKNOWLEDGEMENTS
This work was partially supported by National Research Council of Thailand (NRCT) under contract number PK/2555-138, and the Franco-Thai joint project 2015-2016 awarded to Professor Patricia Taillandier (INP) and Professor Kaemwich Jantama (SUT). Thanks also to Bob Tremayne, Office of International Relations, Ubon Ratchathani University for assistance with English.
CONFLICTS OF INTEREST
The authors declare that there are no conflicts of interest.
REFERENCES
1 Hermann BG and Patel M, Today’s and tomorrow’s bio-based bulk chemicals from white biotechnology: a techno-economic analysis.
Appl Biochem Biotechnol 136:361–388 (2007).
2 Ji XJ, Huang H and Ouyang PK, Microbial 2,3-butanediol production: a state of the art review. Biotechnol Adv 29:351–364 (2011).
3 Célinska E and Grajek W, Biotechnological production of
2,3-butanediol: current state and prospects. Biotechnol Adv 27:715–725 (2009).
4 Fages J, Mulard D, Rouque JJ and Wilhelm JL, 2,3-butanediol pro-duction from jerusalem artichoke, Helianthus tuberosus, by
Bacil-lus polymyxa ATCC 12321 optimization of kLa profile. Appl Microbiol Biotechnol 25:197–202 (1986).
5 Ji XJ, Huang H, Du J, Zhu JG, Ren LJ, Hu N and Li S, Enhanced
2,3-butanediol production by Klebsiella oxytoca using a
two-stage agitation speed control strategy. Bioresource Technol 100:3410–3414 (2009).
6 Zeng AP, Byun TG, Posten C and Deckwer WD, Use of respiratory quotient as a control parameter for optimum oxygen supply and scale-up of 2,3-butanediol production under microaerobic condi-tions. Biotechnol Bioeng 44:1107–1114 (1994).
7 Zhang L, Yang Y, Sun J, Shen Y, Wei D, Zhu J and Chu J, Microbial production of 2,3-butanediol by a mutagenized strain of Serratia
marcescens H30. Bioresource Technol 10:1961–1967 (2010).
8 Ezeji TC, Qureshi N and Blaschek HP, Acetone-butanol-ethanol (ABE) production from concentrated substrate: reduction in substrate inhibition by fed-batch technique and product inhibition by gas stripping. Appl Microbiol Biotechnol 63:653–658 (2004).
9 Nie ZK, Ji XJ, Huang H, Du J, Li ZY, Qu L et al., An effective and simpli-fied fed-batch strategy for improved 2,3-butanediol production by
Klebsiella oxytoca. Appl Biochem Biotechnol 163:946–953 (2011).
10 Jantama K, Polyiam P, Khunnonkwao P, Chan S, Sangproo M, Khor K et al., Efficient reduction of the formation of by-products and improvement of production yield of 2,3-butanediol by a combined deletion of alcohol dehydrogenase, acetate kinase-phosphotransacetylase, and lactate dehydrogenase genes in metabolically engineered Klebsiella oxytoca in mineral salts medium. Met Eng 30:16–26 (2015).
11 Martinez A, Grabar TB, Shanmugam KT, Yomano LP, York SW and Ingram LO, Low salt medium for lactate and ethanol production by recombinant Escherichia coli B. Biotechnol Lett 29:397–404 (2007). 12 Chan S, Jantama SS, Kanchanatawee S and Jantama K, Process
opti-mization on micro-aeration supply for high production yield of 2,3-butanediol from maltodextrin by metabolically-engineered
Klebsiella oxytoca. PLoS One 11:e0161513 (2016).
13 Nielsen J and Villadsen J, Bioreaction Engineering Principles. Plenum Press, New York (1994).
14 Garcia-Ochoa F and Gomez E, Oxygen uptake rate in microbial process: an overview. Biochemical Engin J 49:289–307 (2010).
15 Bommarius AS and Riebel BR, Biocatalysis: Fundamentals and Applica-tions. Wiley-VCH (2004).
16 Syu MJ, Biological production of 2,3-butanediol. Appl Microbiol
17 Wong CL, Yen HW, Lin CL and Chang JS, Effects of pH and fermentation strategies on 2,3-butanediol production with an isolated Klebsiella sp. Zmd30 strain. Bioresource Technol 152:169–176 (2014). 18 Abdel-hamid A, Attwood MM and Guest JR, Pyruvate oxidase
con-tributes to the aerobic growth efficiency of Escherichia coli.
Micro-biology 147:1483–1498 (2001).
19 Levanon SS, San KY and Bennett GN, Effect of oxygen on the
Escherichia coli ArcA and FNR regulation systems and metabolic
responses. Biotechnol Bioeng 89:556–564 (2005a).
20 Levanon SS, San KY and Bennett GN, Effect of ArcA and FNR on the expression of genes related to the oxygen regulation and the glycolysis pathway in Escherichia coli under microaerobic growth conditions. Biotechnol Bioeng 92:147–159 (2005b).
21 Guest JR, Green J, Irvine AS and Spiro S, The FNR modulon and FNR regulated gene expression, in Regulation of Gene Expression in
Escherichia coli, ed by Lin ECC and Lynch AS. Chapman and Hall, New
York, pp. 317–342 (1996).
22 Garg S and Jain A, Fermentative production of 2,3-butanediol.
Biore-source Technol 51:103–109 (1995).
23 Ji XJ, Huang H, Zhu JG, Ren LJ, Nie ZK, Du J and Li S, Engineering
Klebsiella oxytoca for efficient 2, 3-butanediol production through
insertional inactivation of acetaldehyde dehydrogenase gene. Appl
Microbiol Biotechnol 85:1751–1758 (2010).
24 Cho S, Kim T, Woo HM, Lee J, Kim Y and Um Y, Enhanced 2,3-butanediol production by optimizing fermentation conditions and engineering
Klebsiella oxytoca M1 through overexpression of ccetoin reductase. PLoS One 10: (2015).
25 Han SH, Le JE, Park K and Park YC, Production of 2,3-butanediol by a low acid producing Klebsiella oxytoca NBRF4. New Biotechnol 30:166–172 (2013).
26 Jung SG, Jang JH, Kim AY, Lim MC, Kim B, Lee J and Kim YR, Removal of pathogenic factors from 2,3-butanediol producing Klebsiella species by inactivating virulence related wabG gene. Appl Microbiol