To link to this article: DOI:10.1016/j.ifacol.2016.11.031
URL : http://dx.doi.org/10.1016/j.ifacol.2016.11.031
This is an author-deposited version published in:
http://oatao.univ-toulouse.fr/
Eprints ID:
17674
To cite this version:
González-Prida, Vicente and Shambhu, Jayakumar and Guillen, Antonio
Jesus and Adams, Joel and Pérès, François and Kobbacy, Khairy An
approach to risk quantification based on pseudo-random failure rates.
(2016) IFAC-PapersOnLine, vol. 49 (n° 28). pp. 179-184. ISSN
2405-8963
O
pen
A
rchive
T
oulouse
A
rchive
O
uverte (
OATAO
)
OATAO is an open access repository that collects the work of Toulouse researchers and
makes it freely available over the web where possible.
Any correspondence concerning this service should be sent to the repository
administrator:
[email protected]
Reliab ility, Statistical Approaches; Asset and maintenance management; Maintenance Models and Engineering.
1. INTRODUCTION
System reliability is usually modelled by using the mean time to repair (MTTR) registered in historical databases. This parameter is connected to the failure rate providing informat ion related to the system probability to fail, F(t), or not to fail, R(t) = 1-F(t), which are the reliability, both within a period of time. Failure databases generally provide informat ion about the minimu m, mean, ma ximu m failure rates, as well as their standard deviation. These values depend mainly on the systems design and installation quality. Normally, the use of mean fa ilure rates gives an insight into the physical asset behaviour, under controlled environments. The common definition of risk (associated with failure ) is the probability that a failure will occur and the negative consequences of that failure. According to ISO 31000:2010, it is basically e xpressed as follows (i referred to event i):
(1) Where:
R is the risk,
Pfi is the probability of failure
Cfi is the consequences of the unwanted event
.
The objective of this study is to express risks in terms of maintenance costs (consequences) linked to parameter values given for the system reliab ility. In order to illustrate this goal,
an exa mp le is shown considering a Weibull distribution for modelling system reliab ility, and how considering different values for its failure rate (min ima l, mean, ma ximal and pseudo-random), it is possible to analyse appropriately the subsequent risk, achieving a greater sensitivity of risk assessment in order to obtain relevant information about the potential costs to maintain the system at a specific t ime. In order to simp lify the analysis, in this paper we consider an ite m fro m the Offshore Re liab ility Database (OREDA) with a specific fa ilu re mode. With the available data for failure rate and assuming specific costs for planned and unplanned maintenance, the result will a id in the decisions on preventive maintenance tasks. In other word, this methodology allows ma intenance managers to better follow their risk appetite. With that purpose, this paper will start with a brief review of general risk indicators for maintenance and a proposed methodology for risk assessment. Then, with the support of a simple e xa mp le, the study will approach the reliability uncertainty considering different alternatives for failure rate (with analytical and simu lated values). The obtained results are shown and discussed in the following sections, providing different points of view for the analysis. Finally, the paper concludes with a summary of the ma in findings fro m the research .
2. RISK MANA GEM ENT IN AM: RISK INDICATOR TO OPTIMIZE MAINT ENANCE PERIODS
Risk management is one of the main aspects in the AM approach. ISO 55002:2013 introduces how the organizations
V. González-Pri da*, J. Shambhu**, A. Guillen*, J. Adams***, F. Pérès****, K. Kobbacy *****
Abstrac t: The risk quantification is one of the most critical areas in asset management (AM). The
relevant informat ion fro m the traditional models can be shown in risk matrices that represent a static picture of the risk levels and are according to its frequency and its impact (consequences). These models are used in a wide spectrum of knowledge domains. In this paper, we describe a quantitative model using the reliability and failure probability (as frequency in our risk model), and the preventive and corrective costs (as consequences in our risk model). The cha llenge here will be the treatment of re liab ility based on failure rate values with different e random d istributions (norma l, triangular etc.) according to the available data. These possible values will enable the simulation of the behavior of the system in terms of reliability and, consequently, to use this information fo r ma king a risk based analysis. The traditional risk-cost-benefit models applied to maintenance usually provides an optimu m for the time to apply a preventive task. But in this case, a time window is obtained showing minimu m and maximu m thresholds for the best time to apply the preventive maintenance task, together with other interesting statistics useful for the imp rovement of co mp le x industrial asset manage ment.
should determine the actions needed for addressing risks for its AM System. While addressing risks, the organization should determine the risk assessment criteria within the asset manage ment decision ma king process. Given the contextual importance, of ma intenance management in Asset manage ment, it is interesting to present an exa mple of risk-based maintenance decision making. According to Kaplan and Garrick, 1981, risk consists of three components; (1) the scenario, (2) the probability of the scenario and (3) the consequences of the scenario. They also suggest that one has to take all hazards into account and risk picture should be accomplished by summing up all possible scenarios with their consequences for a certain activity. Particularly for the calculation of probability, we refer to the failure occurrence and the reliab ility of the equip ment, which depend directly on the parameters of life (MTT F) of its distribution function. The changes and evolution of life para meters impacts directly on the reliability and failure probability and, co nsequently, in the risk assumed for such a failure (Gonzale z-Prida et Al. 2014). The Risk Indicator (Ri) is applied in maintenance manage ment processes with the objective of preserving the asset operation, ma ximizing operational perfo rmance and economic profitability. All this is achieved by applying the best maintenance strategies, inspections, and inventory control, in order to minimize the risks generated by different failure modes within the operational context (Woodhouse, 1993). Risk is a term which is probabilistic in nature and is commonly e xp ressed in monetary units per time (e.g., EUR / year). In mathematica l terms, the risk can be calculated fro m the following equation (Parra and Lopez, 2002):
(2) Where:
xi: TTFi time to failure (hours, days, months, years, etc.)
F(xi): probability of failure (%)
Co: economic consequences of failure (in monetary units: Euros, etc.)
Therefore, this risk indicator integrates technical and economic factors, because, it combines failure probabilit ies (frequencies) with economic cons equences (costs).
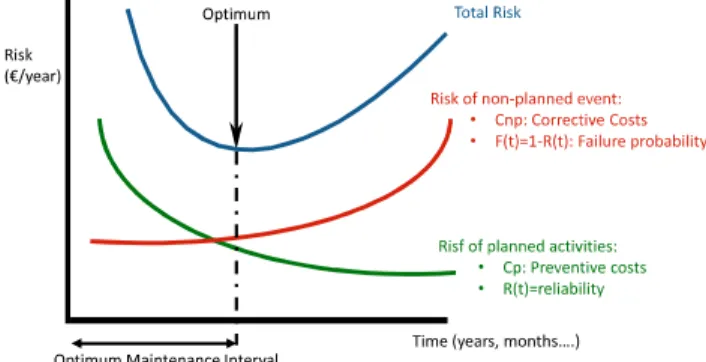
Fig. 1. Example of curves and the min imu m e xpected cost per unit time.
The risk indicator quantifies the influence of both magnitudes (figure 1): fa ilure p robability and consequence of the failure, useful for maintenance optimizat ion (Woodhouse, 1998). Risk indicator is useful to quantify the time for a preventive replacement at a lowest cost per unit of time (Campbell and Jardine, 2001) The mathematica l exp ressions for calculating the time period that generates the minimu m cost of a preventive maintenance replacement can be express ed as follows (Hastings, 2005):
(3) Where:
t: TTF time to fa ilure (hours, days, months, years, etc.)
Cnp: Corrective ma intenance costs (or non-planned costs). It includes materia l, labour, lost profits, safety, environment, etc.
F(t): probability of failure (%)
Cp: Preventive maintenance costs (or planned costs). It includes materials, labour, lost prof-its, safety, environment, etc.
R(t) = 1 F(t): Reliability (%).
3. M ODEL APPLICATION WITH ANA LITICA L VA LUES
estimator, using data from mult iple installations. Minimu m and ma ximu m values are a lso given with an uncertainty range of 90%. Considering this, assumptions are used in the calculations for different analysis in order to observe the system behaviour in reference to its reliability. In this case study, a Control and Safety Equip ment, among the Fire & Gas Detectors has been selected with the following values fro m OREDA : (i) Lower Failure Rate: 1,32 (fa ilu res per million hours); (ii) Mean Fa ilure Rate: 6,53 (fa ilu res per million hours); (iii) Upper Failure Rate: 15 (failures per million hours). The failure probability distribution for the example will be the Weibull d istribution:
(4)
(5)
This case assumes Weibull distribution and equations refer to an exponential case (beta = 1 in Weibull). The scale parameter (MTTF) will be calcu lated applying the analytical values for failure rates given by OREDA. On the other hand, as well as for Correct ive and Preventive maintenance costs (Cnp and Cp), specific values are given:
Cp = 5000 EUR Cnp = 367200 EUR
The risk will be calculated bimonthly, till the 45th month. (Assumed end time). Following sub-sections provide charts together with the results.
Applying the mean failure rates as provided by the OREDA database, the following results are obtained (Table 1):
Table 1: Results for risk with aver age failure rate
Fro m the table above, the min imal risk (899,57 EUR) with average failure rate occurs at the 21st month. That means that it is prefe rable to plan the replace ment maintenance task at this specific mo ment (figure 2). The graph shows that the risk curve reaches a min imu m, prior to increasing (very slowly in this case) indicating an increasing probability of failure. Th is behaviour may be considered by the decision -makers for scheduling the ma intenance activities.
Fig. 2. Results for risk with average failure rate
Applying the minima l and maxima l failure rates as provided by the OREDA database, the following results are obtained (Table 2 and 3).
Table 2: Results for with mini mal failure r ate
Fro m the table 2, the min ima l risk (208,09 EUR) with minimal failure rate occurs at the 45th month. That means that it is preferable to plan the replace ment maintenance task in the 45th month (figure 3).
Fig. 3: Results for with minima l failure rate
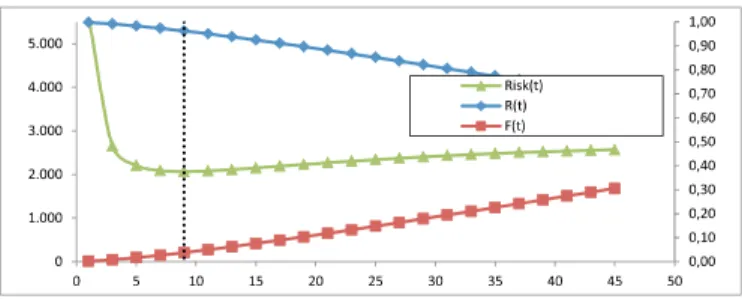
Similarly for ma ximal failure rate (Tab le 3), the minimal risk (2066,18 EUR) with minima l fa ilure rate occurs at the 9th month. That means that it is preferable to plan the replace ment ma intenance task in the 9th month (fig. 4).
Basically, the time period associated with the value of minimu m cost will be the period to imp le ment the replace ment activity (preventive maintenance at minimal cost).
Fig. 4: Results for with ma ximal fa ilure rate
A review of the three graphs provides a more accurate risk picture for the equipment maintenance. Now, more valu able considerations could be made than observing just one of the scenarios. For exa mple, in princip le, a time window for preventive maintenance can be set between 9 and 45 months. Refining this consideration, it could be argued that the period around month 20 would be an acceptable option, because: (i) On one hand, this is the min imu m risk with mean
the other hand, the risk calculated for month 20 with a higher significant (just about 1% over the minimu m risk at a h igher -window between 20-25 months by a similar reasoning so that the maintenance could be schedules within these months .
4. M ODEL APPLICATION WITH SIMULATED VA LUES
In the case of applying a pseudo-random failure rates, the analysis takes the data related to average failure rate and its standard deviation. With these two parameters, it is possible to calculate the inverse of a normal cu mulative distribution. In this exa mp le, a probability associated to the normal distribution has been applied as a random number between 0.5 and 0.95. Applying just these formulas are not enough, as the possibility to obtain values under the minimal fa ilure rates provided by OREDA. Therefore , the maximu m value between the min imal fa ilure rate provided by OREDA has been considered, and the result is obtained by the inverse of a normal accumu lative distribution. For the average failure rates and the standard deviation, the values provided by OREDA a re the fo llo wing ones: (i) Mean Fa ilu re Rate: 6,53 (fa ilures per million hours); (ii) Standard Deviation: 4,39 (fa ilures per million hours)
Considering the mean failure rate and the stan dard deviation, also provided by OREDA, it is possible to obtain a
pseudo-function of the cumulat ive normal distribution for the specified mean and standard deviation. In this function, the probability associated to the normal distribution is a random number b etween 5 and performing 50 simu lations, results are obtained and shown in the value histograms and distribution functions for both minimal risk and time for min imal risk. Tab le 4 provides the results obtained for 50 simu lations. In the Monte Carlo model, 50 simu lations are performed where values of average failure rates (± standard deviation) are taken randomly, obtaining different values for min ima l risk and for the time for min ima l risk. These results are more clearly illustrated by histograms (figures 5 and 6).
In the graphic below, x-axis shows possible values for minimal risk (M in: 208,09 EUR/year; Ma x: 1710,36 EUR/year).
Fig. 5: Histogram and Distribution Function for min. risk Y-a xis at the left shows number of simu lations. Thus, each red bar corresponds to the amount of simu lations (left -y-axis) that resulted to a specific value for min ima l risk (x-a xis). At the right, y-a xis shows the percentage of simulation results, which are over a specific value of minimal risk (x-axis). Th is is represented by the green line. Thus, for instance: (i) The 100 % of simu lations provides results upper than 208,09 EUR/year for preventive maintenance at minima l cost; (ii) The 0 % of simulations provides results upper than 1710,36 EUR/year for preventive ma intenance at minimal cost. Similarly, the results obtained after 50 Monte Carlo simu lations for time period to imple ment the replacement activity at a minimal cost (time for minimal risk), is clearly illustrated in the next h istogram (figure 6). In the graph above, x-axis shows the possible values for maintenance periods at a min imal cost (Min : 11 months; Max: 45 months). On the other hand, y-axis at the left shows number of simu lations. Thus, each red bar corresponds to the amount of simu lations (left-y-axis) that results to a specific va lue for ma intenance periods at a minimal cost (x-a xis). At the right, y-a xis shows the percentage of simulat ion results, which are over a specific value of min imal risk (x-a xis). This is represented by the green line.
Fig. 6: Histogram and Distribution Function for time for minimal risk (months)
Thus, for instance: (i) The 100 % of simu lations provides results higher than 11 months for periods of preventive ma intenance at minimal cost; (ii) the 0 % of simulations provides results higher than 45 months for periods of preventive ma intenance at min ima l cost.
5. RESULTS A ND DISCUSSIONS
The process of decision-ma king within the maintenance manage ment must preferably integrate technical indicators of reliability together with economic informat ion. In addition to this, the appropriate use of available data together with statistics and simu lation tools may provide mo re valid forecasts. For instance, in the presented examp le, the following results are obtained using just analytical values (Table 5):
Table 5: Results using analytical values
Nevertheless, the aim of this paper is to propose a procedure which helps to increase re levant informat ion wh ich is useful to take decisions according to the risk appetite of the company or the maintenance manager. Applying pseudo -random failure rates, relevant informat ion about the preventive maintenance at a minimal cost can be o btained as shown in table 6:
Table 6: Results using pseudo-random values
The use of histograms provides an interesting array of informat ion such as the occurrence probability of assuming a specific value for min ima l risk and time for that minimal risk (y-axis at the right in figures 5 and 6). In addition to this, the decision of when to apply a replacement activity can be taken being aware of the risk (in terms of cost). Co mparing it with the results from the analytical values, a risk underestimation can be observed by using ran
in the months of minima l risk (26.76 on average, compared to ding to data from d considering preventive tasks between months 27-30, which would be an advantage of 6-10 months against the schedule estimated by analytical values. This paper does not consider a model free simu lation to quantify the risk. The problem may be addressed, not just by sensitivity analyses and Monte Carlo simulations based on reliability databases but also when condition monitoring data can inform the estimation of reliability and remaining useful life . Although the methodology here is focused on single component/asset
ma intenance, a key challenge is planning maint enance at system level and addressing groups of components. As commented, the process of decision-making within the ma intenance manage ment must integrate technical indicators of reliability together with maintenance cost which include the consequences of failure events. This consideration will enable organizations to maximize the profitability of its assets at a level of optimal reliability and safety. Other interesting aspects to be taken into account by organizations when designing technical and economic indicators are depicted by Nachlas, 1995.
6. CONCLUSIONS
This paper suggests a methodology to better decide the scheduling of a replacement activ ity, considering a minimizat ion in maintenance costs for an assumed system. The proposed method provides to the reader an easy view about the effect over the system maintenance costs. The exerc ise considers values for failure rate. Frequently, failure rates are considered as a constant during the life cycle of the system in order to simplify calculat ions. Nevertheless, pseudo-random values may provide relevant information of the system without increasing the complexity of the analysis. The study presented the use of well-known simulat ion tools, whose results may substantially help the decision-making on aspects of the maintenance policies. Moreover, achieving a good level of ma intenance, especially in groups of critical assets, requires an appropriate analysis for the prioritization in the allocation of resources. Therefore, a method for convenient and practical risk comparison becomes an important tool for the success of the maintenance function and, in some cases, its complement methodologies for auditing the resources allocation of critica l maintenance activities. To conclude, this type of tool is also needed when the organization may change conditions modifying the values for R(t) and, consequently the n eed for a replace ment activity.
REFERENCES
Campbell, J and Jardine, A. (2001). . Eds. Marcel-Dekker, London.
Gon zalez-Prida, V. Viveros, P. Crespo, A. Martin C. (2014). Multi-Criteria Dec ision Tool applied to a System Relia-bility for the Priorization of Spare Parts.
R&RATA # 02 (33) (Vo l.9) 2014, June. ISSN 1932-2321
Hastings, N. (2005). RELCODE Soft ware Reliability and Replace ment Analysis Software .
, Inc. (www.oliver- group.com).
ISO 31000:2010. .
ISO 55002. 2013.
Kaplan, S., Garric k, B.J., (1981). On the quantitative defini-tion of risk. . 1, 11 27.
Nachlas, J. (1995). Fiabilidad. ISDEFE, , Madrid, España.
Parra, C. y López, R. (2002). Diseño de software de análisis de Confiabilidad, Disponibilidad y
Manteni-bilidad - INT-8790-2002,
PDVSA INTEVEP, Venezuela.
Woodhouse, J. (1993). . Chapman Hill Inc, London.
Woodhouse, J. (1998). Maintenance Strategy - the MACRO
view, . The