Any correspondence concerning this service should be sent
to the repository administrator:
[email protected]
This is an author’s version published in:
http://oatao.univ-toulouse.fr/27351
To cite this version: Padrón-Páez, Juan I. and Almaraz, Sofía
De-León and Román-Martínez, Alicia Sustainable wastewater
treatment plants design through multiobjective optimization.
(2020) Computers & Chemical Engineering, 140. 106850. ISSN
0098-1354
Official URL
DOI :
https://doi.org/10.1016/j.compchemeng.2020.106850
Open Archive Toulouse Archive Ouverte
OATAO is an open access repository that collects the work of Toulouse
researchers and makes it freely available over the web where possible
Sustainable wastewater treatment plants design through
multiobjective optimization
Juan I. Padrôn-Paez
a, Sofia De-Leôn Almaraz
b, Alicia Roman-Martinez
a,
*
• Universidad Aut6noma de San Luis Potosî, Facultad de Ciendas Qufmicas, Av. Dr. Manuel Nava No. 6, Zona Universitaria, 78210, San Luis Potosf, S.LP., Mexico
b Université de Toulouse, Labomtoire de Génie Chimique, U.M.R. 5503 CNRS/INP/UPS 4 allée Emile Monso, 31432, Toulouse Cedex 4, France
ABSTRACT
Keywords:
Wastewater treatment plants Socio-eco-efficient sustainability Multiobjective optimization Mixed-integer nonlinear programming problem
Modified technique for order of preference by similarity ta ideal solution
Nowadays, an adequate design of wastewater treatment plants taking into consideration ail sustainability dimensions- economic, environmental and social- is fundamental. This can be achieved by implementing systematic methodologies where conceptual and mathematical tools can be used together. This contribu tion proposes a framework that uses total cost, consumed energy, and reclaimed wastewater as sustain ability metrics. A mixed-integer nonlinear programming problem arises from a general superstructure for wastewater treatment plants. A case study from Mexico City is solved by a hybrid multiobjective opti mization approach that combines lexicographie and e-constraint methods. Solutions are provided in the form of a Pareto front. A modified technique for order of preference by similarity to ideal solution (M TOPSIS) analysis is used as a multiple criteria decision-making tool to find the best trade-off solution. The optimal sustainable configuration resulted consists of three levels of treatment and 100% of treated water reuse.
Multiple criteria decision making
1. Introduction
Wastewater is the polluted water generated by different ac tivities, namely, industrial and municipal. Wastewater treatment plants (WWTPs) allow removing contaminants in water to comply with water quality norms and regulations. The growing importance of respecting and disseminating environmental standards, as well as inefficiency of plants due to poor designs and practices, moti vate a necessity for systematic tools for WWTPs designs (Galan and Grassmann, 1998). The goal of wastewater management is to es tablish environmental protection measures, while economic and social concerns are considered (Metcalf and Eddy et al., 2014). One of the main questions to be answered before designing/installing a WWTP is related to the cost of the best technology that fulfills the environmental regulations of the discharged water, as well as to promote community development and public acceptance. The decision maker tries to find the best option at the lowest cost, but the selection of the most appropriate WWTP is not only an economic issue since other criteria such as environmental and so cial aspects must be considered in the decision process (
Molinos-' Corresponding author.
E-mail address: [email protected] (A. Român-Martînez).
https: / /doi.org/ 10.1016/j.compchemeng.2020.106850
Senante et al., 2014). The inclusion of a sustainability assessment covering its three dimensions ( economic, environmental, and so cial) can lead to a better wastewater management. Severa! proce dures have been proposed to design wastewater treatment plants or wastewater treatment networks, and most procedures are based upon the application of mies of thumb or heuristics.
In general, the used methods can be classified into two broad classes to get good designs of these systems: those based on con ceptual approaches, and those based on mathematical program ming (Bagajewicz, 2000). The methods included in the first group are approximate and cannot guarantee optimality. Conceptual De sign (CD) is a set of disciplines that contribute to the identification of the optimal design layout and nominal operating conditions of industrial processes (Barzaghi et al., 2016). For instance, the Pinch method is often used as a CD approach for water or heat exchange network problems.
Due to the inability of conceptual approaches to effectively pro vide rigorous solutions to complex problems, for example, mul tiple contaminant problems, mathematical programming has in creased since the 1980s, facing the challenges associated with the water/wastewater allocation planning (WAP1) or the WWTP de
sign. The WAP can be defined as follows: Given a set of water
].I. Padr6n-Paez, S.D.-L Almaraz and A. Roméin-Martfnez Nomenclature MINLP WWTP B0D5 TSS TN TP ds de ic
Mixed-integer nonlinear programming Wastewater treatment plant
Biochemical Oxygen Demand Total Suspended Solids Total Nitrogen Total Phosphorus Discharge stream
Services to the public with direct contact Services to the public with indirect or occasional contact Input stream o Output stream j Contaminant m Mixer s Splitter h Treatment units k Treatment levels r Purpose of reuse
osr Self-recycle stream in the output isr Self-recycle stream in the input irs Recirculate stream towards the input ors Recirculate stream from the output oby Bypass stream from the output iby Bypass stream towards the input
dj Disjunctions
A Rivers are the discharge receptor bodies B Coastal waters are the discharge receptor bodies C Natural water deposits for the protection of
aquatic life are the discharge receptor bodies
M Number of Mixers
S Number of splitters
TU Number of the treatment units
TL Number of the treatment levels
P-T Pre-treatment
PT Primary treatment
ST Secondary treatment
TT Tertiary treatment
pmaxj, h. k Maximum percentage of removal reported of
contaminant j for treatment h in the treatment Ievel k
Ei, h, k Removal efficiency coefficient of contaminant j
for the treatment unit h in the treatment level k ci, ds Concentration of contaminant j in the possible
discharge streams ds
ci, de Concentration of contaminant j in the possible reuse de
ci, ic Concentration of contaminant j in the possible
reuse ic
TC Total cost
RE Removal efficiency of pollutants
CE Consumed energy
WR Percent of reused water
cch, k(Fh. k) Function of the capital costs of treatment unit h
for treatment Ievel k
och. k(Fh, k) Function of the operating costs of treatment
unit h for treatment Ievel k
Fh, k Wastewater flowrate of treatment unit h at
Cj,in Cj, out 1'/j �
treatment Ievel k
Concentration of contaminant j in the input Concentration of contaminant j in the output Removal efficiency for contaminant j Weight associated for a specific pollutant j
f.OST k f.ÎTS k-1 Ysr, k Yrs. k c'J,m ci j,h,k CO j,h,k
Proportion of the amount of consumed energy by the treatment unit h in treatment Ievel k Flowrate of treated wastewater reused for the purpose r
Total wastewater flowrate to be treated Flowrate of the self-recycle stream in the input isr for the treatment level k
Flowrate of the self-recycle stream in the output osr for the treatment Ievel k
Flowrate of the recirculate stream towards the input irs for the stage k - 1
Flowrate of the recirculate stream from the out put ors for the stage k
Flowrate of the bypass stream from the output oby for the treatment Ievel k
Flowrate of the bypass stream towards the input iby for the treatment level k + 2
Binary variable used to choose treatment h for each treatment Ievel k
Binary variables utilized to select the type of reuse r
Binary variables utilized to select the type of re ceptor body ds
Binary variable used to restrict the existence of self-recycles streams
Binary variable used to restrict the existence of bypass stream
Binary variable utilized to restrict the existence of recirculate stream
Binary variables for disjunctions
Flowrate of the input stream i for the mixer unit m
Flowrate of the output stream o for the mixer unit m
Flowrate of the input stream i for the splitter unit s
Flowrate of the output stream o for the splitter unit s
Wastewater flowrate in the input stream i of treatment unit h at treatment Ievel k
Wastewater flowrate in the output stream o of treatment unit h at treatment level k
Flowrate in the treatment units and/or treated wastewater effluents for the disjunctions Concentration of the contaminant j in the input stream i for the mixer unit m
Concentration of the contaminant j in the out put stream o for the mixer unit m
Concentration of the contaminant j in the input stream i for the splitter unit s
Concentration of the contaminant j in the out put stream o for the splitter unit s
Concentration of contaminantj at the input i of treatment unit h for treatment Ievel k
Concentration of contaminant j at the output o of treatment unit h for treatment Ievel k
using units, a set of freshwater sources with corresponding con taminant concentrations, potential intermediate regeneration pro cesses and a wastewater treatment units, one wants to obtain a water / wastewater-reuse / regeneration network that optimizes a given objective or objectives with any discharged water meeting the environmental regulations of concentration for each pollutant
(Bagajewicz and Faria, 2009). This work focuses on the study of systems of wastewater treatment, although there is a very close relationship between the study of allocation systems for freshwa ter and wastewater.
Even though the conceptual design approach has shown limi tations, it is able to provide a simplified description of the prob lem, which can help to improve the formulation of the math ematical programming models. The mathematical approach has shown effectiveness in solving WAP problems, and the definition of the superstructure used can be very generic. Therefore, an ap proach that combines conceptual and mathematical programming approaches, seems to be a more effective alternative to face the challenges associated with the WAP or the WWTP design. In this regard, Statyukha et al. (2008) addressed the design of wastewa ter treatment network. The sequential strategy employed the wa ter pinch analysis (CD approach) to develop a superstructure, and in the mathematical programming stage, the cost of the treat ment process was minimized for the nonlinear programming (NLP) mode!. Also, Quaglia et al. (2014) proposed a framework for the design of wastewater treatment and reuse networks. The frame work considered engineering knowledge, problem analysis tools, and optimization methods within a computer-aided environment. Sueviriyapan et al. (2016) extended the aforementioned work, fo cusing on the systematic design of a water management system for retrofit wastewater treatment networks of an existing indus trial process, where the total annualized cost and the wastewater discharge rate were minimized. Besides, Castillo et al. (2016) pre sented an integrated framework for the optimal network selection of a WWTP configuration. The integrated methodology combines a knowledge-based technique and superstructure-based optimiza tion (minimizing the total annualized cost). According to the au thors, there is a mutual benefit and synergy achieved when both tools are integrated. Most of the works listed before cover the su perstructure definition gap by using a two-step methodology. How ever, it has been detected a need for an integrated approach that ensures the right implementation of problem formulation and data collection for the adequate creation of a superstructure that gath ers ail feasible alternatives for real applications.
Regardless the available approaches used for designing treat ment plants, the goal of sustainable development must be ad dressed, which is defined as "the development that meets the needs of the present generation without compromising the abil ity of future generations to meet their own needs" (WCED, 1987). Thus, the multidimensional nature of sustainability is fondamental and considers three dimensions. Nevertheless, some studies in the literature attempt to capture the sustainability requirements using a single indicator, e.g., through economic analysis (Balkema et al., 2002; Muga and Mihelcic, 2008). Most studies focus on the en vironmental and/or economic dimensions, ignoring the social as pects (Molinos-Senante et al., 2014). The multidimensional charac ter of sustainability makes the selection of sustainable wastewater treatment systems a multiobjective optimization problem. How ever, in previous works, the sustainable design of wastewater treat ment networks was not assessed completely, where the objective fonctions were related to the structure of the WWTP, its eco nomic dimension of sustainability and very few considered envi ronmental aspects such as energy consumption. To the best of our knowledge the social criterion has not been analyzed in multiob jective optimization approaches for WWTPs design. For instance, Rezaei et al. (2019) proposed a multiobjective optimization mode! for wastewater systems management, where the mathematical for mulation consisted of two objective fonctions. The first objective fonction minimized the costs and incorporates a term that consid ered as a social indicator the price or the value of resource recov ery. The second objective fonction minimized the greenhouse gas
emissions (as an environmental indicator) of the wastewater sys tem.
In that context, the aim of this work is to propose and validate a nove! integrated approach for designing sustainable WWTPs for a multipollutant problem by multiobjective optimization. The anal ysis of the dedicated literature shows that a robust approach that can take into account a systematic approach to ensure the right data treatment, problem definition and multiobjective optimiza tion by including the social aspect of sustainability is still miss ing, thus hampering the development of a generic approach. There fore, the objective of this paper is twofold: 1) to develop a sys tematic framework to improve the problem definition, data gather ing and superstructure definition of WWTPs (heuristic mies) and; 2) to propose a new multiobjective mathematical mode! that con siders the three dimensions of sustainability. Therefore, our frame work includes a combination of conceptual and mathematical pro gramming approaches and proposes a six-step sequential method ology, indicating in each step its corresponding methods and tools, emphasizing ail the substeps for an adequate mathematical pro graming mode! formulation and the integrated solution techniques (MINLP algorithms, lexicographie and s-constraint method), to ob tain a Pareto front solution, and, instead of allowing an informai or arbitrary WWTP selection from the Pareto front, the use of a multiple-criteria decision making (MCDM) method to find the best trade-off solution. This will be supported by a case study of a mu nicipal WWTP from México City used for agricultural irrigation in the Valley of Tula (Mezquital Valley).
The remainder of this paper is organized as follows: Section 2 is devoted to present the general framework for the multiobjective design of sustainable WWTPs, where its methodological steps and sub-steps are explained. Section 3 is dedicated to the application of the framework through a real case study, showing the results and their analysis. Finally, in Section 4 the conclusions are given.
2. General framework and methodology
The problem of optimal design of sustainable WWTPs can be defined as a grassroot design, i.e., the design of a new process from scratch. Therefore, the wastewater streams with their re spective contaminants, and different wastewater discharge efflu ents (or treated wastewater streams that can be reused) at a level of pollution established by environmental laws, are considered. From this information, the best design for a WWTP is obtained when it is evaluated with the sustainability criteria selected. The WWTP design includes the treatment technologies used, as well as the treated flowrates, the configuration of the process, and the flowrates of the streams of the treated wastewater for the different discharge types or reuse opportunities.
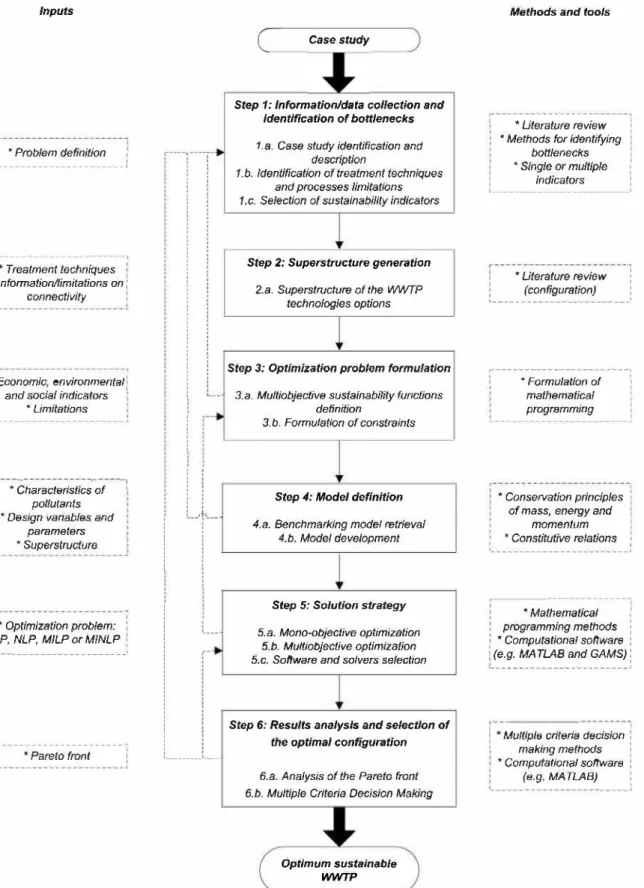
To solve the described WWTP design problem, the proposed framework is based on the generation, evaluation and selection of configurations and technologies (physical, chemical and/or biologi cal), using a superstructure (which includes ail process options), to identify the different stages of treatment, in terms of sustainabil ity metrics. In Fig. 1, the flowchart of the proposed framework is shown, which is an iterative process, where sometimes it is nec essary to return to one or more steps if a subsequent step cannot be completed. The integrated approach considers ruling out in ad vance those options that do not meet the different heuristic mies and restrictions, allowing a reduction of the search space before solving the optimization problem.
2.1. Step 1: Information/data collection and identification of bottlenecks
The aim of this step is to gather ail the required data about the system under study. To create a database, relevant information for
].I. Padr6n-Paez, S.D.-L Almaraz and A. Roméin-Martfnez Inputs * Problem definiüon '1 ---' 1-- ---- - ---: • Treatment techniques ; : • Information/limitations on ; l connectivity l 1 ' • Economie, environmental;
and social indicators
• Umitations
1- ,--, . r-. -,
1 *Characteristics of 1
pollutants
• Design variables and parameters • Superstructure r·-·---·-·--·-·-·-·----·--- -1 ' : • Optimization problem: : i LP, NLP, MILP or MINLP l 1 ---- - - ---- -� r---·-·----. , * Pareto front i L ···-·-·-·-·-·-- - - ----····---- -l
i
i i
i
ii
i1
' ' 1 ' ' ' 'i i
1 : 1 : 1 :i :
1 ' ' 1i :
1 i ; i 1 'i !
1 :i !
i
!
l !
i : : : : : i L__i
i i '!, i
i
L
_
.
1-__
:_
!
!
l
___
1r-i
i
' ' ,______
,__
C
Case studyStep 1: Information/data collection and identification of bottlenecks
1.a. Case study identification and description
1.b. ldentificaüon of treatment techniques and processes limitations
1.c. Selection of sustainability indicators
Step 2: Superstructure generation 2.a. Superstructure of the WWTP
technologies options
Step 3: Optimization problem formulation
3.a. Multiobjecüve sustainability functions
definition
3.b. Formulation of constraints
Step 4: Mode/ definition
4.a. Benchmarl<Îng mode/ retrieval 4.b. Mode/ development
Step 5: Solution strategy
5.a. Mono-objective optimization 5.b. Multiobjective optimization 5.c. Software and sa/vers se/action
Step 6: Results analysls and select/on of the optimal configuration 6.a. Analysis of the Pareto front 6.b. Multiple Criteria Decision Making
Optimum sustainable WWTP
Fig. 1. Flowchart of the framework of sustainable WWTPs design.
Methods and tools
,----·-·--·- - - -·-·-·-·-·-·-1
1 • Uterature review •Methods for identifying
bottlenecks i • Single or multiple i 1 ---lndicators --·---
__________
i
[r
·
-
-
-
-
-
-
-
·-·-·-·-· -· -·
---
--
-
-
-
-
-
-
-·-
-
-
·-· -· -· -· .
, • Uterature review : 1 ' : (configuration) : 1 --- _ _ _ _ ---·---_ _ _ __ -·-·- ____ 1 1--- -- --- ---- - ----, : • Formulation of ! mathematical programming . ' •Conservation principles of mass, energy andmomentum •Constitutive relations ' 1 f_ --___ -·-·-·-·-·---1 •Mathematical ' programming methods i • Computational software :
\ (e.g. MA TLAB and GAMS) :
1 1
·---� - --- ________ j
[-•-�ultiple criteria decision :
making methods !
• Computational software :
i _____
_ (e.g. MATLAB) _____ :the WWTP design must be investigated/collected, such as allowed types of treatment units, limits of contaminants, and wastewater discharge effluents.
wastewater characteristics, and treated wastewater effluents ( dis charge and reuse ).
2.1.1. Step 1.a. Case study identification and description
The necessary information to describe the system is: sources of wastewater (municipal and/or industrial), streams flowrates,
2.1.2. Step 1.b. Identification of treatment techniques and process limitations
Important factors that must be considered when evaluating and selecting a treatment technique are process applicability, influent
wastewater characteristics, reaction kinetics, treatment contami nants capability, operating parameters, maintenance requirements, chemical requirements, and complexity. On the other hand, meth ods for identifying bottlenecks are based on experiments, heuristic and/or simulations (Ben-Guang et al., 2000). In this methodology, a combined heuristic or knowledge-based approach and simulations are employed.
2.1.3. Step 1.c. Selection of sustainability indicators
It is important to determine the economic, environmental, and social factors that allow evaluating and selecting the best tech nologies for wastewater treatment. Therefore, a critical review of potential sustainability metrics is carried out. For the eco nomic aspect, most analysis encompasses financial costs and ben efits (Balkema et al., 2002; Muga and Mihelcic; 2008; Molinos Senante et al., 2014). Environmental dimension refers to the abil ity of the natural world to withstand the impact of human ac tivity (Popovic et al., 2013). Sorne of the most used ones are contaminants removal efficiency, energy consumption, and emis sions (Balkema et al., 2002; Muga and Mihelcic; 2008; Molinos Senante et al., 2014). According to Balkema et al. (2002), the pur pose of the social aspect is to secure people's socio-cultural and spiritual needs in an equitable way. This criterion can be assessed by quantitative and qualitative indicators. Sorne possible options include the percentage of wastewater reused and community size served (Popovic et al., 2014). The possible sustainability metrics arise by identifying the requirements of the system through the bottleneck analysis.
2.2. Step 2: Superstructure generation
In this step, the possible configurations arase from step 1, and their combinations among different equipment and their connec tion streams that may constitute the WWTP are generated. The centralized, decentralized schemes and several variations of these (e.g., distributed), which are the most commonly used configura tions (Bagajewicz, 2000) are considered.
2.2.1. Step 2.a. Superstructure of the WWTP technologies options
Generally, four stages can be distinguished: pre-treatment, pri mary treatment, secondary treatment, and tertiary treatment. His torically, pre-treatment and primary treatment levels have been linked to physical methods; the secondary treatment has been as sociated with chemical or biological techniques, and for tertiary treatment, it has been considered a combination of methods. The most appropriate techniques (for each stage) that potentially allow carry out the treatment process efficiently are selected from step 1.b. Table 1 shows comparisons among different treatment tech niques to aid in the options generation and in the identification of limitations.
2.3. Step 3: Optimization problem formulation
At this stage, the objective functions in terms of sustainable cri teria along with the constraints, are defined. The sustainable de sign of WWTP can be formulated as a multiobjective optimization problem and has the following general form:
Min [fi (x,y), h(x,y), ... , fk(x,y)]
g(x,y)
:s 0
h(x,y) = 0 XEX yEY(1) where x is a vector of m continuous variables, y is a vector of
n nonnegative integer variables (Y E z�0), h(x, y) are p equality
constraints, g(x, y) are q inequality constraints, and fi(i = 1, ... , k)
is a function where JRm x Z�
0 on JR, h(x, y) E JRP, g(x, y) E JRq and XE JRm (Collette and Siarry, 2003). The continuous variables define process variables (flowrates, the concentration of contaminants, etc.), and integer variables are used to mode! sequences of events, existence (or non-existence) of processing units and connectivity among techniques are represented by binary variables.
2.3.1. Step 3.a. Multiobjective sustainability functions de.finition
From the indicators of step 1.c., the functions that consider the most significant aspects of sustainability are formulated as math ematical functions. In the context of mathematical programming, cost functions are the most common. Regarding the environmental criteria, indicators can be formulated as an individual objective or as a sum of individual objectives; for example, through life cycle analysis (Padr6n-Paez et al., 2017). The majority of social metrics are of a qualitative nature, but the use of quantitative indicators fa cilitates the representation of an objective function associated with the social dimension. For simplicity, the criteria selection depends to a large extent on the availability of information.
2.3.2. Step 3.b. Formulation of constraints
In general, constraints are classified as equality and inequality ones. Different kinds of constraints are involved in this work: the process mode!, logical, structural, and operational constraints. The process mode! is a set of equality constraints that represent the mass and energy balance equations, which describe the behavior of the process. Logical constraints represent the selection of equip ment and the sequence of operations in the processing steps. The structural constraints define the connectivity between unit opera tions. Operational constraints are related to process operative spec ifications, such as the flowrate of treated wastewater. The process mode! is developed in step four of the framework. When it is not possible to determine the objective functions and restrictions or if there is not enough information about them, returning to step 1 must be considered.
2.4. Step 4: Madel de.finition
The goal of this step is to develop the mathematical mode! that represents the given case study, that is, the set of equations for the process units and their respective compounds involved.
2.4.1. Step 4.a. Benchmarking mode! retrieval
Constitutive models are related to the terms that require defi nition or calculation in the conservation equations of mass, energy, and momentum. Thus, it is possible to search in a library of models to select those that are suitable for the optimization problem.
2.4.2. Step 4.b. Madel development
The mode! equations can be developed through a modeling tool using a systematic procedure. One option is to apply the seven step modeling procedure proposed by Hangos and Cameron (2001 ). Another possibility is to follow standard relations, as in the models proposed for optimization purposes (Galan and Grassmann, 1998; Padr6n-Paez et al., 2017). In this step, it is possible to find out that there are neither suitable constitutive relations in the literature nor information about parameters values of the mode!. This situation could make us reconsider going back to step 1.
2.5. Step 5: Solution strategy
In this step, the suitable optimization strategy for mono objective and multiobjective frameworks is selected. Thus, relevant aspects of the optimization problem are analyzed, such as linear ity, convexity, and variable types. Once the methods to salve the
].I. Padr6n-Paez, S.D.-L Almaraz and A. Roméin-Martfnez Table 1
Comparative analysis of the advantages and disadvantages of some wastewater treatment techniques. Treatment Techniques
Screening
Primary sedimentation
Aerobic processes
Anaerobic processes
Processes with membranes
Capability to treat contaminants
' Biochemical Oxygen Demand (BODS)
• Suspended solids ( coarse solids)
• Biochemical Oxygen Demand (BODS) • Suspended solids • Heavy metals • Removal of organic compounds (BODS) • Removal of nutrients (nitrogen and phosphorus)
• Removal of organic compounds (BODS)
• Removal of organic (BODS) and inorganic compounds ( e.g. heavy metals)
• Removal of suspended solids and microorganisms ( e.g. bacteria)
Operating parameters and/or design variables
• Bar size (width and depth) • Clear spacing between bars • Slope from vertical • Approach velocity • Allowable head Joss • Detention time • Surface loading rates • Weir loading rate • Scour velocity
• Type, size and shape of the tanks
• Dissolved oxygen concentration • Process kinetics (rate expression)
• Kinetic parameters (reaction rate constant)
• Reactor volume • Residence time • Solids retention time and loading
• Mass transfer coefficient in aeration process (k,a)
• Temperature • Process kinetics (rate expression)
• Kinetic parameters (reaction rate constant)
• Reactor volume • Organic loading rate • Solids retention time ' Residence time • Temperature
• Pore size
• Operating pressure • Minimum particle size removed
• Membrane materials • Membrane configuration
Advantages
• Protects equipment from subsequent processes • Easy to operate • High wastewater flowrate can be treated
• Removal of large particles • Protects equipment from subsequent processes • Easy to operate
• Removal of dissolved pollutants
• Destruction process • Low maintenance required • Relatively easy to operate • Low capital costs • High wastewater flowrate can be treated
• Removal of dissolved pollutants
• Destruction process • Produces methane • Reduces the generation of waste sludge
' Removal of dissolved constituents • Meta! recovery ' Easy to operate ' It can be used to separate waste sludge
• Wastewater can be reused
Disadvantages
• Emissions of volatile compounds
• A lot of maintenance required (obstruction) • Low efficiency removal • Waste sludge is produced
• Emissions of volatile compounds
• Inadequate for light solids and stable emulsions • Waste sludge is produced • Chemical agents may be required
• Emission of volatile compounds
• Waste sludge is produced • Susceptible to changes in Joad and toxins
• Susceptible to climate changes
• High residence time
• Susceptible to changes in Joad and toxins
• Susceptible to climate changes
• Capital and operational costs relatively high
• Moderate removal efficiency (<85%)
• High residence time (greater than the aerobic process) • Removal efficiency varies with the membrane material used
• The retained solid in the membrane must be disposed • Chemical additives may be required ( e.g. coagulants) • Selective removal • Complicated maintenance • Membrane fouling
mono and multi-objective problems are defined, the available com putational software is analyzed for the implementation of the op timization strategies through the software library solvers.
step 5.a., a comparative analysis is done to select the most appro priate method that allows obtaining the non-dominated solutions.
2.5.1. Step 5.a. mono-objective optimization
Based on linearity (or nonlinearity) and the decision variables (continuous and/or integers) the optimal design of WWTP can be formulated as linear programming (LP), nonlinear programming (NLP), mixed-integer linear programming (MILP), or mixed-integer nonlinear programming (MINLP). A comparative analysis of the solution algorithms is carried out to choose the most appropri ate method depending on the optimization problem (Edgar et al., 2001).
2.5.2. Step 5.b. Multiobjective optimization
In these methods, the concept of optimality is changed by Pareto optimality. Thus, the solutions that cannot be improved in one objective fonction without deteriorating their perfor mance in at Ieast one of the others are non-dominated solutions (Collette and Siarry, 2003). The multiobjective optimization meth ods can be classified into three groups, a priori, a posteriori and hy brid methods (De-Le6n Almaraz, 2014). In an analogous manner to
2.5.3. Step 5.c. Software and solvers selection
To salve the optimization problem formulated in previous steps, the solution strategies that were chosen are implemented in ade quate computational software. GAMS is probably one of the most used computational software to salve mathematical programming models, but there are other alternatives, such as the MATLAB® op timization toolbox. The decision guidelines about the use of com putational software, among other factors, are based on the avail ability of the computational software itself and the user's knowl edge. If it is not possible to obtain feasible solutions of the opti mization problem or the set of optimal solutions is not satisfac tory, it must be considered going back to step 3 to evaluate the selection of objective fonctions or constraints.
2.6. Step 6: Results analysis and selection of the optimal configuration
The implementation and solution of a multiobjective optimiza tion strategy Iead to a set of optimal tracte-off solutions (Pareto
front) that satisfy the objective functions to the best possible ex tent. Therefore, the decision maker's task is now to select the best choice among the optimal tracte-off solutions. In order to guide this decision, the use multiple criteria decision making (MCDM) tool is proposed.
2.6.1. Step 6.a. Analysis of the pareto front
The solutions represented in the Pareto front correspond to the different optimal design strategies for the WWTP in the associated variable space.
2.6.2. Step 6.b. Multiple criteria decision making
In general, it is not possible to specify which of the optimal so lutions is the best tracte-off solution because they ail satisfy the Pareto optimality condition. Instead of allowing an informai or arbitrary WWTP selection from the Pareto front, this paper pro poses the use of multiple-criteria decision making (MCDM) meth ods to find the best tracte-off solution. MCDM refers to ail meth ods that aid people to make decisions according to their prefer ences, in cases where there are more than one conflicting crite ria (Mardani et al., 2015). These methods allow choosing, sorting and arranging data sets ( Collette and Siarry, 2003 ). A review of the applications and methodologies of the MCDM techniques and ap proaches can be found in Mardani et al. (2015). Sorne of the exist ing methods are ELECTRE, TOPSIS, and AHP, which can be applied in supply chain, safety and risk management, energy, environment, sustainability, and other fields.
The selection of the MCDM method is mainly based on the applicability of the technique for a given problem. A variety of methods exists. ELECTRE (Elimination and Choice Translating Real ity) method was introduced by Roy (1968) developed to deal with "outranking relations" by using pair wise comparisons among al ternatives under each one of the criteria separately. This method is especially convenient when there are decision problems that in volve a few criteria with many alternatives saving time. A very popular MCDM is TOPSIS (Technique for Order Preference by Sim ilarly to Ideal Solution) developed by Hwang and Yoon (1981) as an alternative to ELECTRE. The basic concept of TOPSIS is that the chosen alternative should have the shortest distance from the pos itive ideal solution (utopia point) and the furthest from the neg ative ideal solution (nadir point). The relative distance from each evaluated alternative to the ideal reference point is calculated to determine the ranking order of ail alternatives (Ren et al., 2007). This approach offers several advantages: rational and understand able; simple calculation, the concept permits the pursuit of the best alternatives for each criterion depicted in a simple mathe matical form and, the importance weights are incorporated into the comparison procedures. However, one of the problems related to TOPSIS is that it can cause the phenomenon known as rank reversai (Garcfa-Cascales and Lamata, 2012). In this phenomenon, the alternative order of preference changes when an alternative is added to or removed from the decision problem. To deal with this problem, the method M-TOPSIS, developed by Ren et al. (2007) was proposed as a nove!, modified TOPSIS (M-TOPSIS) method to eval uate the quality of the alternative and to deal the rank reversai problem. For this reason, M-TOPSIS method has been used for the proposed framework in this work.
If not enough optimal solutions are obtained to analyze the Pareto front from its shape, it is considered returning to step 5. Ad ditionally, in case of any inconsistency is found, it is recommended to check for errors in the solution algorithm used for the optimiza tion problem. On the other hand, if the selection of the optimal process does not meet the preferences of the decision makers, it is considered to return to step 1. Note that the optimal WWTP is difficult to obtain in one pass through the framework proposed. Therefore, some iterations are needed.
3. Application of the framework
In this section, the framework presented for the optimal design of sustainable WWTP is applied to a case study, which addresses the problem of municipal wastewater treatment. The case study is based on data available in the literature and aims at represent ing the complexity of a municipal WWTP grassroot design, which is related to the quantity and type of contaminants, the number of treatment techniques options, the compliance of environmen tal regulations, and the sustainable water management. The prob lem statement can be defined as: given a set of streams from the municipal sewage with known flowrates, that contains certain pol lutants with known concentrations and different wastewater dis charge effluents or streams of treated wastewater for reuse; the goal is to design a WWTP that can remove a Joad of pollutants to desired limits (standards) for discharge and/or reuse, that best ful fill the sustainability functions. It is expected to get the best design in terms of sustainability, the output results must be the treatment technologies used and the treated flowrates, the configuration of the process, and the flowrates streams of the treated wastewater for discharge or reuse. In the following subsections, the formula tion and solution of a case study for a sustainable WWTP grass root design problem, according to the proposed framework, is dis played.
3.1. Step 1: Information/data collection and identification of bottlenecks
3.1.1. Step 1.a. Case study identification and description
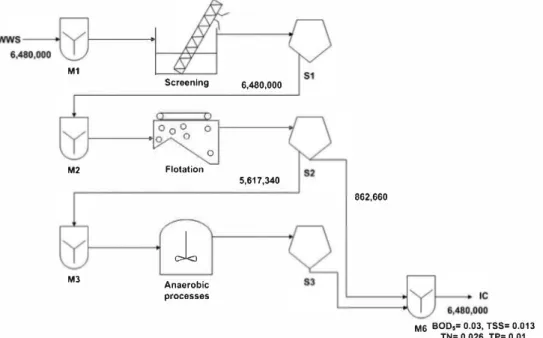
A municipal wastewater case from Mexico City used for agri cultural irrigation in the Valley of Tula, known as the Mezquital Valley, is considered Uiménez, 2005). Mexico City generates an av erage of 75 m3 /s of wastewater (municipal), which is collected in a unified combined sewer system. The wastewater must be treated before discharge to meet the environmental limits established by the Mexican Official Standards (SEMARNAT, 2014). In this case, the metals concentrations are within the allowable limits. Then, we are focusing on treating the contaminants of concern in terms of the biochemical oxygen demand (BOD5), total suspended solids (TSS), total nitrogen (TN) and total phosphorus (TP). Table 2 shows the average characteristics of this wastewater, as well as the permis sible limits of discharges. Thus, three types of receptor bodies are considered A, B, and C. For type A, rivers are the receptor body; coastal waters are considered for type B, and type C considers nat ural water deposits for the protection of aquatic life. Regarding the reclaimed water, two possible types of reuses for treated water are considered: services to the public with direct contact (DC) and ser vices to the public with indirect or occasional contact (IC). The selection of the wastewater discharge effluents and the purposes of reuse are based on the environmental standards established by SEMARNAT (2014). This information suggests that the configuration of the WWTP may have more than one discharge stream.
3.1.2. Step 1.b. Identification of treatment techniques and processes limitations
A comprehensive review of the available information in the lit erature was carried out concerning contaminants and treatment techniques (Brinkmann et al., 2016; Hendricks, 2006; Metcalf and Eddy et al., 2014; Romero, 2004). This information was analyzed according to heuristic methods utilized for identifying bottlenecks, to mie out those techniques that are not capable of removing the contaminants in the influent for the case study and/or are not suit able to accomplish the goals of the treatment in the WWTP. Ad ditionally, the selection of treatment techniques depends on the availability and quality of the data. Then, the considered tech niques are screening, grit separator, oil-water separation, primary
].I. Padr6n-Paez, S.D.-L Almaraz and A. Roméin-Martfnez
Table 2
Characteristics of Mexico City's wastewater and discharge limits (SEMARNAT, 2014) (Receptor bodies, A: rivers; B: coastal waters; C: Natural water deposits for the protection of aquatic life ).
Contaminant (mg/1) Average Receptor body A Receptor body B Receptor body C Services with direct Services with indirect limits BODs 240 200 TSS 295 200 TN 26 60 TP 10 30 Table 3
Capital cost and Operating cost for techniques of the WWTP options. Treatment unit or combination
Screening Grit separator Oil-water separation Primary sedimentation Filtration Flotation Coagulation/flocculation+Primary sedimentation Aerobic processes Anaerobic processes Aerobic + anaerobic process Anaerobic + anoxie + aerobic
processes combined Chemical oxidation Chemical precipitation'" Membrane processes " Carbon adsorption Ion exchange " Stripping• Electrochemical processes
Capital cost (USD) 196F°56 123F°·76 4, 800P'·7' 375F°·7 1, 405F°·61 29, 837F°37 375F0-7 + 30F0-91 72F + 368,043 11, 512F° .. 526 72f + 368,043 + 11, 512f0.4526 162f + 980, 820 + 11' 512f0.4526 121, 204F°3767 0.0488f + 0.0218 70.419P'·749 262.22P'·9367 1, 074pl.445 16, 800F°·7 73, 073P'-2263 limits 150 125 60 30 limits 60 60 25 10
Operating cost (USD/year) o.0215pl.439s , .. 0.0215P'.4398 , .. 0.0215P'·4398 , .. 11.02fl.OI 11.02fl.OI 842.4P'·6135 11.02fl.OI 4.58f + 36, 295 0.67f + 26, 748 5.25f + 63,043 93f0.834 + 5.25f +63, 043 1, 287.4f 0.0265f + 0.0218 265.97F°5429 1, 480. lP'-6076 654.07F°3878 8, 600f 0.48fl.44
contact limits contact limits 20 20 60 30 30 30 60 30 Reference Romero-Rojas, 2004 Martin and Martin, 1991 Kuo and Smith, 1997
Martin and Martin, 1991 Romero-Rojas, 2004 Brinkmann et al., 2016 Romero-Rojas, 2004 Qasim, 1998
Brinkmann et al., 2016 Martin and Martin, 1991 Sharma, 2010
Qasim, 1998 Sharma, 2010 Kuo and Smith, 1997 Romero-Rojas, 2004
Brinkmann et al., 2016 Note:Fin m3/d, 'Fint/h," Fingpd, '" FinMGD and its cost is generated in million dollars.
sedimentation, filtration, flotation, coagulation/flocculation com bined with primary sedimentation, aerobic process, anaerobic pro cess, aerobic combined with anaerobic process, anaerobic-anoxic aerobic processes combined, chemical oxidation, chemical pre cipitation, membrane processes, carbon adsorption, ion exchange, stripping and electrochemical processes.
3.1.3. Step 1.c. Selection of sustainability indicators
From a literature review (Balkema et al., 2002; Molinos Senante et al., 2014; Popovic et al., 2014), it was determined that total cost, removal efficiency of contaminants, energy consumption and customer value are the indicators that represent in a depend able way the three dimensions of sustainability (Tables 3-5). The total cost is the sum of capital costs (CAPEX) and operating costs (OPEX), which are considered to assess the economic aspect. The removal efficiency of contaminants and the energy consumption are proposed to caver the environmental aspect. The first environ mental criterion is an indicator of the overall system efficiency. On the other hand, the energy consumption in the WWTP is an indi cator to address optimal resource utilization (Balkema et al., 2002). For the social dimension of sustainability, an indicator to measure the customer value is proposed. This metric evaluates the amount of treated water that is reused and its purpose (Popovic et al., 2014). For example, reclaimed water for non-potable reuse pur poses such as landscape irrigation. The use of reclaimed water is an indirect mode to measure public trust in wastewater facilities. Table 4
3.2. Step2: Superstructure generation
3.2.1. Step 2.a. Superstructure of the WWTP technologies options
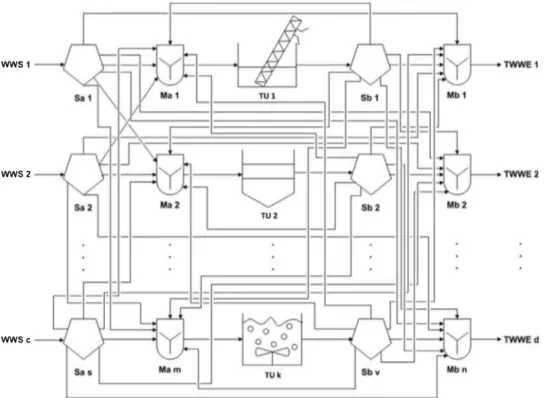
A general superstructure for the connections between technolo gies and streams is proposed. From Fig. 2, it is possible to get the optimal configuration of a WWTP, considering splitting units (S), mixing units (M) and treatment units (TU). From the information collected and the analysis of limitations for the treatment tech niques, the potential treatment units were determined for the dif ferent stages of the WWTP. The techniques for the first level are screening, grit separator, and oil-water separation. Primary treat ment considers primary sedimentation, filtration, flotation and co agulation/flocculation combined with primary sedimentation. Aer obic process, anaerobic process, aerobic combined with anaerobic process, combined anaerobic-anoxic aerobic processes and chemi cal oxidation treatments are available at the secondary treatment stage. In the tertiary treatment, chemical precipitation, membrane processes, carbon adsorption, ion exchange, stripping and electro chemical processes are included.
3.3. Step 3: Optimization problem formulation
3.3.1. Step 3.a. Multiobjective sustainability function de.finition
Severa! criteria are considered simultaneously, which are re lated to the three dimensions of sustainability. From an economic perspective, the purpose of the multiobjective optimization is to minimize the total cost (TC) of the WWTP design.
TL TU
Min TC=
L
I:cch_k(Fh.k)+
och_k(Fii.k), Vh E ru, v k En (2) k hTable 4
Removal efficiency for techniques of the WWTP options.
Treatment unit or combination Removal efficiency (%) BODs Screening 0-5 Grit separator 0-5 Oil-water separation Primary sedimentation 30-40 Filtration 20-60 Flotation 10-50 Coagulation/flocculation+ 40-70 Primary sedimentation Aerobic processes 80-85 Anaerobic processes 75-85 Aerobic + anaerobic process 99 Anaerobic + anoxie + aerobic 90-95
processes combined Chemical oxidation 70-99 Chemical precipitation 50-85 Membrane processes 90-100 Carbon adsorption 50-85 Ion Exchange Stripping Electrochemical processes 85 Table 5
Consumed energy for techniques of the WWTP options. Treatment unit or combination
Screening Grit separator Oil-water separation Primary sedimentation Filtration Flotation
Coagulation/flocculation + primary sedimentation Aerobic processes
Anaerobic processes Aerobic + anaerobic process
Anaerobic + anoxie + aerobic processes combined Chemical oxidation Chemical precipitation Membrane processes Carbon adsorption Ion exchange Stripping Electrochemical processes TSS 5-10 0-10 50 50-65 60-80 70-95 50-80 80-90 80-95 70-90 90-100 50-80 95
where cch, k(Fh, k) and och. k(Fh, k) are functions of the system flowrates that can take different forms, like linear, exponential, po tential and polynomial (Table 2).
Iwo objective functions are proposed to cover the environ mental aspect, the removal efficiency of contaminants (RE) and the consumed energy (CE). This last criterion can also be consid ered as an eco-efficient indicator (environmental and economic) (Alvarez del Castillo-Romo et al., 2018), since it influences the op erational cost (OPEX) of a WWTP. The first environmental criterion is defined as the maximization of the sum of the global removal efficiency of contaminants: J MaxRE=LT/iwi,
i=1,2, ...
,J
(3) where C1· in - C1· out T/j= '
'
Cj,in (4)where RE is the sum of the individual removal efficiency for each contaminant (T/j) multiplied by the weight associated for a specific pollutant (W;), and T/j is defined from the initial and final
concen-TP TN Reference
Qasim, 1998 Romero-Rojas, 2004 Kuo and Smith, 1997
10-20 20-40 Qasim, 1998
20-50 50-70
Romero-Rojas, 2004
70-90 50-90 Qasim, 1998
10-25 60-85 Qasim, 1998
Metcalf and Eddy et al., 2014
70-90 90-100 10-30 Consumed energy (kWh/m3) 0.0003-0.0005 0.003-0.013 0.06 0.0057-0.0082 0.003 0.03-0.04 0.01 77-0.02 0.13-0.32 0.093-0.16 0.6 0.503-0.57 0.05-0.1 0.0002-0.0024 0.5-0.65 0.02-0.035 0.395 0.1-0.5 1.1-2.2 70-95 80-95 90-100 30-50 90-95 60-95 Brinkmann et al., 2016 Qasim, 1998 Brinkmann et al., 2016 Romero-Rojas, 2004 Qasim, 1998 Statyukha et al., 2008 References
Metcalf and Eddy et al., 2014 Quaglia et al., 2014 EPRI, 2013 Persson et al., 2006 Metcalf and Eddy et al., 2014 EPRI, 2013
Metcalf and Eddy et al., 2014 Amiri et al., 2015
Metcalf and Eddy et al., 2014 Molinos-Senante et al., 2014 Metcalf and Eddy et al., 2014 EPRI, 1996
Metcalf and Eddy et al., 2014 Mousel et al., 2017 Drewes et al., 2009 Brinkmann et al., 2016 Metcalf and Eddy et al., 2014
trations of pollutants in the overall process ( ci, in and ci, out). The minimization of consumed energy (CE) in the WWTP is defined as:
TL TU
Min CE =
L L
CEh_kFh,k, Vh Eru,
V k E TLk h (5)
where, CE is the summation of the individually consumed en ergy by the treatment units (CEh, k) multiplied by the wastewater flowrate (Fh,
k)-For the social dimension, the percent of water reused (WR) or the use of reclaimed water is maximized, using the following func tion:
Max WR
= (
I{
Fr) x 100, r=
1, 2, ... , R (6) where, Fr is the flowrate of reused treated wastewater for the pur pose r, and Ft is the total wastewater flowrate. The different pur poses of reuse (DC and IC) are considered equally important, al though relative weights can be used.].I. Padr6n-Paez, S.D.-L Almaraz and A. Roméin-Martfnez
WWS1
WWS2
WWSc
Fig. 2. General superstructure for a WWTP (WWS: Wastewater source, Sa and Sb: Splitters, Ma and Mb: Mixers, TU: Treatment units and TWWE: Treated wastewater effluents).
3.3.2. Step 3.b. Fonnulation of constraints
For the setting of logical constraints, it is only possible to select one treatment technique by stage Eq. (7)). Also, in the final dis charge, three streams exit to two types of reuses (DC and IC). In addition, there is only a single type of receptor body (Eqs. (8) and (9). TU I:Vh,k
:'."'.
1, Vk E TL h R LYr :'."'. 2, r = 1, 2 DS LYds :'."'. 1, ds = 1, 2,3 ds (7) (8) (9) where Yh, k are binary decision variables for the treatment h withthe number of equipment TU for each treatment level k with the number of stages TL in the WWTP. The binary variables utilized to select the type of reuse (r) and the type of receptor body (ds) are Yr and Yds• respectively. Additionally, a maximum of four treatment stages is defined:
TL TU
LLYh,k:'."'.4, VhETU, V kETL
k h (10)
For structural constraints definition, recirculation to the same treatment unit is not allowed, because this would imply that the technique is inadequate for the treatment of the contaminants to be removed Eqs. (11) and ((12)):
TL
LYsr,k
=
0, k=
1, 2, 3, 4k
(11) (12)
where Y5, k are binary variables to restrict self-recycled streams.
fk°5r and j:�sr are the flowrates of the self-recycle streams in the output and input, respectively.
In order to obtain appropriate characteristics of the wastewa ter to be treated at each level of the system, it is only possible to recirculate a stream to the previous stage of treatment (for exam ple, from secondary treatment to primary treatment), and a stream cannot skip the sequential order of treatment for one or more stages of the WWTP (bypasses), given by the Eqs. (13), (14) and (15). 2 F.oby " F.iby v k 1 2 k = � k+2 'by.k, = , k 2 LYby,k
=
0, k=
1, 2 k (13) (14) (15) where, ft°5_1 is the flowrate of the recirculated stream towards the input, F(:r5 is the flowrate of the recirculated stream from the out-put,Fty
is the flowrate of the bypass stream from the output, F��2 is the flowrate of the bypass stream towards the input, Y rs, k and Yby.k are binary variables.For the formulation of the operational constraints, the concen trations of pollutants in the discharge streams should meet envi ronmental regulations, as well as the concentrations of contami nants for each type of reuse:
0 :'."'. cj,ds :'."'. cf�;, Vj E], 'Ids E DS
0 ::c:: ci,ic ::c=: cf;",!', Vj E], Vic E IC
(16) (17) (18)
WWS M1 P-T os M2 PT oc M3 ST IC S4 TT
Fig. 3. Superstructure for the WWTP of the case study, which considers one type of discharge (DS), reuse of treated wastewater on public services (DC and IC); and four treatment levels: Pre-treatment (P-T), primary treatment (PT), secondary treatment (ST), and tertiary treatment (TT).
where the concentrations of contaminants in the possible dis charge streams (cj, ds, ci, de and ci, icl, must fulfill a lower and upper limit (cT,J;, cT,�, and cT,;'::"l- The logical and structural constraints have a direct impact on the general superstructure for a WWTP. If these constraints are evaluated first, the number of possible con figurations (search space) can be reduced. Then, the complexity of the superstructure is reduced, as shown in Fig. 3. This configura tion considers one type of discharge (DS), reuse of treated wastew ater on public services (DC and IC); and four treatment levels: pre treatment (P-T), primary treatment (PT), secondary treatment (ST), and tertiary treatment (TT).
3.4. Step 4: Madel de.finition
3.4.1. Step 4.a. Benchmarking mode/ retrieval
In this case study, a single constitutive relation is considered, which is the removal efficiency for each pollutant in the different treatment units, considered as a constant value independent of the wastewater flowrate to be treated. In Table 3 the maximum per centage values reported are fixed for the calculation of the amount of pollutant eliminated in the treatment units in Eq. (19):
pmaxi,h,k
Ej,h,k= 100 , 'v'JE],'v'hETU, 'v'kETL (19)
where Ei, h, k is the removal efficiency coefficient of contaminants;
and pmaxi, h, k is the maximum percentage of removal reported of
pollutant.
3.4.2. Step 4.b. Mode/ development
The proposed process mode! is based on mass balances for de sign purposes in terms of the total water flowrates and contami nants concentration, following standard relations. The balances are made around each unit operation of the superstructure, namely, mixers, splitters, and treatment units. A mixer m E MU considers
a set of input streams i specified in the set of indexes Mm and only one output stream o. The mass balance of total water flow and mass balances for each pollutant j in the mixer m are given by Eqs. (20) and (21 ), respectively:
L
F�=
F�, 'v' m EMU (20)iEMm
L
F�c},m = F�cJ,m• 'v'j E], 'v' m EMU (21)iEMm
where F� is the flowrate of the input stream, fri\ is the flowrate of the output stream, c},m is the concentration of the contaminant j in the input stream, and c'},m is the concentration of the contaminant j in the output stream.
A splitter s E SU has only one input stream i and a set of output streams o that are specified in the set of indexes 55• The water flow
rate balance for these units is given in Eq. (22). In this case, the concentration of the pollutants is the same for the streams leaving the splitter that for the inlet stream (Eq. (23)):
F;
=
Lfs
0
, 'v' SE SU (22)OESs
C}_s = c'},5, 'v'j E], 'v' s E SU (23)
where
Fj
and c},s are the flowrate and concentrations of the pol lutants in the input stream, Fs° and c'},s are the flowrate and the concentration of the pollutant in the output stream.Each treatment level k E TL consists of different treatment units
(h E TU), specified by the set of indexes, that has one input stream i and one output stream o. Since the concentration of contaminants
is low (ppm), it is assumed that the total water flow of the output stream (F,: k) does not change in the treatment unit (Eq. (24)). The
].I. Padr6n-Paez, S.D.-L Almaraz and A. Roméin-Martfnez
used to choose the treatment is Yh, k· Thus, the mass balance equa tion for each contaminant (Eq. (25)), can be expressed as a linear function of the individual contaminant concentration in terms of Ej, h, k·
F� k = Ft k• 'v'h E
ru,
v k E n (24)3.5. Step 5: Solution strategy
3.5.1. Step 5.a. Mono-objective optimization
The complete optimization mode! consists of Eqs. (2)-(25) and combines continuous variables with binary variables. The sources of nonlinearities are found in the equations of total cost and the mixer units Eqs. (2) and ((21 )). Moreover, Eq. (21) contains bilinear terms, which are a source of non-convexities for the optimization mode!. Therefore, the proposed optimization mode! gives rise to a non-convex MINLP problem, which often exhibits local minima and causes convergence difficulties. From the comparative analysis of mono-objective methods, the branch and bound one was selected because it can handle non-convex terms and can find global so lutions. Furthermore, to facilitate the decision of whether connec tions exist or not between treatment units and/or treated wastew ater effluents, disjunctions are added to the mode!:
[ Fww :S max F ydj ] V [ ydj ] fww = 0 ' 1 d . E � Dit (26) where Ydj are binary variables, Fww represent the flowrate in the
treatment units and/or treated wastewater effluents ( continuous variable), and dj E DJ are the disjunctions. In order to solve this disjunctive programming mode!, a Big-M relaxation is employed (Eq. (27)), which enables the activation or deactivation of the bi nary variables (Ramos et al., 2014). M is a large enough coefficient. fww :S MYdj, dj E DJ (27)
3.5.2. Step 5.b. Multiobjective optimization
For the multiobjective optimization problem, a hybrid method (lexicographie + e-constraint) is used because it can obtain effi cient solutions for problems with non-convex feasible regions con taining discrete variables (Mavrotas and Florios, 2013). To apply the proposed hybrid method, the first task is to perform the lexico graphie optimization. In the lexicographie method, the objectives are ranked according to the order of importance. The optimization process starts minimizing or maximizing the most important ob jective and proceeds according to the assigned order of importance of the criteria. On the other hand, for the e-constraint method, one of the objective functions is optimized white the others are con verted into constraints. For this specific case, the total costs are minimized white the environmental aspect (RE and CE) and the so
cial dimension (WR) are taken as restrictions. Considering the max imum and minimum values (payoff table) resulting from the lexi cographie optimization, the search of intervals for the constrained objective functions are defined. Hence, by parametrical variation in the right-hand-side of the constrained objective functions the effi cient solutions of the problem are obtained. Following this proce dure, the Pareto front can be obtained.
3.5.3. Step 5.c. Software and solvers selection
The mode! coding and solution were performed in GAMS® 24.7, selected since it provides three different MINLP solvers, BON MIN, BARON and COUENNE for handling the formulated prob lem. The branch-and-bound algorithm of BONMIN is strongly rec ommended for solving non-convex MINLPs; however, it is a
lo-cal solver Bonami et al., 2008). BARON is a computational sys tem for solving non-convex optimization problems to global op timality, implementing algorithms of the branch and bound type (Tawarmalani and Sahinidis, 2005). On the other hand, COUENNE aims at finding global optima of non-convex MINLPs. It im plements linearization, bound reduction, and branching methods within a branch-and-bound framework (Belotti et al., 2009). The solver BONMIN was discarded because no feasible solutions were obtained for any of the mono-objective optimizations. Regard ing global solvers, the best results were obtained considering the solver COUENNE with the Big-M formulation. Therefore, COUENNE was selected as the solver for the WWTP design. In the first in stance, the mono-objective optimizations are solved for each of the proposed sustainability criteria (TC, RE, CE, and WR). The math ematical programming mode! (Eqs. (2-(25)) was implemented in GAMS® using the solver COUENNE (MINLP) and the Big-M formu lation Eqs. (26) and ((27)). The MINLP mode! involves 712 contin uous variables, 237 discrete variables and 693 equations (including constraints). The optimization runs were performed with an Intel (R) Core (TM) i3-6100 U CPU @2.30 GHz processor machine.
3.6. Step 6: Results analysis and selection of the optimal configuration
3.6.1. Step 6.a. Analysis of the pareto front
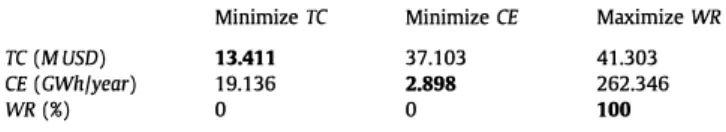
First, the results concerning the four criteria evaluated sepa rately (mono-objective) are presented in Table 6. For the economic criteria, (TC) and energy consumption (CE) fewer treatment stages
(pre-treatment and primary treatment) are required to meet the goals compared to the others objective functions (RE and WR),
where ail treatment levels are considered to find their maxima. The numerical values of the optima for both maximized criteria (RE and WR) are very similar (Table 6), indicating that these criteria are closely related. Thus, it was decided to omit the environmental cri terion (RE), because it can be evaluated considering the contami nants concentration limits as an indirect measure of the removal efficiency of contaminants. Consequently, to assess the three di mensions of sustainability, total cost (TC), consumed energy (CE)
and percent of water reused (WR) are optimized.
From the mono-objective results, it is observed that TC, CE, and
WR are antagonists, since the numerical values indicate improve
ment in opposite ways. Then, the tri-objective optimization prob lem is solved by implementing the hybrid method in GAMS. The results of the lexicographie optimization are presented in Table 7. In the e-constraint method, one of the objective functions is op timized using the others as constraints. For this specific case, the total costs are minimized white the environmental aspect (CE) and
the social aspect (WR) are taken as restrictions. Considering the maximum and minimum values of the payoff table resulting from lexicographie optimization (Table 7), i.e., CE in the range of 2.898-262.346 GWh/year and WR in the range of 0-100, it is possible to
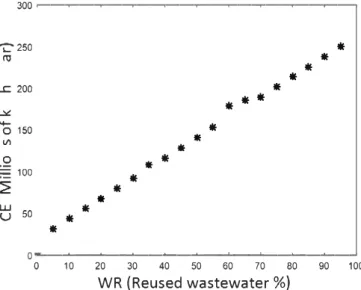
define the search intervals for the e-constraint method. In Fig. 4, the non-dominated feasible solutions are shown when 21 points are analyzed.
The Pareto fronts (Fig. 4) show monotonically increasing ten dencies, except for some points which have a cost decrease while increasing energy consumption (antagonist relation). These points are observed when the percentages of wastewater reused are close to zero (0%-5%). This trend of optimal solutions should be con sidered when selecting the WWTP design with the best compro mise between the evaluated criteria (TC, CE, and WR), because it
could be an error assuming that the increase in total costs, en ergy consumption and the reuse of treated wastewater is linear and monotonie. Additionally, in order to analyze the antagonistic relationship between TC, CE and WR, the two-dimensional projec