HAL Id: dumas-01275839
https://dumas.ccsd.cnrs.fr/dumas-01275839
Submitted on 18 Feb 2016HAL is a multi-disciplinary open access archive for the deposit and dissemination of sci-entific research documents, whether they are pub-lished or not. The documents may come from teaching and research institutions in France or abroad, or from public or private research centers.
L’archive ouverte pluridisciplinaire HAL, est destinée au dépôt et à la diffusion de documents scientifiques de niveau recherche, publiés ou non, émanant des établissements d’enseignement et de recherche français ou étrangers, des laboratoires publics ou privés.
CGE-LIF pour cartographie des glycanes : amélioration
de méthode et création d’une base de données des
N-glycanes
Pauline Ulrich
To cite this version:
Pauline Ulrich. CGE-LIF pour cartographie des glycanes : amélioration de méthode et création d’une base de données des N-glycanes. Sciences pharmaceutiques. 2015. �dumas-01275839�
1
Université de Bordeaux
U.F.R. DES SCIENCES PHARMACEUTIQUES
Année : 2015
N°………..
Thèse pour l’obtention du
DIPLÔME d’ETAT de DOCTEUR EN PHARMACIE
Présentée et soutenue publiquement
Par Pauline ULRICH
Née le 16 septembre 1990 à Bordeaux
CGE-LIF pour cartographie des glycanes :
amélioration de méthode et création d’une base de
données des N-glycanes
Directrice de thèse
Professeur GAUDIN Karen
Jury
Mme GAUDIN Karen, Professeur Présidente
Mme KRSTANOVIĆ-ANASTASSIADES Ana, Assistant Scientist Juge
Mme LANGLOIS Marie-Hélène, Docteur en Pharmacie, Maître de conférences Juge
2
REMERCIEMENTS
J’adresse mes sincères remerciements aux personnes qui m’ont aidée dans la réalisation de ce mémoire.
En premier lieu, je remercie Ana Krstanović-Anastassiades, Assistant Scientist en développement analytique chez Merck Serono. En tant que maître de stage, elle m’a fait partager son expertise et m’a guidée dans mon projet avec une grande implication. Merci à Flavie Robert, Manager chez Merck Serono, de m’avoir offert un sujet de stage captivant et complexe grâce auquel j’ai énormément appris. Je remercie Karen Gaudin, Professeur de Chimie Analytique à l’Université de Bordeaux, pour avoir apporté un regard extérieur à mon travail, ainsi que les membres du jury : Marie-Hélène Langlois, Docteur en Pharmacie, Maître de conférences et Ludivine Ferey, Maître de conférences.
Merci à toute l’équipe du BPS-Analytique pour leurs conseils, leur aide et leur bonne humeur : Elodie B, Diego, Lucy, Véronique, Céline, Anne-Laure, Manuel, Fabienne G-M, Alain, Elodie M, Fabienne P, Sabine, Mariflor & Frédéric. Un merci tout particulier à Elodie M. pour m’avoir appris à optimiser mon temps de travail grâce à des conseils avisés.
3
RÉSUMÉ
La plupart des médicaments biopharmaceutiques sont des glycoprotéines dont les propriétés intrinsèques sont fortement dépendantes de leur profil de glycosylation. La glycosylation correspond au processus par lequel les oligosaccharides se lient de manière covalente à des protéines, formant des glycoprotéines. Il s’agit de l’une des modifications post-traductionnelles les plus fréquentes et a un rôle majeur dans de nombreux processus de régulation biologique et de reconnaissance. Des centaines de glycoprotéines sont en cours de développement dans des domaines thérapeutiques aussi variés que l’oncologie, les maladies inflammatoires, la cardiologie ou encore les infections virales. La taille du glycome humain est en outre beaucoup plus grande que celle de son génome et plus de 30 maladies génétiques liées à la glycosylation ont été identifiées (A. Beck, 2008).
La finalité première du développement de protéines thérapeutiques est de délivrer des médicaments sûrs et efficaces. Un suivi rigoureux des attributs physio-chimiques et biologiques critiques des médicaments biopharmaceutiques est de ce fait essentiel pour garantir une efficacité thérapeutique optimale et limiter les effets secondaires. La glycosylation pouvant impacter l’activité protéique, la stabilité et la demi-vie in vivo, elle est devenue un attribut qualité crucial à contrôler au cours du développement aussi bien que pour la libération de lot, la transposition d’échelle ou l’introduction de changements dans les procédés.
Cependant, l’élucidation structurelle des glycanes, dont les structures sont très variées, représente un défi analytique. L’électrophorèse capillaire en gel avec fluorescence par laser (CGE-LIF) est une technique analytique de criblage à haut débit permettant le suivi des différents types de glycanes et de leur distribution. Les profils de glycosylation obtenus sont hautement reproductibles et l’analyse permet de quantifier tous les N-glycanes majeurs, y compris les isomères. Le temps de migration est calibré sur les temps de migration connus de fragments d’ADN.
Les inconvénients principaux de cette méthode étaient le temps de traitement des données et la difficulté d’identifier de façon rapide et certaine les N-glycanes dans les nouvelles molécules en développement.
Grâce à la mise en place d’une nouvelle version du logiciel de traitement des données et à une modification de la préparation des échantillons, le traitement des données est désormais plus rapide et les temps de migration harmonisés : un glycane donné élue dorénavant toujours au même temps de migration quelle que soit la molécule analysée.
Une co-élution survient lorsque plusieurs glycanes éluent à des temps de migration trop proches pour être résolus par la méthode analytique appliquée. La co-élution de pics, empêchant une quantification individuelle de chaque glycane, représente l’un des problèmes majeurs du CGE-LIF. En théorie, augmenter la longueur des capillaires en utilisant des paramètres électrophorétiques adaptés améliore la résolution. Les tests réalisés avec des capillaires de 80cm au lieu de 50cm n’ont cependant pas permis une séparation des pics co-éluant.
La gamme de travail de la méthode a été évaluée en termes de linéarité, de précision et de justesse. Les gammes de quantité de protéine à être chargée et d’intensité de pic maximale ont été définies dans le but d’assurer des résultats linéaires et robustes.
Afin de faciliter le déchiffrage du glyco-puzzle, une base de données rassemblant 64 N-glycanes fréquemment rencontrés dans les protéines thérapeutiques a été construite. Utiliser cette base de données avec la nouvelle version du logiciel de traitement des données permet une identification semi-automatique des N-glycanes basée sur leur temps de migration harmonisé.
Les améliorations mises en place pour le CGE-LIF rendent cette analyse plus rapide et plus précise, que ce soit pour le suivi de la glycosylation ou pour l’identification de N-glycanes dans de nouvelles molécules en développement.
4
TABLE OF CONTENTS
I/ INTRODUCTION ... 10
II/ SCIENTIFIC BACKGROUND INFORMATION ... 11
A/THERAPEUTICANTIBODIES... 11
a) Monoclonal antibodies production ... 11
b) Categories of monoclonal antibodies ... 12
c) Structure of antibodies... 13
B/PROTEINN-GLYCOSYLATION ... 14
C/GLYCANSNOMENCLATURE ... 16
D/IMPORTANCEOFGLYCOSYLATION ... 17
a) Fucose (Figure 14) –cancer and ADCC ... 17
b) Galactose (Figure 16) –inflammation ... 18
c) Mannose (Figure 17) –HIV ... 18
d) Sialic acids (Figure 18, Figure 19) –immunity and serum half-life ... 19
e) Gal-α-1,3-Gal structures (Figure 21) ... 19
f) Conclusion ... 20
III/ MATERIALS AND METHODS ... 21
A/CGE-LIF–MATERIALSANDMETHODS ... 21
a) Introduction ... 21
b) Step-by-step method overview ... 21
B/COMPLEMENTARYGLYCANMAPPINGMETHOD:2-ABUHPLC ... 28
C/THERAPEUTICPROTEINSENCOUNTEREDINTHETESTS... 30
D/STATISTICALMETHODOLOGY ... 30
IV/ RESOLUTION IMPROVEMENT ... 31
A/INTRODUCTION ... 31
B/MATERIALSANDMETHODS ... 31
C/RESULTS ... 32
D/CONCLUSION ... 34
V/ CGE-LIF WORKING RANGE FOR FC-FUSION PROTEINS ... 35
A/INTRODUCTION ... 35
B/PROTEINAMOUNTTOBELOADEDONTHEPVDFMEMBRANE ... 35
a) Protein amount –Introduction ... 35
b) Protein amount –Materials and methods... 35
c) Protein amount –CGE-LIF Results ... 35
C/SIGNALSATURATION ... 41
a) Signal saturation –Introduction ... 41
b) Signal saturation –Materials and methods ... 42
c) Signal saturation –Results ... 42
D/CONCLUSION ... 42
VI/ IMPLEMENTATION OF THE GLYCAN ANALYSIS SOFTWARE ... 43
A/INTRODUCTION ... 43
B/CLEAN-UPTESTS ... 44
a) Clean-up tests –Materials and methods ... 44
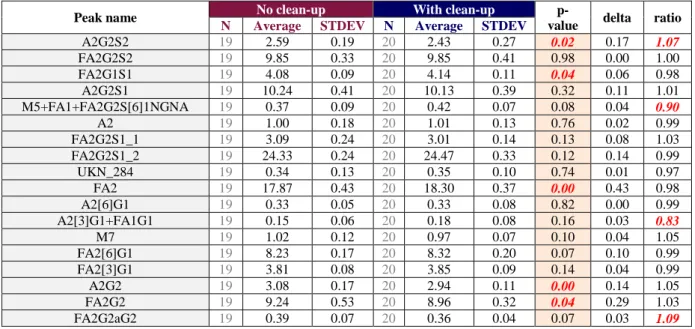
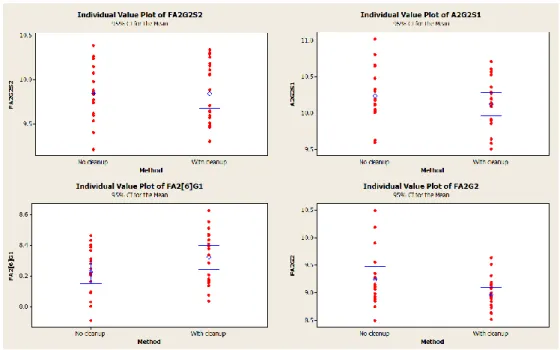
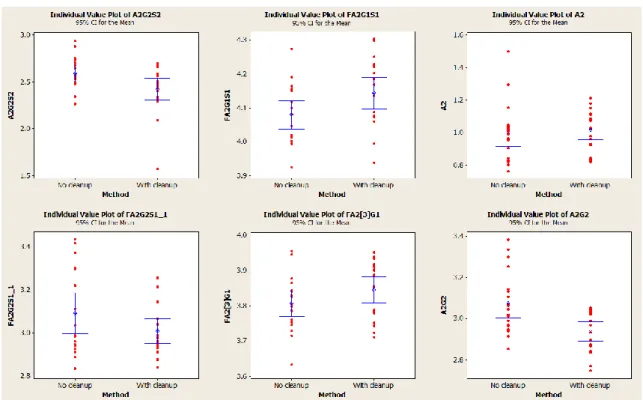
b) Clean-up tests –Results ... 46
C/OLIGOSSPIKING ... 55
a) Oligos spiking –Materials and methods ... 55
b) Oligos spiking –Results ... 56
D/OLIGOSSPIKINGWITHNOCLEAN-UP(JAVA-BASED GLYXTOOL) ... 59
a) Oligos spiking with no clean-up –Materials and methods ... 59
b) Oligos spiking with no clean-up –Results ... 59
E/DATAPROCESSINGUSINGMATLAB-BASEDVS.JAVA-BASEDGLYXTOOL ... 60
5
b) Matlab-based vs. Java-based GlyXtool –Results ... 60
c) Matlab-based vs. Java-based GlyXtool –Conclusion ... 62
F/CONCLUSION ... 63
VII/ IMPLEMENTATION OF A GLYCAN DATABASE FOR CGE-LIF ANALYSIS ... 65
A/PRIMARYPURPOSE ... 65
B/MATERIALSANDMETHODS ... 65
a) Standard preparation ... 65
b) HPAEC-PAD ... 65
C/DATABASEUTILIZATIONWITHGLYXTOOL ... 66
D/RESULTS ... 66
a) Database building ... 66
b) Database utilization: identification of new peaks ... 73
E/CONCLUSION ... 77
VIII/ GENERAL CONCLUSION AND PROSPECTS ... 78
IX/ BIBLIOGRAPHY ... 79
X/ ANNEXES ... 81
TABLE OF ANNEXES
Annex 1: N-glycan nomenclature and graphical representation... 81Annex 2: Electropherograms of the molecules tested (processed via Matlab-based GlyXtool) ... 82
Annex 3: CGE-LIF global variability of sample W ... 85
Annex 4: CGE-LIF global variability of sample X ... 86
Annex 5: CGE-LIF global variability of sample Y ... 87
Annex 6: CGE-LIF global variability of sample Z ... 88
Annex 7: Variability in sample W according to the quantity loaded on the PVDF plate ... 89
Annex 8: Variability in sample X according to the quantity loaded on the PVDF plate ... 90
Annex 9: Variability in sample X according to the dilution factor ... 91
Annex 10: Shift in base pairs in sample X using oligosaccharides mix for 2nd normalization ... 93
Annex 11: Shift in base pairs in sample Y using oligosaccharides mix for 2nd normalization ... 94
Annex 12: Shift in base pairs in sample Z using oligosaccharides mix for 2nd normalization ... 95
Annex 13: Shift in base pairs in sample W using oligosaccharides mix for 2nd normalization ... 96
Annex 14: N-glycan standards entered in the database and their corresponding base pairs number ... 97
6
TABLE OF FIGURES
Figure 1: Production of monoclonal antibodies (NeoBioLab, 2014) ... 11
Figure 2: Phage display method (New England Biolabs, 2015) ... 12
Figure 3: Murine, chimeric, humanized and human antibodies ... 12
Figure 4: Example of Fc-fusion protein (BioProcess International, 2014) ... 13
Figure 5: Basic antibody structure (Sigma Aldrich, 2015) ... 14
Figure 6: Schematic N-glycan layout ... 14
Figure 7: N-glycosidic bond –in red (Université Paris VI, 2014) ... 15
Figure 8: Process of N-linked glycan construction in the ER (Sigma Aldrich, 2015) ... 15
Figure 9: Glycan processing in the ER and Golgi (Université Paris VI, 2014) –adapted ... 15
Figure 10: The three major categories of N-glycans ... 16
Figure 11: Most abundant glycans in mAb biopharmaceuticals using the nomenclature adapted from Glycobiology 2009, 19: 1547-1553 ... 16
Figure 12: Code for glycan nomenclature and N-glycan core structure ... 17
Figure 13: Examples for glycan nomenclature ... 17
Figure 14: Fucose structure... 17
Figure 15: ADCC mechanism ... 18
Figure 16: Galactose structure ... 18
Figure 17: Mannose structure ... 18
Figure 18: NANA structure ... 19
Figure 19: NGNA structure... 19
Figure 20: Sialylation and ASGP receptor (New England Biolabs, 2015)... 19
Figure 21: Alpha Gal structure ... 19
Figure 22: Glycosylation analysis at all stages of the product’s life cycle ... 20
Figure 23: CGE-LIF schematic outline ... 21
Figure 24: Protein denaturation ... 22
Figure 25: Reduction of a disulfide bond by DTT ... 22
Figure 26: Alkylation of a disulfide bond by IAA ... 22
Figure 27: Papac procedure of glycans (D.I. Papac, 1998) ... 23
Figure 28: PNGaseF mechanism of action (New England Biolabs, 2014) ... 23
Figure 29: Reductive amination using APTS and PB ... 24
Figure 30: DNA sequencer 3130xl interior ... 25
Figure 31: Matlab-based GlyXtool interface ... 25
Figure 32: Data processing via Matlab-based GlyXtool ... 26
Figure 33: Java-based GlyXtool interface ... 27
Figure 34: Data processing via Java-based GlyXtool ... 27
Figure 35: 2-AB UHPLC schematic outline ... 28
Figure 36: Peak shape of FA2G1S1 in a routine analysis and in the different tests ... 33
Figure 37: Additional "shoulders" appearing in tests 4 and 5 –sample X ... 34
Figure 38: Illustration of peak splitting in test 4 for sample X (a) and sample Y (b) ... 34
Figure 39: Sample W test for 12.5-200µg range –glycans GT 10% ... 36
Figure 40: Sample W test for 12.5-200µg range –glycans between 5-10% ... 36
Figure 41: Sample W test for 12.5-200µg range –glycans between 1-5% ... 37
Figure 42: Sample W test for 12.5-200µg range –glycans LT 1% ... 37
Figure 43: Sample X test for 12.5-200µg range –glycans GT 15% ... 39
Figure 44: Sample X test for 12.5-200µg range –glycans between 5-15% ... 39
Figure 45: Sample X test for 12.5-200µg range –glycans between 1-5% ... 40
Figure 46: Sample X test for 12.5-200µg range –glycans LT 1% ... 40
Figure 47: Elution regions of free APTS and some of the oligosaccharides used for spiking ... 43
Figure 48: CGE-LIF schematic outline including the clean-up step ... 44
Figure 49: Additional equipment required for the clean-up step ... 45
Figure 50: Critical steps in clean-up procedure ... 45
Figure 51: Glycans GT 15% representing peak height – clean-up test – sample X ... 48
Figure 52: Glycans between 5-10% representing % peak height – clean-up test – sample X ... 48
Figure 53: Glycans between 1-5% representing % peak height – clean-up test – sample X ... 49
Figure 54: Glycans LT 1% representing % peak height – clean-up test – sample X ... 49
Figure 55: Glycans GT 15% representing % peak height – clean-up test – sample Y ... 51
Figure 56: Glycans between 2-5% representing % peak height – clean-up test – sample Y ... 51
Figure 57: Glycans LT 2% representing % peak height – clean-up test – sample Y ... 52
7
Figure 59: Glycans between 2-10% representing % peak height – clean-up test – sample Z ... 54
Figure 60: Glycans LT 2% representing % peak height – clean-up test – sample Z ... 55
Figure 61: CGE-LIF schematic outline including clean-up step and oligos spiking ... 55
Figure 62: Electropherogram with spiked oligos –sample X ... 56
Figure 63: Electropherogram with spiked oligos –sample Y ... 56
Figure 64: Electropherogram with spiked oligos –sample Z ... 56
Figure 65: Electropherogram of sample X –spiked oligos without clean-up (correct 2nd normalization) ... 59
Figure 66: Electropherogram of sample V –spiked oligos without clean-up (incorrect 2nd normalization) 60 Figure 67: A2[3]G1+FA1 in sample Y –profile obtained with Matlab-based GlyXtool (a) and Java-based GlyXtool (b) ... 61
Figure 68: Identification of glycans in GlyXtool using the database ... 66
Figure 69: "Peaks table" tab of GlyXtool ... 66
Figure 70: Schematic representation of M7 ... 67
Figure 71: CGE-LIF electropherogram of M7 standard ... 68
Figure 72: Schematic representation of FA2[6]G1S1 (a) and FA2[3]G1S1 (b) ... 68
Figure 73: CGE-LIF electropherograms of FA2[6]G1S1 and FA2[3]G1S1 standards ... 68
Figure 74: Schematic representation of FA1 ... 69
Figure 75: CGE-LIF electropherogram of FA1 standard ... 69
Figure 76: Schematic representation of FA2G2S2+1LxF (on the left) and FA2G2S2+2LxF (on the right) 70 Figure 77: CGE-LIF electropherograms of FA2G2S2+1LxF (on the left) and FA2G2S2+2LxF (on the right) standards ... 70
Figure 78: Schematic representation of FA2G2aG1 ... 70
Figure 79: CGE-LIF electropherogram of FA2G2aG1 standard ... 71
Figure 80: Schematic representation of FA3G2 ... 71
Figure 81: CGE-LIF electropherogram of FA3G2 standard ... 71
Figure 82: Schematic representation of FA3G3S1 ... 72
8
TABLE OF TABLES
Table 1: Method steps for CGE-LIF and 2-AB UHPLC ... 29
Table 2: Sequencing resolution performance and specifications –3130xl Genetic Analyzer ... 31
Table 3: Run settings on 3130xl Genetic Analyzer ... 32
Table 4: Run settings in routine analysis (50 cm) vs test 1 to test 5 (80 cm) ... 32
Table 5: 80cm capillary array –tests results ... 33
Table 6: Sample W test –12.5-200µg range vs 25-100µg ... 38
Table 7: Sample X test –12.5-200µg range vs 25-100µg ... 41
Table 8: Mean absolute peak heights and number of replicates tested for each dilution factor ... 42
Table 9: Fully nested ANOVA results – No clean-up – sample X ... 46
Table 10: Fully nested ANOVA results – With clean-up – sample X ... 47
Table 11: Results of the 2-sample t-test –sample X ... 47
Table 12: Fully nested ANOVA results – No clean-up – sample Y ... 50
Table 13: Fully nested ANOVA – With clean-up – sample Y ... 50
Table 14: Results of the 2-sample t-test –sample Y ... 50
Table 15: Fully nested ANOVA – No clean-up – sample Z ... 52
Table 16: Fully nested ANOVA – With clean-up – sample Z ... 53
Table 17: Results of the 2-sample t-test –sample Z ... 53
Table 18: Oligos spiking results –sample X ... 57
Table 19: Oligos spiking results –sample Y ... 58
Table 20: Oligos spiking results –sample Z ... 58
Table 21: Data processing results Matlab vs. Java-based GlyXtool –sample Y ... 61
Table 22: Data processing results Matlab vs. Java-based GlyXtool –sample X ... 62
Table 23: Summary of the improvements and new features in Java-based GlyXtool ... 63
Table 24: Number of peaks expected and observed on the CGE-LIF electropherogram of M7... 67
Table 25: Number of peaks expected and observed on the CGE-LIF electropherogram of FA2G1S1 ... 68
Table 26: Number of peaks expected and observed on the CGE-LIF electropherogram of FA1 ... 69
Table 27: Number of peaks expected and observed on the CGE-LIF electropherograms of FA2G2S2+1LxF and FA2G2S2+2LxF ... 70
Table 28: Number of peaks expected and observed on the CGE-LIF electropherograms of FA2G2aG1 .. 70
Table 29: Number of peaks expected and observed on the CGE-LIF electropherogram of FA3G2 ... 71
Table 30: Number of peaks expected and observed on the CGE-LIF electropherogram of FA3G3S1 ... 72
Table 31: New possible co-elutions ... 73
Table 32: Glycans monitored in routine as “unknown” and their tentative identification based on the built-in database ... 73
Table 33: Peak picking region of the glycans monitored in routine ... 74
Table 34: Additional peaks before the first glycan monitored in the samples ... 74
Table 35: Additional peaks among the glycans monitored in the samples ... 75
9
GLOSSARY
2-AB UHPLC: 2-Aminobenzamide Ultra High Performance Liquid Chromatography ACN: Acetonitrile
ADCC: Antibody-Dependent Cell-mediated Cytotoxicity ANOVA: Analysis of variance
APTS: 8-Aminopyren-1,3,6-trisulfonic acid Asn: Asparagine
bp: Base pairs
CDR: Complementary Determining Region
CGE-LIF: Capillary Gel Electrophoresis with Laser-Induced Fluorescence CV: Coefficient of Variation
DTT: Dithiothreitol
EDTA: Ethylene Diamine Tetra-acetic Acid ER: Endoplasmic Reticulum
Fab: Fragment antigen-binding (region of an antibody) Fc: Fragment crystallizable (region of an antibody) GU: Glycan Units
HAT: Hypoxanthine-Aminopterin Thymidine
HILIC: Hydrophilic Interaction Liquid Chromatography HGPRT: Hypoxanthine-Guanidine Phosphoribosyl Transferase
HPAEC-PAD: High-Performance Anion-Exchange Chromatography with Pulsed Amperometric Detection
IAA: Iodo Acetic Acid IgG: Immunoglobuline G mAb: Monoclonal antibody MBL: Mannan Binding Lectin
MF: Master File (reference electropherogram of a therapeutic protein) MS: Mass Spectrometry
MTU: Migration Time Unit
MTU’: Migration Time Unit after first normalization MTU’’: Migration Time Unit after second normalization OST: Oligosaccharyl Transferase
PB: Picoline Borane
PNGaseF: Peptide N-Glycosidase F
PVDF (membrane): Polyvinylidene Fluoride PVP: Poly Vinyl Pyrrolidone
QTPP: Quality Target Product Profile
RCM (buffer): Reduction and S-Carboxy Methylation RFU: Relative Fluorescence Units
SDS: Sodium Dodecyl Sulfate Ser: Serine
STDEV: Standard deviation Thr: Threonine
TNF: Tumor Necrosis Factor UKN: Unknown
10
I/ Introduction
Development and production of monoclonal antibodies (mAbs) and Fc-fusion proteins have been on a drastic rise over the last 15 years. More than twenty have reached the market and hundreds more are in clinical development in various therapeutic areas such as oncology, inflammatory diseases, organ transplantation, cardiology, viral infection, allergy, and tissue growth and repair. Most biopharmaceuticals are glycoproteins whose inherent properties are highly dependent on their glycosylation patterns.
Glycosylation is one of the most common post-translational protein modification and has major roles in several biological regulation and recognition processes e.g. protein sorting and folding, antigenicity, resistance towards proteases, inflammation, pathogenicity, metastasis and other cellular processes. Sialic acids are for instance critical factors for plasmatic clearance, by shielding glycoproteins from uptake via the asialoglycoprotein receptor, while fucosylation has proven to be closely related to cancer biology. Glycans only account for 2 to 3 percent of the total mass of an IgG but add complexity and heterogeneity to the protein. Moreover, the size of the human glycome is substantially wider than its genome and more than thirty genetic diseases linked to glycan synthesis and structure alterations have already been identified (A. Beck, 2008).
The primary purpose of therapeutic proteins development is to deliver safe and effective drugs to patients. A thorough monitoring of protein’s physicochemical and biological critical attributes is thus essential to insure a proper therapeutic effect (required activity level, appropriate pharmacokinetics) and avoid side effects such as adverse immune reactions.
The discovery of different glycan moieties’ involvement in protein secretion or function, cell−cell signaling, serum half-life or even in the diseased or healthy state of a patient has attracted major research attention. Glycosylation depends on multiple factors like production system, selected cell and clonal population, manufacturing process –including culture medium and feed, and can be genetically or chemically engineered. Therefore, monitoring glycosylation profiles is crucial when developing and defining upstream and downstream processes as well as for batch release or introduction of process modifications. However the structural elucidation of glycans, which may possess broad structural diversity including positional and/or linkage isomerism, represents a substantial analytical challenge. Glycosylation is becoming the utmost complex quality attribute to control in the new product development paradigm (QTPP). Different tools are available to monitor and characterize the glycosylation patterns of therapeutic proteins by analyzing glycan nature and distribution. This report focuses on one of these analytical methods used in analytical labs supporting process development of therapeutic proteins: Capillary gel electrophoresis with laser-induced fluorescence (LIF). CGE-LIF allows a separation of both linkage and positional isomeric species based on inherent molecular shape differences. This method is therefore essential for fine and extensive glycan structural analysis. It provides highly reproducible profiles where all major N-glycans are detected and quantified. Thanks to its high throughput and precision, CGE-LIF is the tool of choice for N-glycan high-throughput profiling in biotech process development support. Thanks to its reproducibility and precise retention time, CGE-LIF could also prove useful to aid N-oligosaccharides structural inference. But the lack of a comprehensive commercial CGE-based glycan library and the incompatibility of the sample matrix with mass spectrometry render this identification process tricky.
The present report details modifications set up in CGE-LIF data processing method to improve glycan identification and quantification process while keeping its high-throughput aspect. It also depicts the implementation of a library gathering glycosylation patterns observed for most of the current approved therapeutic antibodies, meant to facilitate glycan automated structural elucidation in new proteins in development.
11
II/ Scientific background information
A/ THERAPEUTIC ANTIBODIES
a) Monoclonal antibodies production Hybridoma technologyMonoclonal antibodies are antibodies specifically binding to one epitope because they originate from the same plasma cell originating from the same cell. In the method depicted in Figure 1, they are the fruit of the merger between B lymphocytes and tumor cells. The selected hybridomas therefore have both endless multiplication capacities and antibody secreting functions.
Figure 1: Production of monoclonal antibodies (NeoBioLab, 2014)
The fused cells are the only ones capable of survival in the chosen culture medium (HAT: hypoxanthine-aminopterinthymidine). As a matter of fact, plasma cells have a short lifetime and are unable to multiply in vitro: the unmerged ones die rapidly. On the other hand, tumor cells are deficient in Hypoxanthine-Guanidine Phosphoribosyl Transferase (HGPRT), an enzyme involved in nucleotide synthesis and essential to the survival in an HAT medium. The latter contains aminopterinthymidine, which blocks the only nucleotide synthesis route available for unmerged tumor cells, leading to their death. HGPRT-producing cells have the ability to shunt this synthesis pathway and keep on multiplying.
Phage display method
New technologies avoiding the use of non-human mammals saw the light of day. Among them, the phage display method currently appears to be the most promising one (Figure 2). This technology uses bacteriophages to “display” a protein of interest on its outer face while containing the gene for the protein on its inner face, resulting in a connection between genotype and phenotype. These displaying phages can in this way be screened against other proteins, peptides or DNA sequences to detect interaction between the displayed protein and those other molecules. Large amounts of proteins can thus be screened and amplified.
12 Figure 2: Phage display method (New England Biolabs, 2015)
b) Categories of monoclonal antibodies
Therapeutic monoclonal antibodies currently on the market belong to different categories according to their origin (Figure 3):
Figure 3: Murine, chimeric, humanized and human antibodies
Murine antibodies
Murine antibodies were historically the first ones to reach the market, but their therapeutic use led to disappointing results mainly due to severe adverse effects such as anaphylactic shocks. Because of the great discrepancies between human and murine antibodies, the latter are not recognized by the human immune system and trigger adverse immune responses, with a repercussion on the half-life in vivo. For such biopharmaceuticals, the suffix “-omab” is added to the name.
Chimeric antibodies
In chimeric antibodies (or Fc-fusion proteins), murine DNA encoding the binding portion of a monoclonal antibody is merged with human antibody-producing DNA in living cells (Figure 4). The expression of this chimeric DNA through cell culture yields partially mouse (25%) partially human (75%) monoclonal antibodies, thus decreasing adverse immune responses. The peptide of interest
13 being directly linked to an Fc domain, the plasma half-life is enhanced and the interaction with Fc-receptors found on immune cells is allowed, a particularly important feature endowing the molecule with anticancer and vaccine-like properties.
For such biopharmaceuticals, the suffix “-ximab” is added to the name.
Figure 4: Example of Fc-fusion protein (BioProcess International, 2014)
Humanized antibodies
Humanized antibodies are antibodies from non-human species (e.g. murine species) modified to enhance their degree of similarity to natural human antibody variants (90% human). Humanization aims to produce variable regions close to the human ones with neither affinity nor specificity loss compared to the murine antibody. Murine Complementary Determining Regions (CDR) transplanted in human variable regions are expected to replace human CDRs without affecting the structure of the antigen binding site. Yet, most humanized antibodies happen to have a different affinity for the antigen as compared to the corresponding murine antibody. Some amino acids located in CDRs adjacent regions therefore play a major role in antigen binding. In order to maintain this structure, both murine CDRs and amino acids close by are to be grafted. Humanized antibodies can also be produced by creating a chimeric intermediate.
For such biopharmaceuticals, the suffix “-zumab” is added to the name. Human antibodies
With an aim of avoiding reverse immune reactions witnessed with murine, chimeric and humanized antibodies, human antibodies arose. Three production methods are currently in use: phage display, transgenic mice and human B lymphocytes.
For such biopharmaceuticals, the suffix “-umab” is added to the name.
c) Structure of antibodies
Antibodies are glycoproteins belonging to the immunoglobulins superfamily. They are produced by B lymphocytes and secreted into plasma.
Each antibody consists of two identical heavy chains and two identical light chains linked together by disulfide bonds:
- Each heavy chain includes 1 variable region and 3 constant regions of a total mass of 50kDa - Each light chain includes a constant and a variable region of a total mass of 25kDa
An entire monoclonal antibody thus weights 150kDa on average. The combination of the four peptide chains leads to its characteristic tridimensional “Y” shaped structure (Figure 5). The association of a variable domain carried by a heavy chain (VH) and the adjacent variable domain carried by a light chain (VL) forms the recognition site of the antigen (or paratope).
14 Figure 5: Basic antibody structure (Sigma Aldrich, 2015)
Within each variable region are present 3 CDRs composed of 5 to 10 amino acids, which represent hypervariable regions possessing a sequence complementary to the antigen’s epitope. An immunoglobulin presents therefore 2 sites (Fab) dedicated to antigen binding.
Furthermore, the amino acids sequence of the constant region is similar from an antibody to the other, with still enough peculiarities to allow a classification in 5 classes (or isotypes) in mammals: IgG, IgA, IgM, IgE and IgD. These constant regions are not involved in the antigen recognition but bear effector functions and enable antibodies to interact for instance with complement system or immunity cells.
B/ PROTEIN N-GLYCOSYLATION
Glycosylation is the most versatile and one of the most abundant post-translational modification. It corresponds to the process by which oligosaccharides covalently link to membrane or secreted proteins, forming glycoproteins. The majority of proteins synthetized in the rough endoplasmic reticulum undergo glycosylation. This multistep enzymatic addition takes place in the Endoplasmic Reticulum (ER) and the Golgi apparatus of eukaryotic cells. In the ER, mannose and glucose are added or removed but there is no specific addition of glycan structures. Once folded in the ER, proteins are transported to the Golgi apparatus, where specific glycan structures are added onto a protein depending on the protein sequence.
Glycosylation is part of proteins’ maturation and can have a major role in their functions. There are several types of glycosylation, N-glycosylation and O-glycosylation being the most common.
N-glycans are named according to the amino acid supporting the sugar moieties: Asparagine (N). The “O” in O-glycans refers to the O of the lateral chain of a Ser/Thr residue supporting the sugar moieties.
N-glycosylation is a multistep process. First, a small branched-chain of sugar is added to the target protein via a covalent link between the hydroxyl (-OH) of a sugar’s N-acetylglucosamide and the amide (CO-NH2) of the protein’s Asparagine residue (Figure 7). The bond formed is called N-glycosidic, hence the term “N-glycosylation”.
15 Figure 7: N-glycosidic bond –in red (Université Paris VI, 2014)
The reaction generating this bond is controlled by an enzyme called glycosyltransferase, found in the ER lumen. The oligosaccharides are initially carried by a dolichol –a lipid specifically present on the internal face of the ER membrane. They are then transferred by the glycosyltransferase on the polypeptidic chain during synthesis in the cytoplasm (Figure
8
). This is why N-glycosylation only affects membrane or secreted proteins, both having to cross this membrane.Figure 8: Process of N-linked glycan construction in the ER (Sigma Aldrich, 2015)
The initially added glucidic chain containing 14 sugars is modified during its path through Golgi apparatus (Figure 9). The converted oligosaccharide is then transferred from the dolichol precursor to the Asparagine of the target protein by the oligosaccharyltransferase (OST).
Complex oligosaccharide Mannose-rich oligosaccharide or
16 The addition only occurs on Asparagine residues belonging to the consensus sequence Asn-X-Ser/Thr –X being any amino acid except for Proline. Other factors that trigger actual glycosylation of these sites are to be considered, e.g. protein structure or cellular type in which it is produced. Asn-mutated glycoproteins get trapped in ER/Golgi and are often misfolded. They can then form disulfide bonds with each other, producing aggregates.
There are many cross-roads during N-glycan biosynthesis at which several enzymes compete for a same substrate. The relative activities of the competing transferase essentially direct the route taken by the synthetic pathway. On the other hand, some glycosyl residues act as a “stop” signal in the synthetic pathway and thus prevent further branching. For instance, insertion of a bisecting GlcNac inhibits the activity of α3,6-mannosidase II, core α6-fucosyltransferase and of GlcNac-transferases II, IV and V (H. Schachter, 1986).
Three major categories of N-glycans are defined: high-mannose, hybrid and complex (Figure 10). Figure 10: The three major categories of N-glycans
High-mannose Hybrid Complex
C/ GLYCANS NOMENCLATURE
Figure 11 displays the four most abundant glycans in mAb biopharmaceuticals (Immunogenetics, 2013). The human glycans are mainly bi-antennary structures with a core fucose.
M5 FA2 FA2G2 FA2G1
Gal: galactose / Man: mannose / Fuc: fucose / NANA: N-acetylneuraminic acid / NGNA: N-glycolylneuraminic acid / GlcNac: N-acetylglucosamine
Figure 11: Most abundant glycans in mAb biopharmaceuticals using the nomenclature adapted from Glycobiology 2009, 19: 1547-1553
17 Figure 12: Code for glycan nomenclature and N-glycan core structure
The N-glycan core structure is made up of two N-acetylglucosamine and three mannose units. To name the species, additional residues present on the oligosaccharide (and their respective number and potential position) are specified using the code depicted in Figure 12.
Figure 13: Examples for glycan nomenclature
A more detailed explanation of the glycan nomenclature is proposed in Annex 1.
D/ IMPORTANCE OF GLYCOSYLATION
All cells of all organisms are covered with abundant glycans, of which compositions significantly differ and can impact specific biological and physicochemical phenomena. The major residues found in therapeutic proteins and their impact on human health are further depicted in this section.
a) Fucose (Figure 14) –cancer and ADCC
Oligosaccharides derived from human (or Chinese Hamster Ovaries) IgG are mostly core fucosylated. Fucosylation has been identified as one of the most important oligosaccharide modification involved in cancer and inflammation (E. Miyoshi, 2012). Hence, fucosylated proteins are widely used as cancer glycol-biomarkers –e.g. fucosylated α-protein in hepatocellular carcinoma diagnosis.
Fucose-deficient proteins also enhance antibody-dependent cellular cytotoxicity (ADCC), thus improving the immune response.
18 Figure 16: Galactose structure
Figure 15: ADCC mechanism
ADCC is a major mechanism triggered by therapeutic antibodies and enabling tumor cells to be killed by macrophages (phagocytosis) or natural killer cells (cytolysis) through the interaction of the CH3 region of the mAbs with FcγRIIIa (a class of Fc receptor) expressed by both effector cells (Figure 15).
b) Galactose (Figure 16) –inflammation
In rheumatoid arthritis, a reduction in the galactosylation of terminal N-acetylglucosamine is associated with increased inflammatory activity through complement activation.
c) Mannose (Figure 17) –HIV
The envelope protein (gp120) of HIV-1 is one of the most heavily glycosylated protein in nature, with a particularly rich composition in high mannose. On one hand, these glycans provide a natural barrier for production of massive antibody response to the virus, but on the other hand it represents a potential site of attack by the innate immune system through the Mannan Binding Lectin (MBL). It has been reported that MBL binds to HIV thanks to the high-mannose glycans on gp120, leading to a direct neutralization of the virus produced in T cells (X. Ji, 2005). As a consequence of reduced interaction with CD4, cell infectivity and cytopathicity are also impaired.
19 Figure 21: Alpha Gal structure
d) Sialic acids (Figure 18, Figure 19) –immunity and serum half-life Figure 18: NANA structure
N-acetylneuraminic acid (NANA) and N-glycolylneuraminic acid (NGNA) respectively shown in Figure 18 and Figure 19 are two sialic acids.
In IgG-Fc, less than 10% of the oligosaccharides are sialylated. The neutral oligosaccharides thus predominate largely, only sialic acids being charged.
Figure 19: NGNA structure
Many viruses and some bacteria use host-sialylated structures as targets for binding and recognition. For instance, hemagglutinin –a surface protein of Influenza virus, binds to sialic acids of the cell it infects, which triggers a conformation change allowing in fine the virus to enter the cell. Sialic acids are critical factors for plasmatic clearance as well, by shielding glycoproteins from uptake via the asialoglycoprotein receptor (Figure 20). Asialoglycoproteins are therefore quickly cleared by the liver.
Figure 20: Sialylation and ASGP receptor (New England Biolabs, 2015)
e) Gal-α-1,3-Gal structures (Figure 21)
Gal-α-1,3-Gal (or alpha Gal) is a non-human cell membrane carbohydrate found in most organisms. It has been suggested to play a role in an IgE-specific delayed anaphylactic response to mammalian food products (S. Commins, 2012).
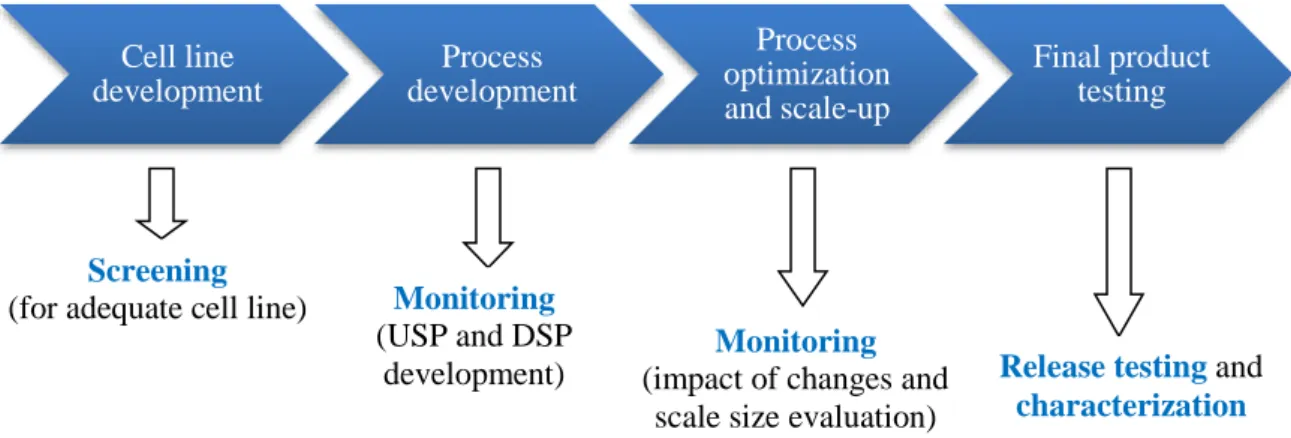
20 Figure 22: Glycosylation analysis at all stages of the product’s life cycle
Cell line development Process development Process optimization and scale-up Final product testing f) Conclusion
A Critical Quality attribute is defined as a chemical, physical, biological or microbiological property or characteristic that should be within an appropriate limit, range or distribution to ensure the desired product quality (ICH Q8 R1).
Glycosylation is thus a Critical Quality Attribute for some monoclonal antibodies and needs to be monitored at all stages of the product life cycle (Figure 22).
Biopharmaceuticals’ specific glycosylation parameters to be thoroughly monitored along the process development include:
- Abnormal high mannose structures - Fucosylation
- Galactosylation
In addition, the in-vitro antibody bioactivity should be regularly assessed and the antibody-induced effector functions characterized.
Screening
(for adequate cell line) Monitoring (USP and DSP
development)
Monitoring (impact of changes and
scale size evaluation)
Release testing and characterization
21 Ov er n ig h t in cu b ati o n DNA se q u en ce r
III/ Materials and methods
A/ CGE-LIF –MATERIALS AND METHODS
a) IntroductionCapillary Gel Electrophoresis with Laser Induced Fluorescence represents a rapid and high-resolution separation tool, which after sequencing the human genome found one of its prime applications in the analysis of complex carbohydrate mixtures.
In glycoproteins, most of the oligosaccharides are attached via an N-glycosidic bond to Asparagine residues or via an O-glycosidic bond to Serine or Threonine residues. In this method only N-glycans can be detected.
Glycan isolation is based on the Papac procedure of glycans (D.I. Papac, 1998). The glycans are first released from the protein using an enzyme specific digestion, the Peptide N-Glycosidase F (PNGaseF) and labeled using a fluorophore: 8-aminopyrene-1,3,6-trisulfonic acid (APTS) to allow sample detection. A DNA sequencer is employed to analyze the samples, using an internal DNA standard for calibration.
Figure 23 summarizes the steps required to perform a CGE-LIF analysis. Figure 23: CGE-LIF schematic outline
RCM DTT + IAA PVP PNGase SpeedVac APTS + PB
Ultrapure water Ultrapure water
b) Step-by-step method overview
A MultiScreen 96-well assay system with a high protein-binding Polyvinylidene Fluoride (PVDF) membrane is used in this method. This membrane presents the advantage of acting as a concentration device, allowing the use of diluted solutions to capture proteins. Thanks to a vacuum manifold integrated to the system, unbound components are washed from the wells. After a methanol activation of this hydrophobic membrane (methanol being an organic solvent miscible with water, it allows protein adsorption) the following operational stages are carried out:
Sample denaturation Reduction and alkylation Membrane blocking Glycan release Glycan recovery and drying Glycan labelling Data processing via GlyXtool
Day 1
Day 2
Day 3
Labelling reaction stopping Glycans dilution Glycans + DNA-Liz + Hi-Di mix22 Sample denaturation with a RCM (Reduction and S-Carboxy Methylation) buffer containing Urea, Tris and Titriplex (EDTA). Peptides undergoing denaturation lose their native structure (quaternary, tertiary, secondary) but keep their disulfide bonds (Figure 24).
Figure 24: Protein denaturation
S-S bond reduction with dithiothreitol (DTT), rendering glycans accessible to restriction enzymes. This reduction consists in two sequential thiol-disulfide exchange reactions (Figure 25).
Figure 25: Reduction of a disulfide bond by DTT
Addition of an alkylating sulfhydryl agent (IAA) covalently binding to free sulfides (Figure 26). Disulfide bridges having a marked liability to reform, the protein sample has to be treated with IAA to prevent S-S bonds from reforming.
Figure 26: Alkylation of a disulfide bond by IAA
Outer parts of the glycans blockage with Poly Vinyl Pyrrolidone (PVP) in order to avoid non-specific signals (Figure 27).
23 Figure 27: Papac procedure of glycans (D.I. Papac, 1998)
Glycan release induced by PNGase F, an amidase that cleaves between the innermost GlcNAc and Asparagine residues of high mannose, hybrid, and complex oligosaccharides from N-linked glycoproteins (Figure 28).
Glycan recovery and drying using a SpeedVac
Drying is essential in order to avoid some unspecific products of degradation which can occur in the mixture during the storage at -20°C and also to avoid losing overall intensities of the peaks.
Reductive amination-based APTS labeling using 20mM APTS in citric acid 3.6M and 0.2M 2-picoline borane in DMSO as a nontoxic reducing agent. In the reductive amination process, the amine group of the label reacts with the reducing-end aldehyde group of the oligosaccharide (an open ring in acidic conditions) to form a Schiff base, which is reduced to a secondary amine (Figure 29).
24
Reductive amination:
• Sugar reducing ends only, excellent sensitivity • One step reaction
• Efficiency over 90% under optimized conditions (reagent concentration, time, temperature, pH, solvent)
• Non-selective: uniform labelling for most structures • Easy quantification: one fluorophore per sugar molecule • Mild enough reaction to avoid loss of sialic acid and fucose
Injection on DNA sequencer ABI 3130xl
Samples are injected on the ABI 3130xl DNA Sequencer containing 16 neutrally coated fused-silica capillaries
of
50cm length, allowing simultaneous injection of 16 samples. This high throughput technique enables 96 samples to be analyzed in 6 hours. A software called GlyXtool provided by GlyXera GmbH is used to treat the data of the sequencer.Before the injection, a solution of glycans is mixed with DNA in Hi-Di (deionized formamide required for DNA ladder denaturation). This loading agent is de-ionized so as to avoid competition of ions for injection as it would be the case if using water.
This electrokinetic injection allows for glycan separation according to their mass, shape and charge (electrophoretic separation). Cathode is positioned below the polymer delivery pump while anode is found at the bottom of capillaries (Figure 30). With a high resolution, different N-oligosaccharides species are separated depending on the ratio of mass, shape and charge of their sugar residues. Only negatively charged molecules migrate through the capillary; their amount depends on the injection voltage and injection time.
Hence, the most charged glycans –i.e. highly immunogenic sialylated ones, elute early whereas large ones (tetra-antennary) have higher retention times. The APTS dye contains three negative charges and is added in excess, thus the large peak in the beginning of each electropherogram corresponds to its free form. The capillaries are filled with a cross-linked polymer solution (POP-7TM) whose sieving properties induce a separation of position isoforms (e.g. FA2[3]G1 and FA2[6]G1) on top of the charge-to-mass separation. POP-7TM coats the capillary wall to control electro-osmotic flow; it also contains high percentage of urea, which denatures the oligonucleotide –a process aided by heating the capillary at 30°C.
Figure 29: Reductive amination using APTS and PB
25 Figure 30: DNA sequencer 3130xl interior
Calibration is performed using an internal standard containing Liz dye-labeled, single stranded DNA fragments. The equipment can work with 5 different wavelengths at the same time. In CGE-LIF the excitation/emission wavelengths are 488/512 nm for APTS and 638/655 nm for Liz. Therefore there is no interference between the glycan signal and the DNA signal.
Data processing using Matlab-based GlyXtool
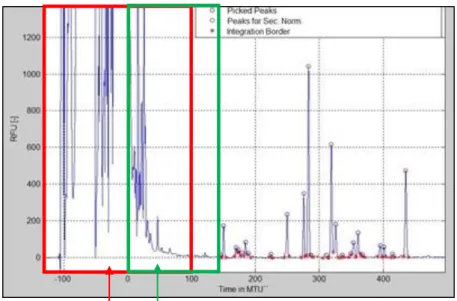
Data processing can be carried out using Matlab-based GlyXtool software (Figure 31). To build the DNA Liz standard curve, the 75 to 500 base pairs (bp) peaks are considered, 250 bp is excluded because of an increased variability in its migration time. A first normalization helps us build the calibration curve linking migration data points and base pairs numbers. Due to inter assay shifts in migration times and with an aim of harmonizing results between different equipment, labs and runs, an internal second normalization is performed by choosing the sample’s 4 major peaks (Figure 32). Results are only taken under consideration for a given sample if the absolute peak height of the major peak is above 400 Relative Fluorescence Units (RFU), because an increased variability has been reported in samples with low-intensity peaks.
26 Figure 32: Data processing via Matlab-based GlyXtool
DNA ladder injected with each glycan preparation First Calibration data points to DNA base pairs normalization
Product’s own glycans used for second normalization (generally its four major peaks, here circled in red)
Glycan identification and quantification Glycan identification by comparison to a reference profile. Each glycan elutes at a defined migration time in a given therapeutic protein.
Data processing using Java-based GlyXtool
A new version of the GlyXtool software based on Java (Figure 33) instead of Matlab was also used to treat the data of the sequencer. The main change lies in the fact that second normalization is performed using 4 oligosaccharides of different size, charge and shape spiked in each sample (“external” second normalization) instead of the product’s own 4 major glycans (“internal” second normalization).
Product’s glycans Base pairs Da ta p o in ts Second normalization
27 This external second normalization is meant to facilitate data processing, partly through the use of identical second normalization settings for every sample.
Figure 33: Java-based GlyXtool interface
Figure 34: Data processing via Java-based GlyXtool
DNA ladder injected with each glycan preparation First Calibration data points to DNA base pairs normalization
Second normalization
4 spiked oligosaccharides used for
second normalization (here circled in blue) Glycan identification and quantification
Glycan identification by comparison to a reference profile. A given glycan always elutes at the same migration time.
28 The data obtained for each glycan after Matlab or Java-based GlyXtool processing are the following:
- Migration time in base pairs - Peak height in RFU
- Cumulative peak height (% peak abundance, relative to the total height of all the peaks of interest)
- Normalized peak height (% peak abundance, based on the height of the major peak)
Thanks to already established reference profiles (Annex 2), glycans present in known molecules can be identified due to their normalized migration time. % Cumulative peak height is used to compare results in the different tests conducted. Using cumulative peak height rather than normalized peak height enables to monitor changes in the major peak, the latter being always 100% in normalized results.
B/ COMPLEMENTARY GLYCAN MAPPING METHOD: 2-AB UHPLC
2-AB UHPLC (2-AminoBenzamide Ultra Performance Liquid Chromatography) is a glycan mapping method complementary to CGE-LIF. In this report, 2-AB UHPLC was used to co-validate CGE-LIF results of some of the tests performed.Figure 35 summarizes the steps required to perform a 2-AB UHPLC analysis.
Glycosylated proteins Denaturated proteins
Denaturation & Reduction
Free glycans
Immobilization & Digestion
Labelled glycans
Glycan labelling
Glycan separation by HILIC-UHPLC
1. Guanidine hydrochloride + TCEP (100 °C, 30 min) 2. IAA (RT, 30 min) 100°C N-glycanase 37°C, 1h 2-AB , NaCNBH3 56°C, 1h Chromatogram
29 2-AB UHPLC was performed using GlykoPrep™ kit and a Bravo Assay Map robotic station, enabling a semi-automatic sample preparation. The Bravo robot is a liquid handling platform combined with a pipetting head designed specifically to process 96 samples at the time on a GlykoPrep™ kit.
The technical features of the 2-AB UHPLC and CGE-LIF methods are further depicted and compared for each major step of the analytical procedure in Table 1.
Table 1: Method steps for CGE-LIF and 2-AB UHPLC
Method step CGE-LIF 2-AB UHPLC
Protein denaturation Capture on PVDF membrane, denaturation by DTT
Denaturation using Guanidine hydrochloride
Glycan release Enzymatic by PNGase F (2h, 37°C) Enzymatic by PNGase F (1h, 37°C) on RX cartridges (hydrophobic interaction) Glycan purification No purification step Purification on RX cartridges
Labelling
Fluorophore: APTS in presence of picoline borane (PB)
Chemistry: reductive amination, APTS provides 3 charges per N-oligosaccharide Conditions: 16 hours at 37°C
Florophore: 2-AB in presence of NaCNBH3
Chemistry: reductive amination, no charge brought by 2-AB
Conditions: 1 hour at 56°C
Free label clean up No clean-up Clean-up on CU cartridges (HILIC) Injection mode Electrokinetic By syringe, exact volume
Separation mode Capillary gel electrophoresis (CGE)
Hydrophilic interaction chromatography - ultra-high performance liquid
chromatography (HILIC-UHPLC) Run time 60 min run time (16 samples) 77 or 95 min run time (1 sample) Detection mode Laser induced fluorescence
APTS 488/512 nm
Fluorescence 2-AB 365/416 nm Calibration of the
migration time Two successive calibrations No calibration
N-oligosaccharides
quantification mode Relative peak height Relative surface area
Unlike the sample preparation for CGE analysis, the protein denaturation and reduction are performed in liquid phase. The use of a semi-automated solution for 2-AB UHPLC reduces the variability as compared to the sample preparation of CGE-LIF which is manual.
The glycan separation is done by HILIC UHPLC on a 100mm column packed with amide-functionalized microbeads. An acetonitrile and 120mM ammonium formate gradient is applied to separate the N-oligosaccharide species. The retention time of each labeled oligosaccharide is driven by its content of polar groups.
Glycan separation on a 100mm column takes either 77 or 95 minutes per sample (6 days for 96 samples). This step represents a bottleneck for the glycan mapping by 2AB-UHPLC.
2-AB UHPLC provides detailed profiles and is traditionally applied for characterization purposes while CGE-LIF, thanks to its higher throughput and precision, is the method of choice for supporting process development, scale-ups and technological transfers.
30
C/ THERAPEUTIC PROTEINS ENCOUNTERED IN THE TESTS
The therapeutic proteins used to monitor eventual changes in glycan distribution during the CGE-LIF tests for method improvement belong to three different classes:
- Interferon: Sample U
- Monoclonal antibodies: Sample V, Sample Y and Sample Z - Fc-fusion proteins: Sample W, Sample X
D/ STATISTICAL METHODOLOGY
When performing statistical tests, the following approximations were applied:
- The hypothesis is made that the concerned group of data presents a normal distribution. Verifying data normality would actually require a larger amount of data than generally available (about thirty independent data). Our prior knowledge of the considered method is used to assess whether the distribution is normal or not.
- Some of these tests are applied to a number of data in principle too small to obtain a sufficient statistical power for the test. It is important to consider that the statistical tests displayed here are tools in the evaluation, and that it is preferable to consider them with a critical spirit, keeping their limitations in mind.
When comparing two methods the purpose is to make sure the results obtained with the two methods are comparable in terms of precision and accuracy.
Selected samples for method comparison also must be representative of all of the samples that might be analyzed in routine.
A 2-sample t-test is employed to compare data considering independently the data generated in different analytical analyses and the ones generated within the same analytical analysis (preparation replicates) so as to gather sufficient data for statistical calculations. The accuracy of the method is evaluated by comparing the mean values obtained for both of the methods. The 2-sample t-test is employed with a H0 hypothesis stating that the means from the methods do not differ. If the test generates a p-value lower than 5%, it means that the means differ significantly. The extent of the difference revealed by the 2-sample t-test is then discussed in order to evaluate if this difference is acceptable from an analytical perspective. Ratio and delta calculations (ratio and absolute difference between the two methods’ means) are usually used to build upon this discussion.
A fully nested ANOVA is used to determine the intermediate precision of the method. This test also allows an evaluation of the two elements composing this intermediate precision: repeatability (within the same analysis) and inter-assay variability. Variability obtained for the two methods are then compared to make sure that their order of magnitude is the same.
A factor is nested within another factor when each category of the first factor co-occurs with only one category of the other. When running a fully nested ANOVA it is crucial to select factors in hierarchic order. In the tests performed here, analysis identification was selected first, then replicate identification.
Contributions to variability are expressed in percentage of total variance and also in standard deviation (STDEV) attributed to each factor. Then a coefficient of variation (CV%) is calculated:
𝐶𝑉% = 100 × 𝑆𝑇𝐷𝐸𝑉
31
IV/ Resolution improvement
A/ INTRODUCTION
Co-eluting peaks represent a major concern in CGE-LIF method, especially in the context of stringent biosimilar specifications, preventing quantification of each glycan separately. Co-elution occurs when two or more glycans happen to elute at migration times that cannot be resolved by the analytical method applied. The lack of resolution is possibly induced by insufficient capillary length, or not adjusted run settings. The most interesting non-resolved peak to separate was M5+FA1+FA2G2S[6]1NGNA –present in samples X, Y and Z and which represents a hurdle in the biosimilar projects.
According to the supplier of the capillary array, increasing capillary length should improve the resolution. This section describes the tests performed using an 80 cm capillary array and compares the profiles with the ones obtained with a 50 cm capillary array currently employed in CGE-LIF routine analyses.
B/ MATERIALS AND METHODS
Three samples were analyzed: samples X, Y and Z.Three capillary lengths are available for the 3130xl Genetic Analyzer: 36, 50 (currently in use for routine samples) and 80 cm. Table 2 summarizes the specifications associated to each capillary length (the setup for the 50 cm capillary used in the lab and the 80 cm used for the tests appear in blue and purple, respectively).
Table 2: Sequencing resolution performance and specifications –3130xl Genetic Analyzer
Type of run Capillary
length (cm) Polymer type
Run Time (min) inc. data collection
Ultra rapid 36 POP-4
TM 40 POP-7TM 35 Rapid 36 POP-6 TM 60 POP-7TM Fast 50 POP-7TM 60 Standard 50 POP-4TM 100 POP-6TM 150 POP-7TM 120
Long read 80 POP-4
TM 210
POP-7TM 170
Before conducting a test using the 80cm capillary array, spatial and spectral calibration steps are required. Spatial calibration has to be performed every time a capillary array is replaced. It helps locating the capillaries in space (each capillary emits a signal detected by the camera).
A spectral calibration is required because the capillary length will be changed. It creates a matrix used during a run to reduce raw data from the instrument to the 5-dye data stored in sample files. Here the Dye Set G5 from Applied Biosystems is used to generate the “multicomponent matrix” required when analyzing Liz-labeled DNA on the 3130xl Genetic Analyzer. The kit consists of one tube of matrix standard containing five specific sizes of DNA fragments labeled with a unique fluorescent dye. This standard only needs to be run once in order to generate a matrix file which is then applied to samples run under similar conditions. The data collection software for this instrument uses multicomponent matrix to automatically analyze the five different colored fluorescent dye-labeled samples in a single capillary.
32 Run settings were then modified according to Table 4.
Table 3: Run settings on 3130xl Genetic Analyzer
Run Settings Range Routine
(50cm) Comments
Oven temperature 18-65°C 30°C
Higher run temperature results in highly resolved peaks and less run-to-run variability but can affect sialic acids
Polymer filling volume 7300-38000 steps 7300 steps Depends on capillary length
Current stability 0-2000 µA 5 µA Maximum current variation during
electrophoresis
Pre-run voltage 0-15 kV 15 kV During the pre-run the instrument
checks all its components
Pre-run time 1-1000 s 200 s
Injection voltage 1-15 kV 7 kV Higher injection voltage and time
means higher amount of sample loaded
Injection time 1-600 s 10 s
Voltage number of steps 1-100 30 Voltage steps to reach the desired
value of run voltage
Voltage step interval 1-60 s 15 s
Data delay time 1-3600 s 100 s Time from the start of separation to
the start of data collection
Run voltage 0-15 kV 15 kV Final run voltage
Run time 300-14000 s 2820 s Duration of data collection
Table 4: Run settings in routine analysis (50 cm) vs test 1 to test 5 (80 cm)
C/ RESULTS
Instrument default settings for 80cm capillary were chosen for test 1, except for the oven temperature which was initially set at 60°C. This high temperature was feared to cause sialic acid degradation, so it was changed to 30°C. In the following tests (test 2 to test 5), injection time and voltage were varied in order to try and obtain the best separation possible with an intensity ensuring linear results. Increased injection time leads to increased peak intensity while a greater injection voltage enhances glycan separation. Higher injection voltage and time also mean higher amount of sample loaded.
Obtained results are displayed in Table 5. Run Settings Routine (50cm)
Test 1 (80cm default settings) Test 2 (80cm) Test 3 (80cm) Test 4 (80cm) Test 5 (80cm) Oven temperature 30°C 30°C 30°C 30°C 30°C 30°C
Polymer filling volume 7300 steps 8700 steps 8700 steps 8700 steps 8700 steps 8700 steps
Current stability 5 µA 5 µA 5 µA 5 µA 5 µA 5 µA
Pre-run voltage 15 kV 15 kV 15 kV 15 kV 15 kV 15 kV Pre-run time 200 s 300 s 300 s 300 s 300 s 300 s Injection voltage 7 kV 2.4 kV 2.4 kV 4.8 kV 9.6 kV 7.2 kV Injection time 10 s 20 s 40 s 40 s 30 s 30 s Voltage number of steps 30 40 40 40 40 40
Voltage step interval 15 s 15 s 15 s 15 s 15 s 15 s
Data delay time 100 s 1200 s 1200 s 1200 s 1200 s 1200 s
Run voltage 15 kV 14.6 kV 14.6 kV 14.6 kV 14.6 kV 14.6 kV
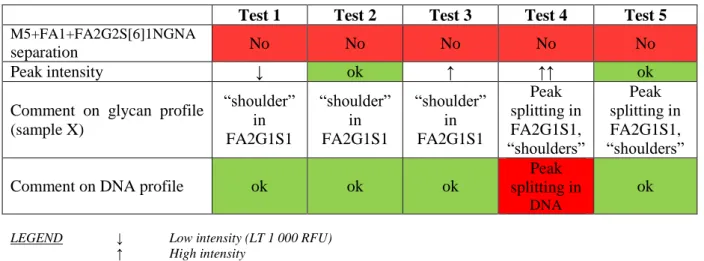
33 Table 5: 80cm capillary array –tests results
Test 1 Test 2 Test 3 Test 4 Test 5
M5+FA1+FA2G2S[6]1NGNA
separation No No No No No
Peak intensity ↓ ok ↑ ↑↑ ok
Comment on glycan profile (sample X) “shoulder” in FA2G1S1 “shoulder” in FA2G1S1 “shoulder” in FA2G1S1 Peak splitting in FA2G1S1, “shoulders” Peak splitting in FA2G1S1, “shoulders”
Comment on DNA profile ok ok ok
Peak splitting in
DNA
ok
LEGEND ↓ Low intensity (LT 1 000 RFU) ↑ High intensity
↑↑ Excessively high intensity (up to 10 000 RFU)
The tested electrophoretic parameters did not allow M5+FA1+FA2G2S[6]1NGNA separation in any of the 3 samples tested using any of the conditions described in Table 5.
A doublet peak appeared in FA2G1S1 for sample X (Figure 36), which does not correspond to the isomer of the glycan. The latter remains therefore unknown.
Figure 36: Peak shape of FA2G1S1 in a routine analysis and in the different tests
Routine analysis Test 1
Test 2 Test 3