Impact of Neonatal Total Parenteral Nutrition and Early Glucose-enriched Diet on Glucose Metabolism and Physical Phenotypes in Guinea Pig
par
Sara Najdi Hejazi
Département de Nutrition Faculté de Médecine
Mémoire présenté à la faculté des études supérieures en vue de l’obtention du grade de Maître ès Sciences (M.Sc.)
en Nutrition
Avril, 2012
c
faculté des études supérieures
Ce mémoire intitulé:
Impact of Neonatal Total Parenteral Nutrition and Early Glucose-enriched Diet on Glucose Metabolism and Physical Phenotypes in Guinea Pig
présenté par: Sara Najdi Hejazi
a été évalué par un jury composé des personnes suivantes: Dr. Geneviève Mailhot présidente-rapporteur Dr. Jean-Claude Lavoie directeur de recherche Dr. May Faraj membre du jury
Les oxydants infusés avec la nutrition parentéral (NP) néonatale induisent une mo-dification du métabolisme des lipides et du glucose, donnant lieu à l’âge adulte à un phénotype de carence énergétique (faible poids, baisse de l’activité physique). L’hypo-thèse qu’une diète précoce riche en glucose prévient ces symptômes plus tard dans la vie, fut évalué chez le cobaye par un ANOVA en plan factoriel complet à deux fac-teurs (p < 0.05) : NP du jour 3 à 7, suivit d’une nourriture régulière (chow) (NP+) vs. chow à partir du 3ième jour (NP-), combiné avec une eau de consommation enri-chie en glucose (G+) ou non (G-) à partir de la 3ième semaine. Les paramètres suivant ont été mesurés à l’âge de 9 semaine: taux de croissance, activité physique, activité de phosphofructokinase-1 et glucokinase (GK), niveau hépatique de glucose-6-phosphate (G6P), glycogène, pyruvate et potentiel redox du glutathion, poids du foie, glycémie, to-lérance au glucose, concentrations hépatiques et plasmatiques en triacylglycérides (TG) et cholestérol. Le groupe G+ (vs. G-) avait un taux de croissance plus bas, une activité de GK et une concentration en G6P plus élevée, et un potentiel redox plus bas (moins oxydé). Le niveau plasmatique de TG était moins élevé dans le groupe NP+ (vs. NP-). Les traitements n’eurent aucun effet sur les autres paramètres. Ces résultats suggèrent qu’indépendamment de la NP, une alimentation riche en glucose stimule la glycolyse et déplace l’état redox vers un statut plus réduit, mais ne surmonte pas les effets de la NP sur le phénotype physique de carence énergétique.
Mots-clés: Nouveau-né, nutrition parentérale, métabolisme du glucose, potentiel redox, programmation métabolique, cobaye, impact à long terme.
Neonatal exposure to oxidant molecules from total parenteral nutrition (TPN) alters future lipid and glucose metabolism, resulting in an energy deficient phenotype characte-rized by lower body weight and physical activity. Using a guinea-pig model, the hypothe-sis that early diet supplementation with glucose could overcome such symptoms at week 9 of age was tested in a two-factor full-factorial ANOVA design (p < 0.05): TPN day 3-7, chow thereafter (TPN+) vs. chow from day 3 (TPN-), combined with glucose-enriched diet from week 3 (G+) vs. plain chow throughout (G-). The growth rate, physical acti-vity, phosphofructose kinase-1 and glucose kinase (GK) activities, glucose-6-phosphate (G6P), glycogen and pyruvate concentrations, relative liver weight, fasting blood glu-cose, glucose tolerance, hepatic and plasma triacylglyceride and cholesterol levels, in-dividual glutathione levels and GSH/GSSG-based redox potential were determined at 9 weeks. Glucose supplementation (vs. the lack thereof) resulted in a lower growth rate, higher GK activity, and higher G6P concentration at week 9. Plasma triacylglycerides at week 9 were lower in TPN+ (vs. TPN-) subjects. Hepatic GSH/GSSG-derived redox potential shifted to a more reduced state in G+ (vs. G-) subjects. No other parameters showed significant differences. Independently of TPN, an early glucose-rich diet stimu-lated the glycolysis pathway, shifted the redox potential towards a more reduced status ; however, it did not overcome the effects of TPN on future physical and metabolic phe-notype.
Keywords: Neonates, total parenteral nutrition, glucose metabolism, redox po-tential, metabolic programming, guinea pig, long-term impact.
RÉSUMÉ . . . iii
ABSTRACT . . . iv
CONTENTS . . . v
LIST OF TABLES . . . vii
LIST OF FIGURES . . . viii
LIST OF ABBREVIATIONS . . . ix
DEDICATION . . . x
ACKNOWLEDGMENTS . . . xi
CHAPITRE 1 : LITERATURE REVIEW . . . 1
1.1 Concept of Developmental Programming . . . 2
1.2 Risk Factors in Postnatal Programming . . . 3
1.3 Oxidative Stress . . . 5
1.4 Total Parenteral Nutrition . . . 5
1.5 Total Parenteral Nutrition as a Source of Oxidant Molecules . . . 6
1.6 Glucose Metabolism Pathways . . . 7
1.6.1 Overview of Glycolysis Pathway . . . 8
1.6.2 Overview of Glycogenesis Pathway . . . 12
1.6.3 Overview of Pentose Phosphate Pathway . . . 13
CHAPITRE 2 : HYPOTHESIS AND OBJECTIVES . . . 16
2.1 Hypothesis . . . 16
2.2 Objectives . . . 16
2.2.2 Specific Objective . . . 16
CHAPITRE 3 : MATERIALS AND METHODS . . . 17
3.1 Materials . . . 17
3.2 Animal Model . . . 18
3.3 Experimental Set up and Design . . . 18
3.4 Analytical Measurements . . . 21
3.4.1 Physical Phenotype Determinations . . . 21
3.4.2 Clinical Phenotype Determinations . . . 23
3.4.3 Biochemical Phenotype Determinations . . . 25
3.4.4 Determination of Redox Status . . . 30
3.5 Statistical Analysis . . . 31 CHAPITRE 4 : RESULTS . . . 32 4.1 Physical Phenotypes . . . 32 4.2 Clinical Phenotypes . . . 34 4.3 Biochemical phenotypes . . . 38 4.4 Glutathione status . . . 38 CHAPITRE 5 : DISCUSSION . . . 44 5.1 Limitations . . . 50 5.2 Future Studies . . . 51 5.3 Conclusion . . . 51 BIBLIOGRAPHIE . . . 53
3.I 2041 Teklad Global High Fiber Guinea Pig Diet . . . 19 3.II TPN . . . 20
1.1 Major pathways of glucose in the body. . . 8
1.2 Glycolysis pathway. . . 9
1.3 Pentose phosphate pathway in the body in connection with redox cycle. . . 13
3.1 Guinea pig growth rate versus time. . . 21
3.2 The study timeline. . . 22
4.1 Growth rate during the 3rdto 9th weeks of age. . . 33
4.2 Physical activity at the 4th and 7th week of age. . . 33
4.3 Relative liver weight at the 9th week of age. . . 34
4.4 Blood glucose tolerance at the 8th week of age. . . 35
4.5 Fasting blood glucose at the 4thand 8thweek of age. . . 35
4.6 Plasma triacylglycerol at the 4thweek, b) Plasma triacylglycerol at the 9thweek, c) Plasma cholesterol at the 4thweek, and d) Plasma cholesterol at the 9th week of age. . . 36
4.7 Liver triacylglycerol at the 9th week of age. . . 37
4.8 Liver cholesterol at the 9thweek of age. . . 37
4.9 a) Glucokinase activity, and b) Phosphofructokinase-1 activity at the 9thweek of age. . . 39
4.10 Glucose 6-phosphate at the 9th week of age. . . 41
4.11 Glycogen at the 9th week of age. . . 41
4.12 Pyruvate content at the 9th week of age. . . 42
4.13 a) Glutathione (GSH), and b) Glutathione disulfide (GSSG) at the 9th week of age. . . 43
ATP Adenosine Tri-Phosphate BMI Body Mass Index
BSA Bovine Serum Albumin DNA Deoxyribo Nucleic Acid
DTT 1, 4-Dithiothreitol
EGTA Ethylene Glycol Tetraacetic Acid GI Gastro Intestinal GK Glucokinase GSSG Glutathione Disulfide GSH Glutathione G6P Glucose 6-Phosphate G6PH Glucose-6-Phosphate Dehydrogenase HNE 4-Hydroxy-2-Nonenal
NADH Nicotinamide Adenine Dinucleotide
NADPH Nicotinamide Adenine Dinucleotide Phosphate Oxidase NICU Neonatal Intensive Care Unit
OS Oxidative Stress PFK-1 Phosphofructokinase-1
RNA Ribonucleic Acid
ROS Reactive Oxygen Species TCA Trichloroacetic Acid
my beloved parents, brother, and dear husband for all their faith, support and love.
I would like to thank my supervisor, Dr. Jean-Claude Lavoie for his constant encoura-gement, support, availability, patience, kindness, honesty, and outstanding mentorship. Many thanks to all my colleagues at CHU Sainte-Justine Research Center, especially Mrs. Thérèse Rouleau and Wesam Elremaly for their never ending support and conti-nuous feedback. I am truly grateful to the University of Montreal and Nutrition Depart-ment staff. I would also like to thank the animal care staff at CHU Sainte-Justine Hospital for their generous efforts.
LITERATURE REVIEW
Premature birth occurs in 12.5% of deliveries in the United States and 8% in Canada (2006-2007) [1]. Many of these infants do not develop any prematurity problems since they are born only a few weeks prior to full term delivery; however, others are at risk of serious complications throughout their lifetime. For instance, infants born before 28 weeks of gestation are at high risk for chronic diseases such as diabetes and cardiovascu-lar disorders [2–9]. Epidemiological evidence demonstrates that a suboptimal gestational and postnatal environment, including nutrition, plays a key role in the associated increase of metabolic diseases observed in adults [10–13].
Infants born before 28 weeks of gestation cannot be fed enterally [3, 6, 7] due to the immaturity of their gastrointestinal tract [10–17]. Intravenous nutritive support - or total parenteral nutrition (TPN) - is therefore essential for their growth and development. Un-fortunately, TPN formulations are contaminated with oxidant molecules [18–21], mainly hydrogen peroxide (H2O2) [22]. Such peroxides are the end products of reactions
bet-ween oxygen dissolved in the TPN solution and various electron donors, such as ascor-bate, amino acids, and lipids [18, 19, 22–25]. Given that such reactions are catalyzed by photo-excited riboflavin, a vitamin present in TPN formulations [26, 27], protection against ambient light can halve the peroxide concentrations in TPN solutions [28]. Labo-rie S et al. observed that the use of TPN not afforded full protection from light was corre-lated with an increase in peroxide concentrations in the urine of premature infants [29]. Their observation suggests that this population is unable to quench this oxidant load, possibly as a result of their immature antioxidant defense system [29–34]. In the short-term, infusion of TPN or a solution bearing a similar quantity of peroxides during the neonatal period is associated with a perturbation of lipid and glucose metabolism [35]; however, the long-term impacts of delivering such oxidant molecules through TPN infu-sions remain unclear.
"The developmental origin of adult health and disease hypothesis" affirms that the origin of several adult metabolic diseases (e.g. cardiovascular diseases, type II diabetes, and hypertension) can be traced back to fetal and postnatal life [36–38]. In an animal model of neonatal parenteral nutrition, Kleiber N et al. demonstrated that early intrave-nous exposure to peroxides, as generated in this nutritive solution, induces permanent modifications in the metabolism of lipids and glucose later in life [35]. They sugges-ted that peroxides contaminating TPN solutions permanently modify the metabolism of energy, thus perturbing growth rate, physical activity, and metabolic responses later in life [35]. The phenotype of animals thus afflicted was one of energy deficiency [35].
Several studies support the notion that one mechanism by which postnatal nutrition affects the long-term outcome is developmental programming [9, 39]. Using a guinea pig model of neonatal parenteral nutrition, the present study was designed to investigate the long-term (eight weeks after ending TPN) effects of a 4-day neonatal exposure (Day 3 to 7 of life) to TPN, combined with an early diet enriched in glucose (Week 3 to 9 of life) on their glucose metabolism 8 weeks after stopping TPN (i.e., 9 weeks from birth). The introduction of glucose to the diet was intended to assess if high caloric nu-trient enrichment of the diet could overcome the energy deficiency previously observed by Kleiber N et al. [35].The following sections briefly explain the notion of develop-mental programming and oxidative stress observed in neonates in relation to parenteral nutrition.
1.1 Concept of Developmental Programming
The association between early life events and the development of adult diseases has recently become widely recognized [9]. This association is mainly attributed to the pro-gramming concept stemming from Barker’s hypothesis of "developmental origin of adult health and disease" [9]. Programming, or the modulation of the gene expression, repre-sents the ability to adapt to environments encountered during development [9]. Although
the short-term gains are adaptation to the environment, the long-term costs are permanent changes in the character of tissues [40] and in gene expression profiles [9].
1.2 Risk Factors in Postnatal Programming
Several risk factors hinder postnatal programming. One such factor is the infants’ size at birth. Barker has shown that there exists a causality between low birth weight and diseases that may generate adult coronary heart disease as well as metabolic disorders such as hypertension, type II diabetes, and hyperlipidemia [2, 4, 5, 8]. It is well establi-shed that the correlation between small birth size in neonates kept in the NICU (Neonatal Intensive Care Unit) and impaired glucose regulation later in life is much greater than that for individuals born at term [41].
The second factor is postnatal nutrition and dietary composition. Preterm infants are at risk of postnatal over-nutrition and rapid catch-up growth [39, 42]. Kashyap S et al. observed that high non-protein energy feeding of low birth weight infants resulted in a weight increase due to body fat rather than lean body mass [43]. However, high-protein diets may induce the proliferation of adipose formation and obesity later in life [44]. The Dortmund Nutritional and Anthropometric Longitudinally Designed Study (DONALD), a longitudinal study of 216 individuals, evaluated the associations between added sugar intake during early childhood and body mass index (BMI) and body fat at 7 years of age [45]. The study showed that while a higher total added sugar intake during the first year of age was correlated with a lower BMI at 7 years of age, the same added sugar intake during the second year of life was associated with a higher BMI at 7 years of age. However, no associations were observed with the percentage of body fat [45]. Kleiber N etal. demonstrated in guinea pigs the relation between early TPN and a decrease in level of plasma triglyceride later in life [35]. Various dietary regimens may likewise have an effect on organ development. Rat pups with high protein intake showed greater growth rate in the short term, as well as insulin resistance [46]. In the rat pups-in-the cup mo-del with high carbohydrate intake, alterations in adult metabolism, along with obesity,
were observed [47–54]. In this population, modification in individuals’ insulin secretory capacity increased hexokinase activity and insulin biosynthesis [47–54]. In this model, a high carbohydrate diet in early life augments the quantity of pancreatic islets [47–54]. Furthermore, evidence suggests that breastfeeding during the postnatal period prevents the development of metabolic diseases in full term infants. Later in life, breastfed infants have lower blood pressure, total cholesterol, and prevalence of overweightness and obe-sity [55–57].
The third risk factor is postnatal growth rate. It has been observed that in low birth weight infants, rapid postnatal growth rate over the first 4 months leads to a greater body weight later in life [58]. Animal studies have demonstrated the effect of postnatal growth rate in metabolic diseases. In the rat model, accelerated growth altered the metabolic pa-rameters in response to a high-fat diet, as well as increased weight and percentage of body fat [59]. These observations confirm the Lucas hypothesis of "accelerated growth", which illustrates the connection between faster early postnatal growth in preterm infants and an increased risk of the metabolic syndrome indicators [60, 61].
Another risk factor in programming is oxidative stress (OS). Oxidative stress pro-gramming occurs directly through the modulation of gene expression or indirectly through the oxidation of lipids, proteins, and DNA [62]. In preterm infants, oxidative stress may increase the prevalence of the metabolic syndrome, type II diabetes, and several other metabolic disorders later in life [35–38]. Kleiber N et al. have shown in the guinea pig model that exposure to oxidative stress early in life effects a permanent modification in the programming of lipid and glucose metabolism, resulting in energy deficiency obser-ved later in life [35]. Such modifications in the guinea pig animal model had long-term effects on the animals’ growth and physical activity [35].
1.3 Oxidative Stress
Reactive oxygen species (ROS) are byproducts of mitochondrial electron transport in the cellular respiratory chain. Moreover, they are inevitable byproducts of several cellu-lar and extracellucellu-lar redox reactions [62–64]; hence, they are constantly produced within the organism. In moderate concentrations, ROS regulates enzymes and redox-sensitive gene expression [63, 65, 66]. The antioxidant system sustains the homeostasis of ROS inside the cells.
Conversely, an imbalance between ROS load or its generation and antioxidant de-fenses within the cell, known as oxidative stress, can cause serious cellular damage. Superfluous amounts of oxidants may react with cellular macromolecules, thereby in-ducing lipid peroxidation and modifications of proteins and DNA [67, 68]. Biological activities generally decrease with the attack of oxidized products of ROS, resulting in metabolic dysregulation and an alteration in cellular signaling functions [43, 53]. Stu-dies have demonstrated that premature infants are more prone to oxidative stress due to environmental, biological, and nutritional conditions, such as early postnatal use of parenteral nutrition [18, 19, 22–24].
1.4 Total Parenteral Nutrition
Parenteral nutrition was first introduced in 1967 to human infants suffering from ex-treme short bowel syndrome [69]. Today, parenteral nutrition refers to the administration of supplemental intravenous nutrients via a continuous infusion through a peripheral or central vein [68]. Since it contains all the essential nutrients for metabolic requirements and growth, it was named total parenteral nutrition (TPN) [11, 70]. This intravenous so-lution includes glucose, amino acids, lipids, vitamins, and trace elements [11, 70]. In North America, TPN is administered without adequate light protection [71, 72].
1.5 Total Parenteral Nutrition as a Source of Oxidant Molecules
Silvers KM et al. showed that exposure to light decreases the levels of antioxidant vitamins (i.e. vitamins A, C, and E) in the TPN solution [25]. The absence of full photo protection also increases or catalyzes the generation of byproducts of nutrient oxida-tion such as hydrogen peroxide (H2O2) [19], lipid peroxides [18], as well as aldehydes,
especially 4-hydroxy-2-nonenal [24], and ascorbylperoxide [23]. These products are ge-nerated by a reaction between oxygen dissolved in the solution and different electron donors such as ascorbate, amino acids, or lipids [20, 21, 73]. Lavoie JC et al. demons-trated that the H2O2 represents approximately 80% of the total peroxides generated in
TPN solutions [22]. Given that ascorbate is the prime electron donor, the main source of peroxides is the multivitamin preparation [22, 26, 27]. Furthermore, multivitamin prepa-rations used in parenteral nutrition also contains riboflavin, a photo-sensitive component which acts as a catalyst in the photo-oxidation of nutrients [26, 27]. Lavoie JC et al. sho-wed a rise in urinary peroxide concentration in newborn premature infants who received TPN exposed to light [29]. The study confirms premature infants’ incomplete capacity to scavenge peroxides [29]. This fact may be related to the immaturity of the antioxidant defenses of preterm newborns. Indeed, several studies have demonstrated that newborn antioxidant defenses increased in function of the age of gestation. Frank L et al. [74, 75] showed that activities of antioxidant enzymes such as catalase, glutathione peroxidase, and superoxide dismutase increase in the last trimester of gestation. Lavoie JC et al. [76] reported that the level of glutathione, the key antioxidant molecule, is directly propor-tional to the gestapropor-tional age. Therefore, this population is more prone to oxidative stress due to the high oxidant load from TPN and their low antioxidant levels.
The impact of oxidative load from TPN cannot be adequately studied in premature infants since appropriate control group, premature infants (<28 weeks of gestation) wi-thout TPN, does not exist. Therefore, only a reduction of peroxides in TPN by light protection can be done. However, light protection is difficult in clinical situations. The few scientific teams who have studied the impact of oxidants infused with TPN have
reported that the absence of light protection is associated with higher oxidative stress in premature infants [27, 28], lower plasma triacylglycerol and blood glucose [35], lower arterial blood pressure [77], and higher incidence of chronic lung diseases [27] in the short term. No data is available on the long-term impact of light protection of TPN in humans.
The guinea pig model of neonatal TPN has been developed in our laboratory to study the impact of TPN compared to a control group without TPN. Several studies with this animal model reported that TPN is related to oxidative stress in the lungs, blood and li-ver [27, 28, 78, 79], hepatic steatosis [28], and higher plasma triacylglycerol levels [80]. One study demonstrated that the administration, in the first week of life, of either TPN or a solution of H2O2at a concentration equivalent to the total peroxides measured in the
TPN, both induced a perturbation of energy metabolism 12 to 13 weeks after cessation of the infusion [35]. Compared to control groups, without TPN or peroxides, animals infused with TPN or peroxides had a lower plasma triacylglycerol level, a lower glucose tolerance, a lower body weight, and a lower propensity to spontaneous activity. We can conclude from this study that TPN induced an energy deficiency later in life [35].
Following these observations in the guinea pig system, the present research with this animal model was designed to explore the impact of a diet enriched in glucose, as a sup-plemental source of calories, on glucose metabolism and physical phenotypes 8 weeks after that the administration, or not, of TPN during their first week of life. The next sec-tion provides an overview of glucose metabolism.
1.6 Glucose Metabolism Pathways
Carbohydrates such as glucose are important parts of our diet. Glucose is an impor-tant source of energy for body cells. In animals and humans, glucose has three main fates (figure 1.1) [81]:
– It may be oxidized into pyruvate via the glycolysis pathway to provide ATP and metabolic intermediates if the body and cells need energy [81].
– It may be stored as glycogen via the glycogenesis pathway if the body has excess blood glucose [81].
– It may be oxidized via pentose phosphate pathway into ribose 5-phosphate for syn-thesis of nucleic acids and NADPH for reductive reactions, especially glutathione reduction [81].
FIGURE1.1 – Major pathways of glucose in the body (adapted from Lehninger C [81]).
1.6.1 Overview of Glycolysis Pathway
Glycolysis, the first and central pathway of glucose catabolism, was discovered in 1897 by Eduard Buchner [81]. In glycolysis, a molecule of glucose is degraded in a se-ries of enzyme-catalyzed reactions to yield two molecules of the three-carbon compound pyruvate. During these sequential reactions of glycolysis, some of the free energy relea-sed from glucose is conserved in the form of ATP and NADH. The breakdown of the
six-carbon glucose into two molecules of the three-carbon pyruvate occurs in ten steps, which can be categorized in two phases as illustrated in figure 1.2;
– The preparatory phase, in which glucose is phosphorylated and converted into glyceraldehyde 3-phosphate.
– The pay off phase, in which glyceraldehyde 3-phosphate is oxidized into pyruvate, while generating ATP and NADH.
To summarize, in the preparatory phase of glycolysis, the energy of ATP is invested, raising the free-energy content of the intermediates, and the carbon chains of all the metabolized hexoses are converted into a common product, glyceraldehyde 3-phosphate, while in the payoff phase the desired energy is released [81].
ADP Glucose 6-phosphate Glucokinase Glucose Fructose 6-phosphate Phosphohexose isomerase Fructose 1,6-bisphosphate Aldolase Glyceraldehyde 3-phosphate Phosphofructokinase-1 Dihydroxyacetone phosphate ATP 1 2 3 4 Glyceraldehyde 3-phosphate (2) + Troise phosphate isomerase 5 first priming reaction second priming reaction clevage of 6-carbon sugar phosphate
to two 3-carbon sugar phosphates Preparatory Phase Payoff Phase 2 ADP 2 1,3-Bisphosphoglycerate 3-Phosphoglycerate(2) 2-Phosphoglycerate (2) Enolase 2H2O 2 ADP ATP 2
first ATP forming reaction (substrate-level phosphorylation)
second ATP forming reaction (substrate-level phosphorylation) 6 2 Pi 2 NAD+ NADH + H+ 7 8 9 Phosphoenolpyruvate Pyruvate Pyruvate kinase Phosphoglycerate mutase Glyceraldehyde 3-phosphate dehydrogenase 2 oxidation and phosphorylation Phosphoglycerate kinase 10 Glyceraldehyde 3-phosphate (2) ADP ATP ATP
The rate of glucose metabolism is adjusted by a complex interplay between ATP consumption, NADH regeneration, and allosteric regulation of several glycolytic en-zymes, including hexokinase, phosphofructokinase-1 (PFK-1), and pyruvate kinase, and by second-to-second fluctuations in the concentration of key metabolites that reflect the cellular balance between ATP production and consumption [81]. Neonatal exposure to oxidant molecules has been noted to lead to permanent modification on the programming of glycolysis, resulting in metabolic diseases later in life [35, 81]. The most important modifications are lower phosphofructokinase activity, higher glucokinase activity, lower blood glucose, lower glucose tolerance and lower hepatic and plasma triacylglycerol concentrations [35]. Considering the origin of the "adult health and disease" hypothe-sis, such a metabolic modification early in life holds several consequences for metabolic disorders such as cardiovascular disease, type II diabetes and lower overall energy for growth and development later in life [36–38]. In the present study, the effects of neona-tal exposure to oxidant molecules, along with an early glucose supplementation, on the programming of glycolysis was investigated. To ascertain if glucose has entered the gly-colysis (vs. the glycogenesis or pentose phosphate) pathway, glucose 6-phosphate (G6P) and pyruvate levels, as well as glucokinase (GK) and phosphofructokinase-1 (PFK-1) activities, were measured. These glycolytic pathway catalysts are briefly discussed in the next few sections.
1.6.1.1 Glucokinase (Hexokinase IV))
GK is the first key enzyme in glycolysis. It catalyzes the phosphorylation of glu-cose substrate to gluglu-cose 6-phosphate (section 1.6.1.2). Glucokinase or hexokinase IV is the hepatocyte form of hexokinase, which differs from other forms of hexokinase in its kinetic and regulatory properties [82]. Such differences have the potential to fine-tune metabolic rates. For example, the sensitivity of glucokinase, an allosteric enzyme [82], to be inhibited by glucose 6-phosphate is different from that of other types of hexokinase present in other tissues [73, 81]. Glucokinase has a lower affinity for glucose than the other hexokinases. This enzyme plays a key role in the liver to maintain blood glucose homeostasis by removing blood glucose for its transformation into glycogen
(glycoge-nesis pathway) or pyruvate (glycolysis pathway), depending on the prevailing glucose concentration [73]. Kleiber N et al. demonstrated that GK activity during guinea pigs’ first 13 weeks of life were greater when these were exposed to neonatal oxidative stress caused by the oxidant load of TPN [35]. The present study focuses on the effects of neonatal exposure to oxidant molecules on GK activity at guinea pigs’ ninth week of life, and the effects of early glucose supplementation on this activity. In fact, one of the aims of the present study is to demonstrate the probable relation between early glucose supplementation and alteration of GK activity in animals exposed or not to TPN in their first week of life.
1.6.1.2 Glucose 6- phosphate
Glucose 6-phosphate is glucose molecule phosphorylated on carbon 6 [83]. This compound is very common in cells since almost the entire amount of glucose entering a cell becomes phosphorylated in this way [83]. Glucose 6-phosphate initiates all of the glucose metabolism pathways; glycolysis, glycogenesis, and the pentose phosphate pathway [81, 84]. The phosphorylation of glucose is catalyzed by the enzyme hexokinase in most cells and by glucokinase in liver cells.
1.6.1.3 Phosphofructokinase-1
PFK-1 is the next key enzyme in glycolysis. It phosphorylates fructose 6-phosphate to produce fructose 1,6-bisphosphate [81, 85]. It has an allosteric regulatory role in the body, thereby regulating the rate of glycolysis [81, 86–88]. Its activity increases when ATP for cell requirements is depleted, and is inhibited under high levels of ATP or fatty acids in the organ [81].
1.6.1.4 Pyruvate
Pyruvate is the final product of the glycolysis pathway, where one molecule of glu-cose breaks down into two molecules of pyruvate. Through glycolysis, energy is released ; however, further energy may be obtained upon the pyruvate entering one of two cycles :
(i) its conversion into acetyl-coenzyme A through the Krebs cycle or (ii) its conversion into oxaloacetate through the citric acid cycle. Measurement of pyruvate as the final pro-duct of the glycolysis pathway reveals the probability of the entrance of glucose into this pathway [81].
1.6.2 Overview of Glycogenesis Pathway
The storage of glucose in the form of glycogen in the liver and other body tissues occurs via a metabolic activity known as glycogenesis. In theory, it is defined as a pro-cess in which glucose molecules are added to glycogen chains. Glycogenesis is activated when the body is in a state of rest or during instances of high glucose levels in the blood. Insulin activates this process to reduce blood sugar levels [81].
Glycogenesis contains two main steps. However, similar to the other glucose meta-bolism pathways, initially glucose is converted into glucose 6-phosphate by the action of glucokinase. Then, glucose 6-phosphate is converted into glucose 1,6-bisphosphate by phosphoglucomutase and later into glucose 1-phosphate.
– The first step involves synthesis of UDP-glucose from glucose 1-phosphate in the presence of UDP-glucose pyrophosphorylase. A hydrolytic process converts pyro-phosphate to orthopyro-phosphate, making this step a non-reversible reaction [81, 89]. – Glycogen synthase catalyzes the linkage of the previously generated UDP-glucose
through a hydroxyl group in the glycogen molecule, forming α-1,4-glycosidic link. This binding requires a protein like glycogenin which contains the glycogen branching enzyme [81, 89].
In this study, the possibility of the entrance of glucose into the glycogenesis pathway is investigated through the measurement of glycogen levels.
Nonoxidative Phase Oxidative Phase Glucose 6-phosphate 6-Phosphogluconate CO2 Ribulose 5-phosphate Nucleotides, coenzymes, DNA, RNA Reduced glutathione 2 GSH GSSG Oxidized glutathione Precursors Fatty acids, sterols, etc. reductive biosynthesis NADP+ NADPH Ribose 5-phosphate transketolase, transaldolase NADP+ NADPH glutathione reductase glutathione Peroxidase 2H O2 H O2 2 Redox Cycle Pentose Phosphate Pathway
FIGURE 1.3 – Pentose phosphate pathway in the body in connection with redox cycle (adapted from Lehninger C [81]).
1.6.3 Overview of Pentose Phosphate Pathway
Althought glucose 6-phosphate is mostly converted into pyruvate through glycoly-sis, G6P may enter an alternative catabolic pathway known as the pentose phosphate pathway. This pathway (figure 1.3) contains two distinct phases: (i) the oxidative phase, where NADPH is generated, and (ii) the non-oxidative synthesis of pentose [81]. In the oxidative phase, two molecules of NADP+ are reduced to NADPH, using the energy from the conversion of G6P into ribose 5-phosphate (figure 1.3). The ribose 5-phosphate produced can be used in the synthesis of nucleotides and nucleic acids. Within cells that are not using ribose 5-phosphate for biosynthesis, the nonoxidative phase recycles six molecules of the pentose into five molecules of the hexose glucose 6-phosphate,
allowing continued production of NADPH and converting glucose 6-phosphate (in six cycles) to CO2[81, 90].
One of the most important uses of NADPH in cells is to prevent oxidative stress. It reduces glutathione (GSSG → 2GSH) via glutathione reductase, which converts reactive H2O2 into H2O through the action of glutathione peroxidase. This cycle is known as
the redox cycle and is illustrated in figure 1.3 in connection with the pentose phosphate pathway. In the absence of this cycle, H2O2would be converted into hydroxyl free
radi-cals, which can attack the cells. By maintaining a reducing atmosphere (a high ratio of NADPH to NADP+ and a high ratio of reduced (GSH) to oxidized (GSSG) glutathione), this cycle could prevent or undo oxidative damage to proteins, lipids, and other sensitive molecules [81, 90].
It was previously mentioned that TPN contains peroxides which may cause oxidative stress within the cells. Through the pentose phosphate pathway and NADPH production, the oxidative stress can be decreased by the reduction of glutathione. Glutathione is the main antioxidant within the cells, especially in the liver, and plays a key role in balancing the cellular redox potential. Therefore, given the importance of investigating the possibility of the entrance of glucose into the pentose phosphate pathway, glutathione levels were measured in the present study.
1.6.3.1 Glutathione
Glutathione is a tripeptide (L-γ-glutamyl-L-cysteinylglycine) and is found widely distributed and at high levels (0.1-10 mM) in body tissues, especially the liver (5-10 mM). It is one of the key antioxidant that prevents intracellular damage caused by reac-tive oxygen species such as peroxides and free radicals [91, 92]. Glutathione exists in the thiol-reduced (GSH) and disulfide-oxidized (GSSG) forms. In a healthy situation, more than 95% of total glutathione is in the reduced form, and less than 5% exists in the di-sulfide form. The ratio of GSSG/GSH increases during oxidative stress, and is therefore usually considered as its indicator. The concentrations of both forms (GSH and GSSG)
are important in the balancing of the redox potential within the cells. In fact, glutathione is considered as the buffer of the intracellular redox potential [90–92].
In the presence of glutathione peroxidase, GSH serves as an electron donor and is oxidized to its disulfide form (GSSG). Once oxidized, glutathione can be reduced back in the presence of glutathione reductase, using NADPH as an electron donor (fi-gure 1.3) [90–92].
HYPOTHESIS AND OBJECTIVES
2.1 Hypothesis
Previous studies on guinea pigs have shown that neonatal exposure to TPN indu-ced a perturbation of glucose metabolism, leading to a phenotype of energy deficiency characterized by a lower body weight and a more lazy state. We hypothesize that sup-plementation of diet, early in life, with a high energetic component such as glucose, will prevent modifications in body weight and spontaneous physical activity related to the neonatal infusion of TPN.
2.2 Objectives
2.2.1 General Objective
Assess the mechanisms by which oxidants from TPN contribute to modifications in the programming of glucose metabolism and how they affect health later in life.
2.2.2 Specific Objective
Assess the impact of neonatal exposure to TPN (first week of life) and early glucose supplementation (introduced in the third week of life) on the physical (growth rate and physical activity), biochemical (enzymatic activity of PFK-1 and GK, along with glucose 6-phosphate, glycogen and pyruvate concentrations), and clinical (relative liver weight, fasting blood glucose, glucose tolerance, triacylglyceride and cholesterol concentrations in the liver and plasma) phenotypes as well as on the glutathione defenses (levels of reduced glutathione (GSH), glutathione disulfide (GSSG), and calculation of the redox potential) in guinea pigs up to their ninth week of life.
MATERIALS AND METHODS
3.1 Materials
The chemicals that were used in this research study and their sources are presented in this section.
Tris-hydrochloride (Tris-HCl), ethylenediaminetetraacetic acid (EDTA), nicotinamide adenine dinucleotide phosphate (NADP), glucose 6-phosphate dehydrogenase (G6PD), ethylene glycol tetraacetic acid (EGTA), and 1,4-dithiothreitol (DTT) were provided by the Roche Diagnostics GmbH Co., Mannheim, Germany. Potassium chloride (KCl), magnesium chloride (MgCl2), glucose, D-fructose 6-phosphate (F6P), adenosine 50
-triphosphate disodium (ATP), triethanolamine, potassium fluoride (KF), and aldolase were purchased from SIGMA Life Science Co., Saint Louis, Missouri, USA. Isoflu-rane and saline were obtained from Baxter Corporation, Deerfield, Illinois, USA. 2-Mercaptoethanol was provided by BioRad, Hercules, California, USA and xylazine by Bayer Inc., Calgary, Alberta, Canada. Bovine serum albumin (BSA), ammonium sulfate ((NH4)2SO4), imidazole, methanol, sulfuric acid, and bis-tris were purchased from
Fi-sher Chemical, New Jersey, USA. Potassium hydroxide (KOH) and boric acid were pro-vided by J.T. Barker Analyzed Reagent Chemical, Austin, Texas, USA. Glyceraldehyde 3-phosphate dehydrogenase and trichloroacetic acid (TCA) were purchased from MP Biomedical LLC, Solon, Ohio, USA. Sodium hydroxide (NaOH) was provided by A&C American Chemicals Ltd., Saint Laurent, Quebec, Canada, and silver sulfate (Ag2SO4)
by Laboratoire Mat Inc., Quebec, Canada. Pyruvate was obtained from Dehringer Menn-hein GmbH, Germany and ketamine from Wyeth Canada, Inc. Markham, Ontario, Ca-nada.
3.2 Animal Model
In the present study, three-day-old guinea pigs were employed as a newborn animal model due to their adequate similarities to the human being. Guinea pigs have striking similarities to humans in terms of hepatic cholesterol and lipoprotein metabolism [93]. They responses to dietary factors, exercise, and oxidative stress undoubtedly mimic the human situation [93]. In addition, many of the mechanisms by which guinea pigs regu-late cholesterol and lipoprotein metabolism as a response to diet are analogous to those reported in clinical experiments [93]. These trends make them suitable for metabolic studies [93]. Moreover, guinea pigs experience rapid growth during the third trimester, can be weaned at the second day of age, and can also develop fatty livers during fetal life [93–95]. Therefore, they are appropriate models for developmental studies. Finally, an important corresponding characteristic of newborn guinea pigs and human neonates is their immature glutathione antioxidant defense systems [94], which makes guinea pig a suitable model for investigation of the effects of oxidative stress.
3.3 Experimental Set up and Design
The three-day-old male guinea pigs (n=13) were provided by the Charles River La-boratory, St. Constant, Quebec, Canada. The protocol of this study was approved by the "Institutional Committee for Good Practice in Animal Research of CHU Sainte-Justine Research Center, Montreal, Canada" in accordance with the guidelines of the "Canadian Council on Animal Care". Neonatal guinea pig catheter (1 Fr Silicone Tip, 74 cm 3 Fr Silicone, 2 Fixed Beads, SA1 Infusion Technologies) was fixed in the jugular vein of all guinea pig pups on their third day of life. The surgery to fix the catheters was done under anesthesia with 125 mg/kg-(body weight) ketamine and 10 mg/kg xylazine. The catheter was exteriorized in the scapular region. The circadian rhythm was adjusted to 12 hours light and 12 hours darkness. The room temperature was kept at 20◦C.
Animals were randomly assigned to two groups: Control and TPN.
regular solid chow (High Fiber Guinea Pig Diet 2041, Harlan Teklad Global, Wil-mington, DE) with 2.5 kcal/g (table 3.I) from the third day of life until the end of the study.
TABLE3.I – 2041 Teklad Global High Fiber Guinea Pig Diet Macronutrient Information
Nutrient Chow Diet
Energy1(kcal/kg diet) 2500
Carbohydrates2(g/kg diet) 369 (56% of energy) Fiber (g/kg diet) 150
Lipids (g/kg diet) 45 (16% of energy) Amino acids (g/kg diet) 183 (28% of energy) Methionine (g/kg diet) 2.9 Cyst(e)ine (g/kg diet) 2.7 Zinc (mg/kg diet) 86 Manganese (mg/kg diet) 134 Copper (mg/kg diet) 18 Iron (mg/kg diet) 265 Selenium (mg/kg diet) 0.21 Riboflavin (mg/kg diet) 94 Vitamin E (mg/kg diet) 10.50 Vitamin C (mg/kg diet) 13.8 β -Carotene (mg/kg diet) 46
1) Energy was calculated via the carbohydrates (3.8 kcal/g), amino acids (4 kcal/g), and lipids (9 kcal/g) from the diets. 2) Carbohydrates exclude fiber.
– TPN Group: For 4 days (3rd to 7th day of life), the guinea pig pups were fed ex-clusively with TPN via the catheter. Through our experience, we have concluded that 4 days of exposure to the TPN would be sufficient to investigate the effect of peroxide. Our lab team tried to increase the number of days ; however, conse-quently, an increase in the incidence of infiltration was observed. Moreover, the death rate of animals has increased. The TPN solution was infused at a constant rate of 220 mL/kg/day and contained 4.8 g/kg/day amino acids + 3.8 g/kg/day li-pids + 8.7% (w/v) dextrose + 1% multivitamin preparation (MVP) + 1 unit/mL heparin (table 3.II). The composition of this nutritive solution was close to what
newborn human infants receive. Heparin is added to the TPN solution to prevent blood coagulation during fixing the catheter and for its maintenance. At seventh day of life, TPN was stopped and the animals were fed ad libitum enteral with the same diet as control group (High Fiber Guinea Pig Diet 2041).
TABLE3.II – TPN Macronutrient Information Nutrient (cal/22ml solution/day) TPN
Energy 9.75
Dextrose 4.26
Lipid 3.66
Amino acids 1.83
Moreover, in order to assess the effect of an early diet enriched in glucose on the programming of glycolysis later in life, each group was divided into two subgroups from the 3rd week of life onward. The second week served as a transition period for the animals to learn how to eat by themselves. Since, Guinea pigs are refractory to a cafeteria-like diet [96, 97], in order to improve the caloric intake, animals received tap water with glucose (100 g/L ; similar to sucrose concentration of Coca Cola) whereas the control subgroup drank regular tap water without any glucose. The animals daily water consumption was 10 mL per 100 g of body weight. The high concentration of glucose in the glucose water had some side effects on the guinea pigs, such as painful oral ulcers. Therefore, the animal facility staff rinsed the mouth of animals with water to prevent this side effect. Four animals were assigned to each cage due to the space limitation in the animal facility as well as ensuring an appropriate level of social life for them.
At the 4th week of life, the growth rate, physical activity, blood glucose, plasma triacylglycerol (TG) and cholesterol were measured. The glucose tolerance curve was measured at the 8th week of life. We hypothesized that supplementation of diet with a high energetic component such as glucose would prevent modifications in body weight. Since, the growth rate is an important characteristic indicating the weight gain rate,
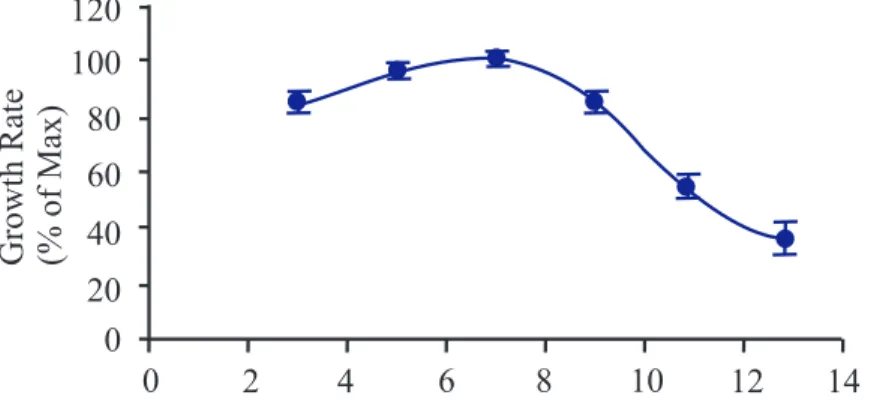
al-lowing animals to reach their maximum growth rate is important. Based on unpubli-shed research study of our laboratory (Dr. Lavoie JC), guinea pigs reach their maximum growth rate between 6thto 9th week of age (figure 3.1). Therefore, animals were sacrifi-ced at the 9th week of life, after 18 hours of fasting, under anesthesia with isoflurane and oxygen. Isoflurane was chosen to provide the accurate length and depth of anesthesia. Isoflurane is usually used with oxygen to prevent hyperventilation. Livers were remo-ved, weighed, rinsed with 0.9% NaCl, and rapidly minced on the ice bath. Samples were conserved at −80◦C for further assays. Plasma samples were collected and stored until determinations. 0 20 40 60 80 100 120 GrowthRate (%ofMax) 0 2 4 6 8 10 12 14
FIGURE 3.1 – Guinea pig growth rate versus time (unpublished data from Dr. Lavoie JC’s laboratory).
Figure 3.2 schematically presents the different stages of the present study as well as the timeline for the physical, clinical, and biochemical determinations.
3.4 Analytical Measurements
3.4.1 Physical Phenotype Determinations 3.4.1.1 Growth Rate
Body weight was monitored at the beginning of each week. The purpose of this evaluation was to document the effect of the neonatal TPN and glucose diet on the growth rate of animals and its impact on their body weight later in life.
FIGURE3.2 – The study timeline.
3.4.1.2 Physical Activity
Physical activity was measured at the 4thand 7thweek of the animals’ lives as counts of spontaneous ambulatory activity using the AccuScan infrared instrument (AccuScan Instruments, Inc., Fusion 2.1, Columbus, Ohio, USA) [98]. Animals did not have access to chow during the monitoring but water was supplied. Measurements were taken over a period of 4 hours; however, the results included in this study correspond to the last 2 hours, as the first 2 hours were considered as the adaptation period. The instrument was equipped with 8 light beams as horizontal lines. Infrared detectors collected the animals’ movements and transferred the information to a computer software which processed the input signals [98].
3.4.2 Clinical Phenotype Determinations 3.4.2.1 Fasting Blood Glucose
For this assay, animals had no access to chow for 6 hours. Blood samples were obtai-ned from the saphenous vein. Blood glucose was measured through the administration of one peck of blood samples on the strip of a digital glucometer (One Touch ultra Me-ter, LifeScan Europe, Division of Cilag GmbH International, Switzerland). All recorded results were displayed in mM values [99]. The remaining blood samples were kept in K3EDTA-coated tubes and were centrifuged (Beckman Co, Fullerton, CA, USA) at 10
000 RPM for 4 minutes. The plasma (supernatant) was decanted and stored at −80◦C for triglycerides and cholesterol assays.
3.4.2.2 Glucose Tolerance Test
An intraperitoneal injection of glucose solution (1g/kg-(body weight)) was perfor-med at the 8th week, after a fast of 18 hours. Measurement of blood glucose of each guinea pig was performed from the saphenous vein every 30 minutes up to 150 minutes. Blood glucose was measured using a digital glucometer [99].
3.4.2.3 Plasma Triglycerides and Cholesterol Concentrations
Plasma triglycerides (TG) and cholesterol concentrations were measured at the 4th and 9th week of guinea pigs’ lives using an enzymatic colorimetric method. For the plasma TG measurement, a colorimetric commercial kit (Triglycerides GPO-PAP #12016648, Roche diagnostics, Indianapolis, IN, USA) was used. The kit method is based on the work by Wahlefeld AW et al. [100] using a lipoprotein lipase from microorganisms for the rapid and complete hydrolysis of triglycerides to glycerol followed by oxidation to dihydroxyacetone phosphate and hydrogen peroxide. The resultant hydrogen peroxide reacts with 4-aminophenazone and 4-chlorophenol under the catalytic action of peroxi-dase, forms a red dyestuff. The color intensity of the red dyestuff is directly proportional to the triglyceride concentration and can be measured photometrically. In this study, gly-cerol (0-2 mM) was used as a standard. For the assay, 1 mL of the kit reagent was added
to 10 µL of plasma and incubated for 10 minutes at room temperature resulting the red color solution. The color intensity measurement was performed at a wavelength of 500 nm using a spectrophotometer (DU 640, Beckman Co, Fullerton, CA, USA).
For the plasma cholesterol measurement, another colorimetric commercial kit (Cho-lesterol CHOD-PAP # 11489437, Roche diagnostics, Indianapolis, IN, USA) was used. The kit method is base on the work by Allain CC et al. [101] and Roeschlau et al. [102]. Cholesterol is determined enzymatically using cholesterol esterase and cholesterol oxi-dase. First, cholesterol esters are cleaved by the action of cholesterol esterase to yield free cholesterol and fatty acids. Then, cholesterol is converted by oxygen with the aid of cholesterol oxidase to ∆4-cholestenone and hydrogen peroxide. The resulted hydrogen peroxide forms a red dyestuff by reacting with 4-aminophenazone and phenol under the catalytic action of peroxidase. The color intensity is directly proportional to the concen-tration of cholesterol and can be determined photometrically. In our study, cholesterol (0-4.2 mM) was used as the standard curve. For the assay, the same steps as for TG measurement were employed. For both assays, the results were expressed in µM.
3.4.2.4 Liver Triglycerides and Cholesterol Concentrations
Hepatic triglycerides (TG) and cholesterol concentrations were measured at the 9th week of guinea pigs’ lives using the same methods and kits as described for the plasma in the previous section. However, an additional step for the extraction of the liver lipid was required to prepare the initial solution for the assay. In our study, the Folch method was used for the liver lipid extraction [103]. Initially, liver samples (500 mg wet wt.) were homogenized in two volumes of saline (0.9% NaCl solution) by three passes (10 seconds per pass) in a homogenizer (Polytran Teader, Biospec products Inc, Dermel-Racine, WI, USA). 100 µL of the homogenate was mixed with 2 mL of Folch solution (chloroform: methanol 2 :1 v/v) and were agitated for 1 hour, at 4◦C. Subsequently, 400 µ L of saline (0.9% NaCl solution) was added to each homogenate sample. Samples were centrifuged at 2500 × g for 10 minutes at room temperature (25◦C), which resulted in two separate phases. The upper liquid phase of samples, containing small organic polar
molecules, were removed by siphoning and the lower solid phase, containing lipids, were evaporated under a nitrogen stream and re-suspended in 100 µL of Folch and 125 µL of thesit 20% (v :v), diluted in chloroform. The resultant mixtures were evaporated again under nitrogen stream, which yields oily residues. The residues were suspended in 1.25 mL distilled water and finally, 50 µL of suspensions were used for the assay. The protein assay was performed using the Bradford method (see below). The results were presented as nmol/mg protein.
3.4.3 Biochemical Phenotype Determinations 3.4.3.1 Dosage of protein
Determination of the protein contents of liver fractions and blood cells were perfor-med by a modification of the Bradford MM et al. method [104], using Bio-Rad reagent containing 100 mg Coomassie brilliant blue G-250 in 50 mL 95% ethanol and 100 mL 85% (w/v) phosphoric acid. The method is based on the binding of protein with Co-omassie brilliant blue in acid solution. Hydrophobic and ionic interactions stabilize the anionic form of the dye, causing a visible color change, which is detected photometri-cally.
Initially, proteins from liver and blood pellets were solubilized with 1N NaOH (500 mg of liver pellets in 1100 µL of 1N NaOH; 200 µL of blood pellets in 600 µL of 1N NaOH). The solubilizing of samples was performed by incubating at 4◦C for 12 hours. Subsequently, 50 µL of each solution was transferred to the spectrophotometer cuvette containing 1 mL of Bio-Rad reagent. Cuvettes were incubated for 10 minutes at room temperature (25◦C). The resulting color intensity was directly proportional to the concentration of protein and was determined spectrophotometrically at 595 nm. The protein concentrations were compared to a standard curve of bovine serum albumin (0 -120 pg/µL).
3.4.3.2 Glucose 6-Phosphate
The approach used for this assay was the adapted enzymatic method described by
Bergmeyer HU et al. [105]. This method is based on the conversion of G6P to 6-phosphogluconate and NADPH in the presence of NADP, with the aid of glucose 6-phosphate
dehydroge-nase (G6PD). The formation of NADPH is proportional to the amount of G6P. Using the spectrophotometer, at 340 nm and knowing the molar extinction coefficient of NADPH at this wavelength to be 6.22 mM−1cm−1, the concentration of G6P was determined.
For the assay, liver samples (200 mg wet wt.) were pulverized on dry ice with mortar and pestle, resulting in a powder. Each powdered sample was transferred to a 50 mL tube containing 300 µL of 3 M cold perchloric acid and 1 mL cold distilled water. Samples were homogenized by three passes (10 seconds per pass) in the homogenizer. The ho-mogenates were centrifuged at 5000 × g for 10 minutes at 4◦C. A sample (1 mL) of the resultant supernatant was mixed with 290 µL of a solution of cold 2M KOH and 0.4 M imidazole. The supernatants were again centrifuged at 5000 × g for 10 minutes at 4◦C. The protein assay was performed on the resultant pellets using the modified Bradford method (section 3.4.3.1). Afterward, 50 µL of the resultant supernatants was transfer-red to the spectrophotometer cuvette containing 20 µL of 20 mM NADP, 10 µL of 0.5M MgCl2, 20 µL of 150 mM ATP, and 950 µL of 0.4 M triethanolamine buffer. The
absorp-tion of samples was recorded at 340 nm, 0, 1, and 2 minutes after mixing, and the mean value calculated (mean absorbance #1). At 2 min, 5 µL of 2.5 µM G6PD was added to the each supernatant, which enhanced the reaction rate. The absorption of samples was determined at 340 nm at 6, 7, and 8 minutes, and averaged (mean absorbance #2). To measure the G6P concentration, the difference between absorbance 2 and 1 was divided by the molar extinction coefficient of NADPH (6.22 mM−1cm−1) and was reported in the pmol/mg of protein.
3.4.3.3 Liver Enzyme Activity Assays – Liver Glucokinase Activity
Although both hexokinase and glucokinase are present in the liver, glucokinase is predominant. These enzymes catalyze the production of glucose 6-phosphate from glu-cose. In the present study, liver glucokinase activity was measured using the method of Ming-zhi Xu et al. [106] and Ferre T et al. [107]. Based on this method, the extent of glucokinase activity can be measured through the reduction of NADP in the presence of G6PD during the conversion of glucose 6-phosphate to 6-phosphogluconate. Since, the amount of NADP can be measured through a colorimetric method; knowing the mo-lar extinction coefficient of NADPH at a specified wavelength, the glucokinase activity could be determined.
For the assay, liver samples (200 mg wet wt.) were homogenized in an ice bath by three passes (10 seconds per pass) in the homogenizer, in the presence of 2 volumes of homogenate buffer containing 100 mM tris-HCl, pH 7.5, 5 mM EDTA, 5mM MgCl2,
150 mM KCl and 0.7 µL of 2-mercaptoethanol per mL. Homogenates were centrifuged at 1400 × g at 4◦C for 20 minutes. Samples of resultant supernatants were centrifuged again at 12 000 × g for 10 minutes at 4◦C. Supernatants were kept in an ice bath and re-sultant pellets were suspended in 500 µL of homogenate buffer. The resuspended pellets were recentrifuged (12 000 × g for 10 minutes at 4◦C) and the resultant supernatants were combined with the supernatants from the first centrifugation.
The calculation of total enzyme activity of GK was based on the difference between the glucose phosphorylation capacity in the presence of 100 mM vs 0.5 mM glucose. Tubes containing 3 mL of reaction buffer (100 mM Tris-HCl, pH 7.5, 0.2 mM NADP, 5 mM ATP, 5 mM MgCl2, 0.2 unit G6PD), containing either 100 mM glucose
(high-glucose) or 0.5 mM glucose (low-(high-glucose) were warmed at 30◦C for 5 minutes. Clear liver supernatant (20 µL), warmed to room temperature (25◦C) was added into each tube to start the reaction, which was allowed to proceed for 60 minutes. The rate of formation of NADPH from NADP was monitored spectrophotometrically from the rate of change in absorbance at 340 nm. The rate of increase in absorbance achieved in the low-glucose tube was subtracted from that achieved in the high-glucose tube. Protein content was
determined by a modified Bradford method (section 3.4.3.1). Liver glucokinase activity was reported as µmol/min/mg protein.
– Liver Phosphofructokinase-1 Activity
The assay was based on the method of Karadsheh NS et al. [108] and Hamer MJ et al. [109]. The PFK-1 activity was measured by determining the rate of NADH oxi-dation and fructose1,6-bisphosphate formation at room temperature (25◦C). Similar to previously mentioned determinations, the amount of NADH could be measured through a colorimetric method knowing its molar extinction coefficient at a particular wavelength (at λ = 340 nm, the molar extinction coefficient of NADH is 6.22 mM−1cm−1). The PFK-1 activity could be determined based on the rate of NADH oxidation.
Liver samples (300 mg wet wt.) were homogenized by three passes (10 seconds per pass) in a homogenizer, in 9 volumes of 50 mM triethanolamine, pH 7.35 (20◦C), containing 1 mM EDTA, 15 mM KF, 2mM MgCl2, and 3 mM EGTA. Homogenates
were centrifuged at 12 000 × g for 2 minutes at 4◦C. Supernatants were then centrifuged at 100 000 × g for 10 minutes at 4◦C to produce a clear extract for analysis of PFK-1 activity.
The total Phosphofructokinase-1 activity was measured at pH 8.1 in an assay sys-tem (1 mL total volume) which contained 50 mM Tris-HCl pH 8.14, 1 mM fructose-6-phosphate, 2 mM MgCl2, 1 mM ATP, 0.16 mM NADH, 2.5 mM dithiothreitol (DTT),
5mM (NH4)2S04, 1 mM EDTA, 0.4 unit of aldolase, 2.4 units of triosephosphate
iso-merase and 0.4 unit of glycerol-3-phosphate dehydrogenase. Assay was performed at 25◦C by adding an 0.01 mL aliquot of Phosphofructokinase-containing extract to the assay system. Absorbance of each sample was read at a wavelength of 340 nm over a period of 10 minutes. One unit of phosphofructokinase activity corresponded to the oxidation of 2 µmol of NADH, which is equivalent to the production of 1 µmol of fructose1,6-bisphosphate/min under these conditions. Protein content was determined using the modified Bradford method (section 3.4.3.1). The results were expressed in
terms of µmol/min/mg protein.
3.4.3.4 Pyruvate
A pyruvate assay kit (Bio Vision #K607-100) was used for the pyruvate determina-tion. The assay is based on the oxidizing of pyruvate by pyruvate oxidase to generate color. Since the color intensity is proportional to pyruvate content, the pyruvate concen-tration can be accurately measured.
Liver samples (100 mg wet wt.) were homogenized in an ice bath by three passes (10 seconds per pass) in a homogenizer, initially containing 400 µL pyruvate assay buffer. The resultant homogenates were centrifuged at 7200 × g for 2 minutes to obtain a clear pyruvate-bearing supernatant. Using a 96 well plate, individual aliquots of supernatant (1 µL) were mixed with 50 µL of pyruvate assay buffer (46 µL pyruvate assay buffer, 2 µL pyruvate probe, and 2 µL pyruvate enzyme) in an individual well and incubated for 30 minute at room temperature, protected from light. The absorbance of each sample was determined at 570 nm by spectrophotometer. The absorbance values were compared to those of a series of pyruvate standards (0-8 nmol/well). Protein content was measured according to a modified Bradford method (section 3.4.3.1). Pyruvate concentrations were expressed as nmol/mg protein.
3.4.3.5 Glycogen
Determination of the liver glycogen followed the basis Kemp A et al. method [110], based on the color reaction that occurs by heating a diluted glycogen solution with concentrated sulphuric acid.
Liver samples (25-75 mg wet wt.) were homogenized in an ice bath by three passes (10 seconds per pass) in a homogenizer containing 5 mL methanol 80% (v/v). The ho-mogenates were centrifuged at 3000 RPM for 5 minutes. The resultant supernatants were
removed. Pellets were ground with 5 mL of deproteinizing solution (5% trichloroacetic acid and 3.21 mM silver sulphate). The fluids levels were marked on the tubes and the tubes were covered with glass caps. Although pure glycogen dissolved in the deprotei-nizing solution, only part of it can be extracted from the liver tissue with a cold solution. To extract the full complement of liver glycogen, supernatant tubes were heated in a boiling-water bath for 15 minutes. The tubes were then cooled under running tap water and were filled up to the mark with the deproteinizing solution to compensate for eva-poration. Samples were then centrifuged at 3000 RPM for 5 minutes. One mL of 36 N sulphuric acid was added to 333 µL of each clear supernatant and heated for 6 minutes. Subsequently tubes were cooled in running tap water. The intensity of the resulting pink color was proportional to the amount of glycogen and was measured in the spectrophoto-meter at 520 nm. The glycogen concentration of each sample was compared to a standard curve for glucose (0-800 µM). Protein content of the homogenate dosage was measu-red based on a modified Bradford method (section 3.4.3.1). The values were reported in nmol/mg protein.
3.4.4 Determination of Redox Status
The overall tissue redox status was quantified by the redox status of the couplet of oxidized glutathione (GSSG) and reduced glutathione (GSH), as described by Schafer FQ et al. [111]. In our laboratory, the assay of GSH and GSSG levels was based on the capillary electrophoresis method developed by Lavoie JC et al. [112]. Immediately after sacrificing animals, liver samples (500 mg wet wt.) were acidified in 5 volumes of iced and freshly prepared 5% (w/v) metaphosphoric acid and homogenized by 2 passes (10 seconds per pass) in the homogenizer. Metaphosphoric acid reduces the rate of oxidative processes. Homogenates were centrifuged at 7200 × g for 3 minutes. The resultant pel-lets and supernatants were frozen at −80◦C until protein and glutathione determination assays. The assay was performed after the frozen supernatants were thawed and diluted 5-fold in water. The GSH and GSSG from 50 µL supernatant aliquots were separated by capillary electrophoresis (P/ACETM MDQ Beckman Coulter). The silica capillary had
an inner diameter of 75 µm and was 50 cm in length. The electrophoresis buffer consis-ted of 75 mM boric acid and 25 mM Bis-Tris, pH 8.4. Electrophoresis was performed at a voltage of 18 kV for 10 minutes and samples GHS/GSSG levels were detected at 200 nm. The glutatione-based redox potential was calculated by using the Nernst equation: Ehc= −240 − (59.1/2) log([GSH]2/[GSSG]) mV at 25◦C, pH =7 [111].
3.5 Statistical Analysis
Results of the present study were expressed as mean ± standard error of the mean (sem). Main effects and interaction effects were tested by ANOVA ([TPN vs. Control] × [± Glucose diet]) or ([age] × [TPN vs. Control] × [±Glucose diet]). The Bartlett’s Chi square test was used to assess homoscedasticity. Each group contained at least 3 samples. If a significant interaction occurred between parameters, data was analyzed according to the parenteral nutrition and control group, glucose-rich-diet or age. A si-gnificant difference between the TPN and control group would suggest that neonatal peroxide exposure, in the form of exposure to TPN, induces some form of metabolic programming. A significant effect of age would suggest that the stage of development modulates the clinical phenotype. A significant effect of glucose supplementation would suggest that the nutritional environment is important for the clinical manifestation of the metabolic phenotype. The threshold of significance was set at p < 0.05.
RESULTS
According to Barker’s hypothesis of "developmental origin of adult health and di-sease", several adult disorders can be traced back to the neonatal period. In the present study, several physical, clinical, and biochemical determinations were made to assess the impact of neonatal exposure to oxidant molecules and early glucose supplementation on the modulation of glucose metabolism programming later in life.
Four test groups were compared: 1) "Control" animals were fed regular chow from the 3rd day to the 9th week of life. 2) "Control + G" were fed regular chow from the 3rd day and supplemented with a diet enriched in glucose from the 3rd week of life. 3) "TPN" animals received total parenteral nutrition from the 3rd to the 7th day of life and were fed with regular chow thereafter. 4) "TPN + G" were treated as the "TPN" animals, but their diet was enriched in glucose from the 3rd to the 9thweek. All the animals were nourished with mother’s milk until their 3rdday of life.
4.1 Physical Phenotypes
The growth rate of animals that had received glucose from the 3rd to 9th week of life was lower (p < 0.05) than the rate measured in animals that had received water devoid of glucose (Figure 4.1). The TPN treatment had no significant effect on the growth rate and there was no interaction between parameters.
The physical activitiy, characterized by the number of movements per hour, mea-sured at the 4th and 7th week of age, are presented in figure 4.2. All treatments were without significant effect. Similarly, relative liver weight (figure 4.3) was not affected by the treatments.
GrowthRate W eek3-9(g/week) Control G TPN G Control +G TPN +G 0 2 4 6 8 10 12 *
FIGURE4.1 – Growth rate during the 3rdto 9thweeks of age. Control: animals fed regular
food; TPN: animals fed exclusively by parenteral nutrition between day 3 and 7 of their lives followed by regular food; G: animals drank sugared water from their 3rd week of life. The growth rate was lower (p < 0.05) in animals receiving glucose than those not receiving glucose. Mean±sem, n=3-4 per treatment combination.∗ p< 0.05
FIGURE 4.2 – Physical activity at the 4th and 7th week of age. Control : animals fed regular food; TPN: animals fed exclusively by parenteral nutrition between day 3 and 7 of their lives followed by regular food; G: animals drank sugared water from their 3rd week of life. There was no significant difference between any treatments at either age. Mean±sem, n=3-4 per treatment combination.
Control G TPN G Control +G TPN +G 1 2 3 4 5 0 RelativeLiver W eight atthe9 W eek (%ofBody W eight) th
FIGURE 4.3 – Relative liver weight at the 9th week of age. Control: animals fed regular
food; TPN: animals fed exclusively by parenteral nutrition between day 3 and 7 of their lives followed by regular food; G: animals drank sugared water from their 3rd week of life. There was no significant difference between any treatments. Mean±sem, n=3-4 per treatment combination.
4.2 Clinical Phenotypes
Glucose tolerance results are presented in figure 4.4. None of the treatments affec-ted blood glucose levels over time after intraperitoneal injection of sucrose. The fasting blood glucose observed at the 4thand 8thweek of life did not differ significantly between treatments (figure 4.5).
Plasma triacylglycerol (TG) and total cholesterol at the 4th and 9th week are shown in figure 4.6 (a to d). Cholesterol levels were not significantly different for any treatment factor. At week 4 there was no effect of any treatment on TG levels (figure 4.6(a)); ho-wever, at week 9, within the no-glucose treatment TG was higher for the control than the TPN treatment (figure 4.6(a)); however, this difference was not apparent in the glucose-treated animals. This long-term impact of TPN (p < 0.05) has been previously reported by our team [35]. Levels of hepatic cholesterol (figure 4.7) and TG (figure 4.8) showed no significant differences for any treatment factor.
Control G TPN G Control + G TPN + G Bloodglucoseatthe8 (mM) th W eek 24 0 4 8 12 16 20 0 30 60 90 120 150
FIGURE 4.4 – Blood glucose tolerance at the 8th week of age. Control : animals fed regular food; TPN: animals fed exclusively by parenteral nutrition between day 3 and 7 of their lives followed by regular food; G: animals drank sugared water from their 3rd week of life. There was no significant difference between any treatments at any time. Mean±sem, n=3-4 per treatment combination.
Control G TPN G Control +G TPN +G 4 weekth 8 weekth Control G TPN G Control +G TPN +G FastingBloodGlucose W eeks4&8(mM) 0 2 4 6 8 10 12
FIGURE4.5 – Fasting blood glucose at the 4th and 8thweek of age. Control: animals fed regular food; TPN: animals fed exclusively by parenteral nutrition between day 3 and 7 of their lives followed by regular food; G: animals drank sugared water from their 3rd week of life. There was no significant difference between any treatments at either age. Mean±sem, n=3-4 per treatment combination.
Control G TPN G Control +G TPN +G Plasma T riacylglycerol ( M) m W eek4 th 0 200 400 600 800 1000 (a) (b) 0 200 400 600 800 1000 1200 Control G TPN G Control +G TPN +G PlasmaCholesterolatthe ( M) m 4 W eek th (c) 0 200 400 600 800 1000 1200 Control G TPN G Control +G TPN +G 1400 1600 PlasmaCholesterolatthe9 ( M) th m W eek (d)
FIGURE 4.6 – a) Plasma triacylglycerol at the 4th week, b) Plasma triacylglycerol at the 9th week, c) Plasma cholesterol at the 4th week, and d) Plasma cholesterol at the 9th week of age. Control: animals fed regular food; TPN: animals fed exclusively by paren-teral nutrition between day 3 and 7 of their lives followed by regular food; G: animals drank sugared water from their 3rdweek of life. The only significant difference between treatments was observed in panel (b), where a TPN effect was observed for glucose-free control treatments (p < 0.05), but disappeared when animals received glucose in their drinking water. Mean±sem, n=3-4 per treatment combination.∗: p < 0.05.
Control G TPN G Control +G TPN +G 0 Hepatictriacylglycerol (nmol/mgprotein) atthe9 W eek th 20 40 60 80 100 120
FIGURE 4.7 – Liver triacylglycerol at the 9th week of age. Control: animals fed regular food; TPN: animals fed exclusively by parenteral nutrition between day 3 and 7 of their lives followed by regular food; G: animals drank sugared water from their 3rd week of life. There was no significant difference between any treatments. Mean±sem, n=3-4 per treatment combination. Control G TPN G Control +G TPN +G 0 Hepaticcholesterol (nmol/mgprotein) atthe9 W eek th 5 10 15 20 25 30
FIGURE 4.8 – Liver cholesterol at the 9th week of age. Control : animals fed regular
food; TPN: animals fed exclusively by parenteral nutrition between day 3 and 7 of their lives followed by regular food; G: animals drank sugared water from their 3rd week of life. There was no significant difference between any treatments. Mean±sem, n=3-4 per treatment combination.