Science Arts & Métiers (SAM)
is an open access repository that collects the work of Arts et Métiers Institute of
Technology researchers and makes it freely available over the web where possible.
This is an author-deposited version published in: https://sam.ensam.eu Handle ID: .http://hdl.handle.net/10985/13982
To cite this version :
José Alejandro BETANCUR, Jérémy PLOUZEAU, Frédéric MERIENNE, Daniel SUÁREZ -Human behaviour analysis when using Head-Up Display systems in autonomous driving situations - In: Driving Simulation Conference 2018 Europe VR, France, 2018-09-05 - Driving Simulation Conference - 2018
Any correspondence concerning this service should be sent to the repository Administrator : [email protected]
Human behaviour analysis when using Head-Up
Display systems in autonomous driving situations
J. Alejandro Betancur1, Jérémy Plouzeau2, Frederic Merienne2, Daniel Suárez1
(1) Pontificia Universidad Javeriana, Departamento de ingeniería industrial, Bogotá-Colombia, e-mail: {j-betancur, d-suarez}@javeriana.edu.co
(2) Lispen EA7515, Arts et Métiers, UBFC, HeSam, Institut Image, Chalon-sur-Saone, France, e-mail: {jeremy.plouzeau, frederic.merienne}@ensam.eu
Abstract –
This paper covers an autonomous driving situation, in which a fully automated vehicle was proposed for driving along a specific route, while some safety-related information was projected in a Head-Up Display (HUD) system. This situation was tested by 10 subjects in a driving simulator, in order to estimate how the mental discomfort in autonomous driving situations could be influenced when using or not the proposed HUD system. The above, was performed firstly by measuring and analysing for all test subjects their pupil size, blink rate, heart rate, temperature and electro-dermal activity as discomfort estimators; and secondly, by developing a categorical questionnaire for identifying anxiety and stress. According to the results, there was not enough evidence for confirming a significant reduction on the measured discomfort variables (p-value<0.05) while using the proposed HUD visual interfaces; these results were also supported by all categorical questions developed after the proposed experimentation. In conclusion, under the experimental considerations here proposed the HUD systems do not influence the mental discomfort in autonomous vehicles.
Keywords: Head-Up Display, Autonomous Driving, Human Machine Interaction, User Experience.
Introduction
The development and evolution of the Advanced Driver-Assistance Systems (ADAS) define the capabilities of the autonomous driving vehicles [Alt17], therefore the user understanding of an autonomous driving situation depends, in turn, on how the users understand the ADAS communication interfaces; in this sense, some studies expose the implementation of Head-Up Display (HUD) systems as necessary for visually understanding the ADAS systems influences [Wie17], specifically those systems related to hazard pedestrians maneuvers [Göt15]. According to the above, this research is focused on comparing the driver behavior when using or not different visual inputs in a specific HUD system, during an autonomous hazard pedestrian situation. The above is especially remarkable for autonomous driving, due to there is always a user discomfort for do not controlling the cars’ maneuvers [Noy18].
Recalling the above, there is an academic and also an industrial discussion about how a HUD interface could help the driver to always feel in control and keep calm when autonomous driving is active.
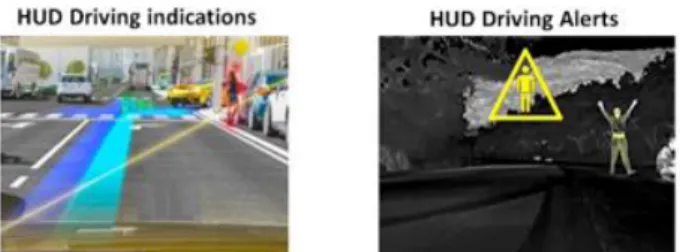
Therefore, this research work explores the main human factors involved during autonomous driving, measuring these human factors when different HUD visual interfaces are applied to a specific hazard situation. These interfaces are mainly related to driving route indications or driving alerts, as shown respectively in Figure 1.
Fig 1. Driving route indications and driving alerts in HUDs. Furthermore, even if there is an always bigger quantity of HUD systems focused on improving driving experiences [Bet16], a research question arises about whether or not there is any impact on the driving behaviour when using autonomous automobiles equipped with HUD systems, specifically during hazard situations related to pedestrians; on the other hand, regarding that the visual configuration of the information projected in a
HUD could influence the driving behaviour [Kno15, Alv13], some specific driving route indications and driving alerts were proposed, in order to enhance the probabilities for finding significant differences on the driving behavior.
Finally, according to the autonomous driving levels defined by the Society of Automotive Engineers
(SAE – see at the International Standard J3016 for motor vehicles), this paper is focused on the fourth level (high automation); thereby, the results here obtained are replicable just for that level of autonomous driving.
Related works
Currently, simulations of autonomous and semi-autonomous vehicles includes a limited quantity of driving scenarios [Sad15, Kim18], this because every one of these simulations involve their own evaluation objectives, and methodologically is more comprehensible to board just one driving situation at time, instead of boarding all of these at the same time. Then, the development of these driving scenarios is proposed according to accidental data provided by traffic police reports and assurance organizations.
For instance, Sportillo et al. [Spo17] describe semi-autonomous situations such as line-keeping and static and dynamic obstacle avoidance, providing real-time collection of relevant user and vehicle data, looking for warning the driver throughout a HUD system when it was necessary to take-over the driving control of the car. This paper describes a straight-line driving situation, in which the driver activates the autonomous driving (80 km/h as maximum speed), looking for developing infotainment tasks; and then, re-taking the car control when an obstacle is detected by the autonomous driving (130 km/h as maximum speed), avoiding a possible crash by using the lane-change maneuver.
Similarly, Charissis and Papanastasiou [Cha08] proposed a sudden brake scenario in which drivers travelled a distance of 2km in a motorway, and then the lead vehicles brake abruptly, causing the following vehicles to decelerate rapidly. Also, another scenario was composed based on the previous one, but in this case the driver follows a leading vehicle’s group for 5 km, and then a 120 degrees curve takes place, finishing in an underneath bridge with traffic congestions; additionally, heavy fog and weather conditions become worse the driver´s visibility. Therefore, this study determined the driver’s performance with and without the assistance of a proposed HUD interface. In this way, Sportillo et al., Charissis and
Papanastasiou [Spo17, Cha08] describe driving scenarios in which throughout a HUD system the user is forced to braking or maneuvering around a possible hazard situation.
In general, some basic driving interfaces have been broadly explored in autonomous driving situations. For instance, Sadigh et al. [Sad15] suggest a method for exposing driving information according driver data feedback; these data were related to driver gaze tracking and steering wheel touch sensors, looking for estimating the driver behavior by using k-means clustering algorithms.
Methodology
Problem understanding
When an autonomous automobile is involved in a hazard situation, the occupants could experiment a high mental discomfort because of not having the driving control of the automobile [Duf15]. In this case study, the HUD systems represent an alternative for reducing this mental discomfort by showing critical information about the faced hazard situations; therefore, these situations are related to the main car-to-pedestrians statistic, and the mental discomfort suffered by the test subjects is estimated by measuring the following variables:
Pupil size (PZ): there is a trend between the increasing of the visual effort by discomfort and the reduction of the pupil size [Atc12]. Blink rate (BR): usually while test subjects
become more concentrated, there is a blinking frequency reduction [Bor14]. Heart rate (HR): under different driving
situations the heart rate measures are largely unaffected [Sha18].
Temperature (T): this type of information is usually adopted as a basic control measurement [Bor14, Hea05].
Electro-dermal activity (EDA): according to Healey and Picard [Hea05], specific changes in the electro-dermal activity are correlated with different driver stress levels. NASA-TLX Questionnaire as mental workload indicator (MW): this type of information is usually adopted for quantifying the driver experience [Har88, Kre77].
In this way, the following research questions are addressed by this paper:
(1) During autonomous driving: can the HUD system affect the discomfort estimators by
exposing information about the upcoming pedestrian hazard situation?
(2) If the above-mentioned question is affirmative: among driving route indications and driving alerts which one produce a lower discomfort in autonomous driving?
The methodological approach for solving these research questions is presented in this paper as follows:
Description of the proposed experiment o Proposed hazard driving situations o Experimental approaches for the
hazard driving situation
o Technical testing bench specification
o Test subject selection o Data acquisition procedure Data analysis & discussion. Conclusions & future steps.
Description of the proposed
experiment
Proposed hazard driving situations
Regarding previous researches about implementation trends in automotive HUD systems “(…) from the driver interaction point of view the most included information in HUD systems is related to traffic sign recognition systems, collision warning systems and pedestrian detection systems (…)” [Bet2016]; from which, the last two could involve autonomous maneuvers. However, the collision warning systems are too wide and extremely random to be analyzed by using just one single driving situation, therefore the pedestrian detection systems allows to develop a more specific analysis.
Consequently, for the pedestrian detection systems, there are maneuvers that could prevent or avoid car-to-pedestrian collisions, some of the most known are: steering pad (from ISO 7401), Sine with Dwell (from FMVSS n. 126 and reg.UNECE13-H), and plenty more; but, regarding the most common car-to-pedestrian accident scenario1 proposed by APROSYS [Lan11], under an imminent collision, the Sine with Dwell maneuver is the most suggested one for being applied, as presented in Figure 2.
1 According to Lange [Lan11], the proposed car-to-pedestrian accident represents the most common one (59%).
Fig 2. Proposed hazard driving situation
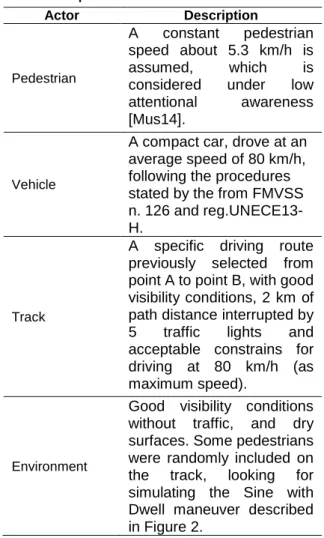
According to Lange [Lan11], for the scenario depicted in Figure 2, the characteristics indicated in Table 1 must be applied.
Table 1. Development of the most common car-to-pedestrian accident scenario.
Actor Description
Pedestrian
A constant pedestrian speed about 5.3 km/h is assumed, which is considered under low attentional awareness [Mus14].
Vehicle
A compact car, drove at an average speed of 80 km/h, following the procedures stated by the from FMVSS n. 126 and reg.UNECE13-H.
Track
A specific driving route previously selected from point A to point B, with good visibility conditions, 2 km of path distance interrupted by 5 traffic lights and acceptable constrains for driving at 80 km/h (as maximum speed).
Environment
Good visibility conditions without traffic, and dry surfaces. Some pedestrians were randomly included on the track, looking for simulating the Sine with Dwell maneuver described in Figure 2.
Experimental approaches for the hazard
driving situation
As described in section “Problem understanding”, during the driving scenario here proposed a driving indication or driving alert was projected throughout a HUD system, as indicated in Figure 3.
Fig 3. Proposed HUD information.
Then, the instant for projecting the information in the HUD system is related to the Perception Reaction Time (PRT), which in this case describes the time needed to identify a potential risky situation (0.8 seconds) [Ber17]. Therefore, according to Table 1 the HUD information must be displayed at least at 17.76 meters before the car-to-pedestrian collision. Also, the red color was implemented for the information projected in the HUD system; the above is related to Alves et al. [alv13], which propose that “the severity of the danger is shown based on colour changes from green (safety) to red (danger)”.
Technical testing bench specification
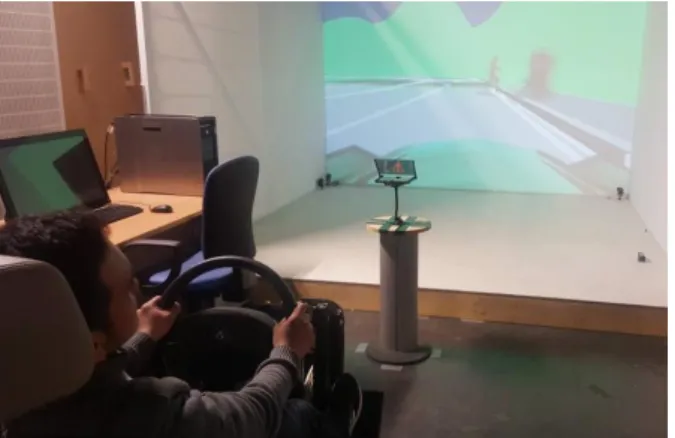
The proposed testing bench involve 2 main components, a TV display and a HUD combiner. The position in which these must be placed, and its constructive parameters are indicated in Figure 4 and Figure 5.
Fig 4. Proposed testing bench.
2 This is a design parameter proposed in literature
[Hel97], based on the fact that for an emmetropic
Fig 5. Schematic view of the proposed testing bench.
Where:
M: middle point of the TV display, which coincides with the drivers’ sight line.
E: virtual image position of the proposed HUD system. At this point the combiner is also placed. θ: maximum eccentricity viewing angle that subtend all the HUD virtual image=10°.
θc; combiner inclination angle=45°.
TV display coordinates (x1,y1) = (6.0 m, 0.0 m). HUD virtual image coordinates (x2,-y2): these distances are based on the driver´s Depth Of Field (DOF)2 = (2.3 m, -0.4 m).
Figure 6 represents the common view of proposed driving scenario indicated in Table 1, which was developed throughout Unity-3D ®, version 2018.1.
Fig 6. Proposed driving environment.
Test subject selection
For this experiment 10 test subjects (8 males and 2 females) were proposed, aged between 22 and 29 years old (mean=23.6 years, std=2.67 years), all of them have a valid driving license at least during 3 years (mean=4.7 years, std=2.83 years). Then, every test subject was evaluated in terms of Visual Acuity (VA), looking for determining ophthalmological illnesses; according to the results, all test subjects had normal or corrected-to-normal
adult human looking at the optical infinity, his depth of focus is 0.43D (2.3m) [Cam57].
sight, i.e. no significant differences were identified among the VA values for both eyes (Right eye: mean= 0.589, std=0.118; Left eye: mean= 0.576, std=0.137; Kruskal-Wallis test: Chi-square=0.12, df=1, p-value=0.914). Also, every test subject was provided with a written consent to participate in these experiments, declaring s/he has not history of psychiatric. Finally, during the proposed experiments all test subjects were naïve about the scope of the obtained results.
Data acquisition procedure
During the autonomous driving context every test subject faced one time the proposed hazard pedestrian situation, using or not the HUD system. Then, every time the data3 from the BR, PZ, HR, T, EDA and the MW questionnaire was obtained. The test subjects drove for 3 minutes every one of the proposed Scenario (S) (S1: scenario without HUD, S2: scenario using HUD driving route indications, and S3: scenario using HUD driving alerts), and for all these the proposed hazard pedestrian situation was included at least one time, lasting every time at least 1 second. Therefore, all test subjects were prompted for driving during 9 minutes. Also, during the proposed experimentation every test subject was prompted to be focused just on the driving route, looking for avoiding any secondary task.
In this sense, for solving the first research question indicated in Section 2.1, it is necessary to compare the PZ, BR, HR, T, EDA, and the MW for all test subjects when using an autonomous vehicle equipped or not with a HUD system. Then, for solving the second research question it is necessary to compare the PZ4, BR5, HR6, T7, EDA8, and the MW9 for all test subjects when using driving route indications or driving alerts projected by the HUD system while a hazard pedestrian situation take place.
Data analysis & discussion
Regarding the obtained data, from the statistical point of view the Analysis Of Variances test (ANOVA) was implemented; therefore, for every single Scenario (S) a set of data were defined. The
3 The BR and the PZ variables were measured by using the SMI Eye tracking glasses; then, the EDA was measured by using the E4 Empatica wristband. 4 Measured in millimetres.
5 Rated in minutes.
6 Measured in Beats Per Minute (BPM). 7 Measured in Degree Centigrade (°C).
8 EDA is also noun as the skin conductance, measured in MicroSiemens (µS).
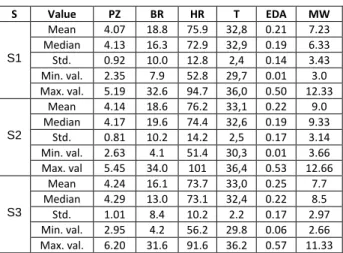
statistical description of the obtained results are indicated in Table 2.
Table 2. Data set collected from the proposed driving situation. S Value PZ BR HR T EDA MW S1 Mean 4.07 18.8 75.9 32,8 0.21 7.23 Median 4.13 16.3 72.9 32,9 0.19 6.33 Std. 0.92 10.0 12.8 2,4 0.14 3.43 Min. val. 2.35 7.9 52.8 29,7 0.01 3.0 Max. val. 5.19 32.6 94.7 36,0 0.50 12.33 S2 Mean 4.14 18.6 76.2 33,1 0.22 9.0 Median 4.17 19.6 74.4 32,6 0.19 9.33 Std. 0.81 10.2 14.2 2,5 0.17 3.14 Min. val. 2.63 4.1 51.4 30,3 0.01 3.66 Max. val 5.45 34.0 101 36,4 0.53 12.66 S3 Mean 4.24 16.1 73.7 33,0 0.25 7.7 Median 4.29 13.0 73.1 32,4 0.22 8.5 Std. 1.01 8.4 10.2 2.2 0.17 2.97 Min. val. 2.95 4.2 56.2 29.8 0.06 2.66 Max. val. 6.20 31.6 91.6 36.2 0.57 11.33
In the same way, from a graphical point of view the information reported in Table 2 is also exposed throughout the Figures 7.a), 7.b), 7.c) 7.d), 7.e), 7.f).
a) b)
c) d)
9 The proposed MW questionnaire consist on a series answers that were averaged, in order to obtain a single indicator based on the following questions (ranked for minimum 0 to 21 maximum):
-Mental demand (MD): How mentally demanded was the task?
-Temporal demand (TD): How hurried or rushed was the pace of the task?
-Frustration (F): How insecure, discouraged, irritated, stressed, and annoyed were you?
e) f)
Fig 7.
a) Distribution of the PZ data obtained during the proposed driving scenarios.
b) Distribution of the BR data obtained during the proposed driving scenarios.
c) Distribution of the HR data obtained during the proposed driving scenarios.
d) Distribution of the T data obtained during the proposed driving scenarios.
e) Distribution of the EDA data obtained during the proposed driving scenarios.
f) Distribution of the MW data obtained during the proposed driving scenarios.
Before applying the ANOVA analysis, the homoscedasticity (Levene test), and normality (Shapiro-Wilk test) assumptions were verified for every single set of data, finding that the first one test was fulfilled for the PZ, BR, HR, T, EDA and MW data without implementing any transformations (p-value PZ, BR, HR, T, EDA, MW = 0.724, 0.591, 0.610, 0.618, 0.14, 0.88>0.05); then, the second one test was fulfilled for every S in the PZ (p-value S1=0.645, p-value S2=0.833, p-value S3=0.685), BR (p-value S1=0.072, p-value S2=0.497, p-value S3=0.583), HR (p-value S1=0.595, p-value S2=0.956, p-value S3=0.984), T (p-value S1=0.258, p-value S2=0.061, p-value S3=0.568), EDA (p-value S1=0.853, p-value S2=0.521, p-value S3=0.401) and MW (p-value S1=0.204, p-value S2=0.416, p-value S3=0.515); finally, all variables were taken randomly, in order to do not affect the independence assumption.
Consequently, according to the ANOVA test, for the PZ, BR, HR, T, EDA and MW data there were not significant differences among the proposed S (p-value PZ, BR, HR, T, EDA, MW= 0.915, 0.947, 0.886, 0.969, 0.885, 0.450>0.05); from which it is possible to state that there is not enough evidence to confirm that there are significant differences in the drivers PZ, BR, HR, T, EDA and MW, when facing a hazard pedestrian situation in an autonomous vehicle equipped with HUD system.
In this sense, even if Kim et al. (2018) exposed significant advantages for pedestrians’ collisions warnings applied to automotive HUD systems, the driving context was mainly focused on non-autonomous driving, conformal graphics, and the Limit Braking manoeuvre instead of the Sine with
Dwell manoeuvre. Consequently, the conclusions stated by this study are not comparable to the results here obtained. Then, the implementation of the HUD systems in autonomous driving as a discomfort reducer during hazard situations is not recommended by this study.
Conclusions & future steps
According to the indicated hazard situation, for autonomous driving the proposed HUD system does not influences significantly the PZ, BR, T, HR, EDA and MW variables, neither for the whole driving test (1 minute) nor for the specific hazard situation (1 second); the above is consistent for the driving route indication and the driving alert here described. Therefore, regarding the same colour (red), size (>2cm) and exposition time (1 second), the shape of the hazard information projected in the HUD system does not produce any significant effect on the above-mentioned variables, which are considered in this study as mental discomfort estimators.
Additionally, by using the ANOVA analysis, comparing the MW variable among S1, S2 and S3 not as an average but independently as the MD, TD and F indicators, there were not found significant differences for any of these indicators in any S (p-value MD = 0.147, p-(p-value TD = 0.817, p-(p-value F= 0.624).
In this sense, an analysis not about hazard situations, but about infotainment interfaces could represent a more valuable point of discussion when considering autonomous driving; consequently, the above is proposed as a future research work. Finally, it could be also interesting to implement the methodological approach here indicated to other autonomous driving situations, including physical feedbacks as reactions forces and vibration.
Financial disclaimer: this study has been financially supported by the Pontificia Universidad Javeriana (Bogota, Colombia). Project “Análisis del comportamiento del conductor cuando se utilizan sistemas automotrices Head-Up Display”, ID 07228.
References
Altche, F., Qian, X., & de La Fortelle, A. An algorithm for
supervised driving of cooperative semiautonomous vehicles. IEEE Transactions on Intelligent Transportation
Systems, doi:10.1109/TITS.2017.2736532, 2017.
Atchison, DA. Depth of focus of the human eye. In: Origins, Effects, and Treatment. Thorofare NJ: Slack Incorporated, 2012.
Alves, P. R. J. A., Goncalves, J., Rossetti, R. J. F., Oliveira, E. C., & Olaverri-Monreal, C. Forward collision warning
systems using heads-up displays: Testing usability of two new metaphors. Paper presented at the IEEE
Intelligent Vehicles Symposium, Proceedings, 1-6. doi:10.1109/IVS.2013.6629438, 2013.
Berardo, M. Irureta V. Influencia de la correcta
evaluación del tiempo de percepción y reacción.
Avaliable at: http://www.institutoivia.com/cisev-ponencias/spicologicos_fisiologicos_fp/maria_berardo.pdf [Accessed 30 Sept 2017].
Betancur, J.A., Villa-Espinal, J., Osorio-Gómez, G., Cuellar, S., Suárez D., Research topics and implementation trends on automotive head-up display systems. International Journal of Interactive Design and
Manufacturing, 2016.
Borghini, G., Astolfi, L., Vecchiato, G., Mattia, D., Babiloni, F. Measuring neurophysiological signals in aircraft
pilots and car drivers for the assessment of mental workload, fatigue and drowsiness. Neuroscience and
Bio-behavioral Reviews, 44, 58-75, 2014.
Campbell F. W. The depth of field of the human eye. Óptica Acta 4. 157-164, 1957.
Duffield, T. J., & Krupenia, S. Drivers' interaction
preferences in autonomous vehicle multimodal interactive systems. Paper presented at the Proceedings
of the Human Factors and Ergonomics Society, 2015-January1302-1306. 10.1177/1541931215591213, 2015. Götze, M., Ruff, F., & Bengler, K. Optimal information
output in urban traffic scenarios: An evaluation of different HMI concepts. Procedia Manufacturing, 3,
739-746. doi:10.1016/j.promfg.2015.07.317, 2015.
Hart, S.G., Staveland, L.E.. Development of NASA-TLX
(Task Load Index) results of empirical and theoretical research. In: Hancock, P.A., Meshkati, N. (Eds.), Human
Mental Workload. North Holland Press, Amsterdam, 1988. Healey, J. A., & Picard, R. W. Detecting stress during
real-world driving tasks using physiological sensors. IEEE Transactions on Intelligent Transportation
Systems, 6(2), 156-166, 2005.
Helander, M., Landauer, T., and Prabhu, P. Handbook of
Human-Computer Interaction, Elsevier, ISBN:
978-0-444-81862-1, 1997.
Kim, H., Gabbard, J. L., Anon, A. M., & Misu, T. Driver
behaviour and performance with augmented reality pedestrian collision warning: An outdoor user study. IEEE Transactions on Visualization and Computer
Graphics, 10.1109/TVCG.2018.2793680, 2018.
Knott, V. C., Demmelmair, S., & Bengler, K. Distraction
and driving behavior by presenting information on an “emissive projection display” compared to a head-up display, International Conference on Engineering
Psychology and Cognitive Ergonomics, 2015.
Krebs, M.J., Wingert, J.W., Cunningham, T., Exploration
of an Oculometer Based Model of Pilot Workload.
NASA Technical report CR-145153. Honeywell Systems & Research Center, Minneapolis, Minnesota, 1977.
Lange, R., APROSYS SP 1 – Detailed draft test scenarios for a specific pre-crash safety system (D 1.3.3). Available: www.aprosys.com. [Accessed 30 Sept 2017].
Mustafa, M., Baser, N., & Ashaari, Y. Evaluating
pedestrian crossing speed distribution: A case study of shah alam. Paper presented at the IET Conference
Publications, 2014.
Noy, I. Y., Shinar, D., & Horrey, W. J. Automated driving:
Safety blind spots. Safety Science, 102, 68-78.
doi:10.1016/j.ssci.2017.07.018, 2018.
Sadigh, D., Driggs-Campbell, K., Bajcsy, R., Shankar-Sastry, S., Seshia, S. User Interface Design and
Verification for Semi-Autonomous Driving.
Proceedings of the 3rd international conference on High confidence networked systems ACM Press, 2014. 63–64. CrossRef. Web. 28 Oct. 2015.
Sportillo, D., Paljic, A., Boukhris M., Fuchs, P., Ojeda, L., Roussarie, V. An immersive Virtual Reality system for
semi-autonomous driving simulation: a comparison between realistic and 6-DoF controller-based interaction. International Conference on Computer and
Automation Engineering, 2017.
Shakouri, M., Ikuma, L. H., Aghazadeh, F., & Nahmens, I.
Analysis of the sensitivity of heart rate variability and subjective workload measures in a driving simulator: The case of highway work zones. International Journal
of Industrial Ergonomics, 66, 136-145, 2018.
Vassilis Charissis and Stylianos Papanastasiou. Artificial
Intelligence Rationale for Autonomous Vehicle Agents Behaviour in Driving Simulation Environment.
Advances in Robotics, Automation and Control, ISBN: 978-953-7619-16-9, InTech, 2008.
Wiesner, C. A., Ruf, M., Sirim, D., & Klinker, G.
Visualisation of the electronic horizon in head-up displays. Paper presented at the Adjunct Proceedings of
the 2016 IEEE International Symposium on Mixed and Augmented Reality, ISMAR-Adjunct 2016, 87-89. doi:10.1109/ISMAR-Adjunct.2016.0047, 2017.