T
T
H
H
È
È
S
S
E
E
En vue de l'obtention du
D
D
O
O
C
C
T
T
O
O
R
R
A
A
T
T
D
D
E
E
L
L
’
’
U
U
N
N
I
I
V
V
E
E
R
R
S
S
I
I
T
T
É
É
D
D
E
E
T
T
O
O
U
U
L
L
O
O
U
U
S
S
E
E
Délivré par l'Université Toulouse III - Paul Sabatier Discipline ou spécialité : Mathématiques apppliquées
Présentée et soutenue par Yogesh PARTE Le 9 novembre 2009
Titre :
Quelques techniques de couplage de modèles et de données
(Some techniques to couple models and data)
JURY
Mohamed Masmoudi Professeur Université Toulouse III, France Directeur de thèse
Jacques Périaux Professeur Université Politecnica
Catalunya, Espagne Rapporteur
Alain Dervieux Directeur
recherche INRIA
INRIA Sophia Antipolis, France Rapporteur
Delphin Braga Responsable R&D ACTIS SA, France Examinateur
Philippe Guillaume Professeur INSA Toulouse, France Président
Jérôme Monnier Professeur INSA Toulouse, France Examinateur
Thierry Druot Ingénieur de
recherche
AIRBUS, France Examinateur
Ecole doctorale : Mathématiques Informatique Télécommunications Unité de recherche : Institut de Mathématiques de Toulouse - Equipe MIP
“The important thing in science is not so much to obtain new facts as to discover new ways of thinking about them.” - William Lawrence Bragg
This work is dedicated to all those who cherish new ways of thinking to better understand the world around.
Contents
Preface xix
Acknowledgment xxi
I. Modeling Energetic Performance of Test Cells 1
1. Introduction 3
1.1. Thin reflective multi-foil insulation (TRMI) . . . 3
1.1.1. Limitations using hot plate apparatus . . . 5
1.1.2. Limitations using hot box method . . . 5
1.2. Methodology adopted by Actis to test TRMI . . . 5
1.3. Problem description and solution methodology . . . 6
1.4. Summary and outlook . . . 7
2. In situ measurements 9 2.1. Test methodology . . . 9
2.2. Description of test cells . . . 9
2.3. Instrumentation, measurements . . . 11
2.4. Database of measurements . . . 12
2.4.1. Measurements performed during winter season of year 2005-2006 . . . 12
2.4.2. Measurements performed during round robin test campaign of year 2008 13 2.5. Terminology used and sign conventions . . . 15
2.6. Details of the test cell location, surface area, volume and orientation . . . 17
2.6.1. Location details of test sites . . . 17
2.6.2. Geometrical details of test cells in France . . . 17
2.6.3. Geometrical details of test cells in Spain . . . 18
2.6.4. Geometrical details of test cells in Lithuania . . . 18
2.7. Summary and outlook . . . 19
3. Model and data coupling using neural network 21 3.1. Overview of application of neural network models . . . 21
3.2. GAP Formulation . . . 22
3.2.1. Neural networks . . . 22
3.2.2. Training of neural networks . . . 25
3.2.3. Levenberg-Marquardt algorithm . . . 26
3.3. Simulations using GAP . . . 27
3.3.1. Database used for simulation . . . 27
3.3.2. Training of neural network . . . 28
3.3.3. Prediction using neural network . . . 29
4. Predictive clustering method 33
4.1. Introduction . . . 33
4.2. K-means algorithm . . . 33
4.3. Predictive clustering . . . 35
4.3.1. Methodology to estimate U-value . . . 36
4.4. Implementation details . . . 36
4.5. Application for round robin test data of year 2008 . . . 36
4.5.1. Pre-processing of data . . . 37
4.5.2. Analysis of the data . . . 37
4.5.3. Choice of number of clusters . . . 37
4.5.4. Numerical results . . . 41
4.5.5. Inferences from numerical results . . . 44
4.6. Application for the dataset of year 2005-2006 . . . 45
4.6.1. Pre-processing of data . . . 45
4.6.2. Numerical results . . . 45
4.6.3. Inferences from numerical results . . . 46
4.7. Summary . . . 46
5. Physics based modeling 49 5.1. Problem definition . . . 49
5.2. Selection of modeling approach . . . 50
5.3. Outline of chapter . . . 51
5.4. Model for heat flux transfer across test cell components . . . 51
5.4.1. Computation of thermal resistances . . . 53
5.4.2. Thermal resistance network . . . 55
5.4.3. Computation of nodal temperature using thermal resistance network . . 58
5.5. Model for energy consumption . . . 61
5.6. Model parameter estimation . . . 62
5.7. Analysis and pre-processing of the in situ data . . . 62
5.7.1. Analysis and cleaning of in situ data . . . 62
5.7.2. Data pre-processing operations . . . 63
5.8. Implementation of models in SPEC software . . . 65
5.9. Modeling studies using SPEC . . . 66
5.9.1. Modeling test cell with breather membrane . . . 66
5.9.2. Modeling of test cell without breather membrane . . . 72
5.9.3. Modeling test cell with special breather membrane . . . 75
5.9.4. User defined parametric models . . . 78
5.9.5. Numerical results for test cells in France . . . 79
5.9.6. Numerical results for test cells in Spain . . . 103
5.9.7. Summary of numerical results and inferences . . . 111
5.10. Effect of different model parameters on estimated prediction using SPEC and comparison with model parameters estimated from ISO6946 . . . 112
5.10.1. Data sets used . . . 112
5.10.2. Modeling details . . . 112
5.10.3. Computation of air layer thermal conductivity using ISO 6946 . . . 115
5.10.4. Results and discussion . . . 115
5.11. Conclusions . . . 117
II. DIVE: A New Approach to Multi-disciplinary Design
Optimization 125
7. Introduction 127
7.1. Project OMD, ANR/RNTL . . . 130
7.2. Scope of the thesis and contribution to OMD project . . . 131
7.3. Summary and outlook . . . 131
8. State of the art in multidisciplinary design optimization 133 8.1. Definition of parameters . . . 133
8.1.1. Public parameters . . . 133
8.1.2. Private parameters . . . 134
8.2. Creation of parameters . . . 134
8.2.1. Shape parametrization using control volume technique . . . 135
8.3. MDO formulation . . . 140
8.3.1. Notations and terminology . . . 140
8.3.2. MDO problem . . . 141
8.3.3. Multidisciplinary Analysis (MDA) . . . 142
8.3.4. Global Sensitivity Equations (GSE) . . . 143
8.4. Different frameworks for multidisciplinary design optimization . . . 144
8.4.1. Multi-Disciplinary Feasible (MDF) method . . . 144
8.4.2. Individual Discipline Feasible (IDF) method . . . 146
8.4.3. Disciplinary Analysis Optimization (DAO) method . . . 148
8.4.4. All-At-Once (AAO) method . . . 150
8.4.5. Collaborative Optimization (CO) method . . . 152
8.4.6. Concurrent Sub-Space Optimization (CSSO) method . . . 155
8.4.7. Bi-Level Integrated System Synthesis (BLISS) . . . 159
8.4.8. BLISS2000 . . . 161
8.5. Game theoretic approach to multidisciplinary design optimization . . . 163
8.5.1. The Pareto equilibrium . . . 164
8.5.2. The Nash equilibrium . . . 164
8.5.3. The Stackelberg equilibrium . . . 165
8.5.4. Application of the game theory to the multidisciplinary design . . . 166
8.6. Other approaches for MDO . . . 167
8.7. Numerical optimization algorithms used in MDO . . . 167
8.8. Surrogate models and approximations . . . 168
8.9. Summary and outlook . . . 170
9. Disciplinary Interaction Variable Elimination Approach (DIVE) for MDO 173 9.1. Definition of parameters . . . 173
9.2. The disciplinary level . . . 173
9.3. Elimination of interaction variables . . . 174
9.3.1. Strong coupling . . . 174
9.3.2. Weak coupling . . . 175
9.4. System level . . . 175
9.5. Meta-model management framework . . . 175
9.6. DIVE Algorithm . . . 177
9.8. Implementation details of DIVE algorithm . . . 178
9.8.1. Code structure . . . 179
9.8.2. Optimization solver . . . 179
9.9. Summary and outlook . . . 179
10. Application of DIVE method 181 10.1. Test case: The heart dipole problem . . . 181
10.1.1. Description . . . 181
10.1.2. MDO formulation . . . 181
10.1.3. Numerical results and discussion . . . 182
10.2. Test case: Problem of combustion of Propane . . . 184
10.2.1. Description . . . 184
10.2.2. MDO formulation . . . 184
10.2.3. Numerical results and discussion . . . 185
10.3. Test case: Conceptual design of Super Sonic Businees Jet (SSBJ) presented under BLISS2000 . . . 187
10.3.1. Description . . . 187
10.3.2. DIVE formulation . . . 188
10.4. Test case: Conceptual design of an aircraft presented by Dassault aviation . . . 194
10.4.1. Description . . . 194
10.4.2. MDO Formulation . . . 195
10.4.3. Results and discussions . . . 196
10.5. Summary . . . 199
11. Conclusions 201
List of Figures
1.1. Tri-Iso Super-9 (TS9): A Thin reflective multi-foil insulation by Actis . . . 4
1.2. Schematic view of different heat transfer modes and important quantities for a thermal heat exchange in a typical roof with TRMI . . . 4
2.1. Configuration details of the test cell with multi-foil insulation . . . 10
2.2. Configuration details of the test cell with mineral wool insulation . . . 10
2.3. Configuration details of the test cell floor . . . 11
2.4. Layout and position of different sensors in a typical test cell . . . 12
2.5. Schematic layout of TS9 insulation . . . 12
2.6. Schematic layout of TRMI product used during round robin test campaign of year 2008 . . . 13
2.7. Schematic layout of the specially designed breather membrane . . . 14
2.8. Terminology used to describe test cell components . . . 16
2.9. Sign conventions and terminology used to describe wind direction measured by wind vane . . . 16
2.10. Test site in Limoux, France showing constructed test cells . . . 17
2.11. Test site in Spain showing constructed test cells . . . 18
3.1. Activation function used in NN model . . . 23
3.2. Schematic diagram of three layer feed-forward neural network . . . 24
3.3. Effect of moving average window size on the distribution of energy consumption value against temperature difference across the test cell. . . 27
3.4. Comparison of measured and simulated energy consumption in a test cell with TS9 insulation, located at Limoux, France. . . 28
3.5. Comparison of measured and simulated energy consumption in a test cell with mineral wool insulation, located at Limoux, France. . . 28
3.6. Comparison of measured and simulated energy consumption in a test cell with multi-foil insulation, located at TRADA, U.K. . . 29
3.7. Comparison of measured and simulated energy consumption in a test cell with mineral wool insulation, located at TRADA, U.K. . . 29
3.8. Comparison of weather data at eight different locations in U.K. and of Limoux, France . . . 30
4.1. Matrix plot of data recorded in France . . . 38
4.2. Matrix plot of data recorded in Spain . . . 39
4.3. Matrix plot of data recorded in Lithuania . . . 40
4.4. Change in intra-cluster inertia with number of clusters for measurement data set of France, Spain and Lithuania . . . 41
5.1. Different modes of heat transfer in a typical attic space . . . 49 5.2. Configuration details and schematic representation of the test cell roof with TRMI 52
5.3. Schematic geometry and equivalent thermal resistance networks for non
venti-lated air layer . . . 56
5.4. Schematic geometry and equivalent thermal resistance networks for ventilated
air layer. . . 57
5.5. Heat flux transfer in a typical TRMI and equivalent thermal resistance networks 58
5.6. Schematic layout of the model for the roof with TRMI and equivalent thermal
resistance networks. . . 60
5.7. Equivalent thermal resistance networks for the roof with multi-foil product when
the ventilated air layer is modeled using heat sink . . . 61
5.8. Schematic model and equivalent thermal resistance network for the roof with
TRMI and Proctor breather membrane . . . 68
5.9. Schematic model and equivalent thermal resistance network for the gable with
TRMI and Proctor breather membrane. . . 69
5.10. Schematic model and equivalent thermal resistance network for the floor of the
test cell. . . 69
5.11. Schematic model and equivalent thermal resistance network for the roof with
mineral wool insulation and Proctor breather membrane . . . 71
5.12. Schematic model and equivalent thermal resistance network for the gable with
mineral wool insulation and Proctor breather membrane. . . 71
5.13. Schematic model and equivalent thermal resistance network for the roof with
TRMI and without breather membrane. . . 73
5.14. Schematic model and equivalent thermal resistance network for the gable with
TRMI and without breather membrane. . . 74
5.15. Schematic model and equivalent thermal resistance network for the roof
con-taining TRMI and special breather membrane. . . 76
5.16. Schematic model and equivalent thermal resistance network for the gable
con-taining TRMI and special breather membrane. . . 77
5.17. Measured and model predicted flux on the left roof of a test cell in France with
TRMI product and containing breather membrane. . . 81
5.18. Measured and model predicted flux on the right roof of a test cell in France with
TRMI product and containing breather membrane . . . 81
5.19. Measured and model predicted flux on the back gable of a test cell in France
with TRMI product and containing breather membrane . . . 81
5.20. Measured and model predicted flux on the front gable of a test cell in France
with TRMI product and containing breather membrane . . . 82
5.21. Measured and model predicted flux on the floor for a test cell in France with
TRMI product and containing breather membrane . . . 82
5.22. Measured and predicted test cell consumption of a test cell in France with TRMI
product and containing breather membrane . . . 82
5.23. Weather data at Limoux during the period 14 January 2008 to 30 January 2008 83
5.24. Weather data at Limoux during the period 1 February 2008 to 16 February 2008 83
5.25. Temperature at different nodes in a left roof of the test cell with TRMI product and with breather membrane during the period 14 January 2008 to 30 January
2008 . . . 84
5.26. Amount of heat transfer by conduction/convection and radiation across different
layers that constitute left roof the test cell in France with TRMI product: 100th
and300thhour of the observation period . . . 85
5.27. Compass plot showing direction and magnitude of wind vector during a test pe-riod for a test cell in France with TRMI product and containing breather membrane 85
5.28. Measured and model predicted flux on the left roof of a test cell in France with
TRMI product and containing special breather membrane . . . 88
5.29. Measured and model predicted flux on the right roof of a test cell in France with
TRMI product and containing special breather membrane . . . 88
5.30. Measured and model predicted flux on the back gable of a test cell in France
with TRMI product and containing special breather membrane . . . 88
5.31. Measured and model predicted flux on the front gable of a test cell in France
with TRMI product and containing special breather membrane . . . 88
5.32. Measured and model predicted flux on the floor of a test cell in France with
TRMI product and containing special breather membrane . . . 89
5.33. Measured and predicted test cell consumption of a test cell in France with TRMI
product and containing special breather membrane . . . 89
5.34. Comparison between the variation of hourly averaged values of outside temper-ature, wind speed and global solar radiation during a period used for parameter estimation and for prediction period; data pertaining to a test cell in France with
TRMI product and containing special breather membrane. . . 89
5.35. Measured and model predicted flux on the left roof of a test cell in France with
TRMI product and without breather membrane. . . 92
5.36. Measured and model predicted flux on the right roof of a test cell in France with
TRMI product and without breather membrane. . . 92
5.37. Measured and model predicted flux on the back gable of a test cell in France
with TRMI product and without breather membrane. . . 92
5.38. Measured and model predicted flux on the front gable of a test cell in France
with TRMI product and without breather membrane. . . 93
5.39. Measured and model predicted flux on the floor of a test cell in France with
TRMI product and without breather membrane. . . 93
5.40. Measured and predicted test cell consumption of a test cell in France with TRMI
product and without breather membrane. . . 93
5.41. Comparison between the variation of hourly averaged values of outside temper-ature, wind speed and global solar radiation during a period used for parameter estimation and for prediction period; pertaining to a test cell in France with
TRMI product and without breather membrane. . . 94
5.42. Measured and model predicted flux on the left roof of a test cell in France with
mineral wool insulation and containing breather membrane. . . 97
5.43. Measured and model predicted flux on the right roof of a test cell in France with
mineral wool insulation and containing breather membrane. . . 97
5.44. Measured and model predicted flux on the back gable of a test cell in France
with mineral wool insulation and containing breather membrane. . . 97
5.45. Measured and model predicted flux on the front gable of a test cell in France
with mineral wool insulation and containing breather membrane. . . 97
5.46. Measured and model predicted flux on the floor of a test cell in France with
mineral wool insulation and containing breather membrane. . . 98
5.47. Measured and predicted test cell consumption for a test cell in France with
min-eral wool insulation and containing breather membrane. . . 98
5.48. Measured and model predicted flux on the left roof of a test cell in France with
mineral wool insulation and breather member is absent. . . 100
5.49. Measured and model predicted flux on the right roof of a test cell in France with
5.50. Measured and model predicted flux on the back gable of a test cell in France
with mineral wool insulation and breather member is absent. . . 101
5.51. Measured and model predicted flux on the front gable of a test cell in France
with mineral wool insulation and breather member is absent. . . 101
5.52. Measured and model predicted flux on the floor of test cell in France with
min-eral wool insulation and breather member is absent. . . 102
5.53. Measured and predicted test cell consumption for a test cell in France with
min-eral wool insulation and breather member is absent. . . 102
5.54. Measured and model predicted flux on the left roof of a test cell in Spain with
TRMI and without breather membrane. . . 104
5.55. Measured and model predicted flux on the right roof of a test cell in Spain with
TRMI and without breather membrane. . . 105
5.56. Measured and model predicted flux on the back gable of a test cell in Spain with
TRMI and without breather membrane. . . 105
5.57. Measured and model predicted flux on the front gable of a test cell in Spain with
TRMI and without breather membrane. . . 105
5.58. Measured and model predicted flux on the floor of a test cell in Spain with TRMI
and without breather membrane. . . 105
5.59. Measured and predicted test cell consumption of the test cell in Spain with TRMI
and without breather membrane. . . 106
5.60. Variation of hourly averaged values of outside temperature, relative humidity, wind speed and global solar radiation during a period used for prediction pe-riod pertaining to a test cell in Spain with TRMI product and with no breather
membrane. . . 106
5.61. Measured and model predicted flux on the left roof of a test cell in Spain with
mineral wool insulation and without breather membrane. . . 109
5.62. Measured and model predicted flux on the right roof of a test cell with mineral
wool insulation in Spain and when breather membrane is absent. . . 109
5.63. Measured and model predicted flux on the back gable of a test cell in Spain with
mineral wool insulation and when breather membrane is absent. . . 109
5.64. Measured and model predicted flux on the front gable of a test cell in Spain with
mineral wool insulation and when breather membrane is absent. . . 110
5.65. Measured and model predicted flux on the floor of a test cell in Spain with
min-eral wool insulation and when breather membrane is absent. . . 110
5.66. Measured and predicted test cell consumption for a test cell in Spain with
min-eral wool insulation and when breather membrane is absent. . . 110
5.67. Schematic model and equivalent thermal resistance network for case 1E . . . . 114
5.68. Schematic model and equivalent thermal resistance network for case 2E . . . . 114
6.1. Different snapshots of GAP software . . . 119
6.2. Snapshots of PClust software in action . . . 121
6.3. Snapshots of SPEC software in action . . . 122
8.1. Reference cube (left) and initial hexahedral element with its 8 control points
(right). . . 135
8.2. Wing parameters . . . 138
8.3. Modification of the wing thickness using a finite element of degree one in each
8.4. Modification of the wing twist using a finite element of degree one in each
di-rection. . . 138
8.5. Modification of the wing sweep using a finite element of degree one in each direction. . . 138
8.6. Modification of the wing profile using a finite element of degree two in one direction and of degree one in two other directions. . . 138
8.7. Modification of the dihedral using a finite element of degree two in one direction and of degree one in two other directions. . . 139
8.8. Engine displacement: Arrows correspond to degrees of freedom of different points, other points are fixed. . . 139
8.9. Mesh deformation around the aircraft wing obtained using improved integral method . . . 139
8.10. Schematic representation of a multidisciplinary design system involving two dis-ciplines . . . 140
8.11. Schematic representation of MDA for two disciplines using fixed point method 142 8.12. Information and data exchange paths in MDF framework for MDO . . . 145
8.13. Information and data exchange paths in IDF framework for MDO . . . 147
8.14. Information and data exchange paths in DAO framework for MDO . . . 149
8.15. Information and data exchange paths in AAO framework for MDO . . . 151
8.16. Information and data exchange path in CO framework for MDO . . . 153
8.17. Information and data exchange path in CSSO framework for MDO . . . 156
8.18. Schematic layout of information and data exchange flow in BLISS framework for MDO . . . 160
8.19. Schematic layout of information and data exchange flow in BLISS framework for MDO . . . 163
9.1. Moving trust region approach in DIVE . . . 176
9.2. Flow chart: DIVE approach for collaborative design . . . 177
9.3. Dependency graph of different modules used to implement DIVE algorithm in MATLAB . . . 179
10.1. Convergence history for three different starting points for human heart dipole problem solved using MDO formulation. . . 183
10.2. Convergence history for three different starting points for problem of combus-tion of Propane solved using MDO formulacombus-tion. . . 186
10.3. Interaction amongst different disciplines in SSBJ test case . . . 187
10.4. Convergence history of objective function value in each design iteration of DIVE for SSBJ test case . . . 191
10.5. Convergence history of objective function value in each design iteration of BLISS2000 method for SSBJ test case . . . 193
10.6. Schematic representation of interdependency amongst different subsystems in test case of conceptual design of an aircraft presented by Dassault aviation . . . 194 10.7. Dassualt test case: Different design variables used to represent aircraft geometry 196
List of Tables
2.1. Details of thermal properties of different materials used in test cell . . . 11
2.2. Geometrical details and material properties of different layer of TS9 insulation 13 2.3. Geometrical details and material properties of different layers of TRMI product used during round robin test campaign of year 2008. . . 14
2.4. Configuration details of the special breather membrane tested at Limoux, France. 15 2.5. Test periods for different test cell configurations . . . 15
2.6. Geographic coordinates of the test sites . . . 17
2.7. Details of the test cell located in France . . . 17
2.8. Details of the test cell located in Spain . . . 18
2.9. Details of the test cell located in Lithuania. . . 18
3.1. Measured and simulated net energy consumption in test cells located at Limoux, France. . . 28
3.2. Measured and simulated net energy consumption in test cells at TRADA, United Kingdom . . . 29
3.3. Simulated consumptions of test cells with ACTIS TS9 and mineral wool insula-tion at eight different locainsula-tions in United Kingdom. . . 30
4.1. Details of in situ measurement data set used to demonstrate predictive clustering method . . . 37
4.2. Cluster centers obtained for meteorological data at test site in France . . . 41
4.3. Regression coefficients and U-values for test cell in France with mineral wool insulation . . . 42
4.4. Regression coefficients and U-values for test cell in France with TRMI insulation 42 4.5. Cluster centers obtained for meteorological data at test site in Spain . . . 42
4.6. Regression coefficients and U-values for test cell in Spain with mineral wool insulation . . . 43
4.7. Regression coefficients and U-values for test cell in Spain with TRMI insulation. 43 4.8. Cluster centers obtained for meteorological data at test site in Lithunania . . . . 43
4.9. Regression coefficients and U-values for test cell in Lithuania with mineral wool insulation. . . 44
4.10. Regression coefficients and U-values for test cell in Lithuania with TRMI insu-lation. . . 44
4.11. Summary of numerical results . . . 45
4.12. Cluster centers obtained using meteorological data of eight different location in United Kingdom. . . 45
4.13. Regression coefficient and U-value for test cells with mineral wool insulation and TRMI located in United Kingdom. . . 46
4.14. Measured and simulated net energy consumption using K-means method in test cells located in United Kingdom . . . 46
5.2. Details of TS10 TRMI insulation of Actis . . . 53
5.3. Diffrent test cell configurations considered for numerical studies using SPEC . 66
5.4. Geometrical details and material properties used in the model for roof containing
TRMI and Proctor breather membrane. . . 67
5.5. Geometrical details and material properties used in the model for gable
contain-ing TRMI and Proctor breather membrane. . . 67
5.6. Geometrical details and material properties used in the model for floor. . . 68
5.7. Geometrical details and material properties used in the model for roof containing
mineral insulation and Proctor breather membrane. . . 70
5.8. Geometrical details and material properties used in the model for gable mineral
insulation and Proctor breather membrane. . . 70
5.9. Geometrical details and material properties used in the model for roof with
TRMI when breather membrane is absent. . . 72
5.10. Geometrical details and material properties used in the model for gable with
TRMI when breather membrane is absent. . . 72
5.11. Geometrical details and material properties used in the model for roof with
min-eral wool insulation when breather membrane is absent. . . 74
5.12. Geometrical details and material properties used in the model for gable with
mineral wool insulation when breather membrane is absent. . . 74
5.13. Geometrical details and material properties used in the model for roof containing
TRMI and special breather membrane. . . 75
5.14. Geometrical details and material properties used in the model for gable
contain-ing TRMI and special breather membrane. . . 76
5.15. Model prototype used to model convective heat transfer coefficients . . . 78
5.16. Measured and model predicted flux values for a test cell in France with TRMI
product and when breather membrane is present. . . 79
5.17. Measured and model predicted consumption values for a test cell in France with
TRMI product and when breather membrane is present. . . 80
5.18. Difference between measured and model predicted quantities for the data set used for model parameter estimation pertaining to a test cell in France with
TRMI product and containing breather membrane. . . 80
5.19. Difference between measured and model predicted quantities for the prediction data set pertaining to a test cell in France with TRMI product and containing
breather membrane. . . 80
5.20. Measured and model predicted flux values for a test cell in France with TRMI
product and containing special breather membrane . . . 86
5.21. Measured and model predicted consumption for a test cell in France with TRMI
product and containing special breather membrane . . . 87
5.22. Difference between measured and model predicted quantities for the data set used for parameter estimation pertaining to a test cell in France with TRMI
product and containing special breather membrane . . . 87
5.23. Difference between measured and model predicted quantities for the prediction data set pertaining to a test cell in France with TRMI product and containing
special breather membrane . . . 87
5.24. Measured and model predicted flux values for a test cell in France with TRMI
product and without breather membrane. . . 90
5.25. Measured and model predicted consumption of a test cell in France with TRMI
5.26. Difference between measured and model predicted quantities for the training data set pertaining to a test cell in France with TRMI product and without
breather membrane. . . 91
5.27. Difference between measured and model predicted quantities for the predic-tion data set pertaining to a test cell in France with TRMI product and without
breather membrane. . . 92
5.28. Measured and model predicted flux values pertaining to test cell in France with
mineral wool insulation and containing breather membrane. . . 95
5.29. Measured and model predicted consumption pertaining to test cell in France
with mineral wool insulation and containing breather membrane. . . 96
5.30. Difference between measured and model predicted quantities for the training data set pertaining to test cell in France with mineral wool insulation and
con-taining breather membrane. . . 96
5.31. Difference between measured and model predicted quantities for the prediction data set pertaining to test cell in France with mineral wool insulation and
con-taining breather membrane. . . 96
5.32. Measured and model predicted flux values for a test cell in France with mineral
wool insulation and without breather membrane. . . 99
5.33. Measured and model predicted consumption for a test cell in France with mineral
wool insulation and breather member is absent. . . 100
5.34. Difference between measured and model predicted quantities for the training data set pertaining to test cell in France with mineral wool insulation and without
breather member. . . 100
5.35. Difference between measured and model predicted quantities for the prediction data set pertaining to test cell in France with mineral wool insulation and without
breather member. . . 100
5.36. Measured and model predicted flux values for a test cell in Spain containing
TRMI and when breather membrane is absent. . . 103
5.37. Measured and model predicted consumption of a test cell in Spain with TRMI
and without breather membrane. . . 104
5.38. Difference between measured and model predicted quantities for the training data set pertaining to the test cell in Spain with TRMI and without breather
membrane. . . 104
5.39. Difference between measured and model predicted quantities for the prediction data set pertaining to the test cell in Spain with TRMI and without breather
membrane. . . 104
5.40. Measured and model predicted flux values pertaining to the test cell in Spain
containing mineral wool insulation and when breather membrane is absent. . . 107
5.41. Measured and model predicted consumption for a test cell with mineral wool
insulation and breather membrane is absent. . . 108
5.42. Difference between measured and model predicted quantities for the training data set pertaining to test cell in Spain containing mineral wool insulation and
when breather membrane is absent. . . 108
5.43. Difference between measured and model predicted quantities for the prediction data set pertaining to test cell in Spain containing mineral wool insulation and
when breather membrane is absent. . . 108
5.44. Model prototype used to model convective heat transfer coefficients . . . 113
5.45. Test cases for modeling studies using measurement data of the left roof of the
5.46. Test cases for modeling studies using measurement data of the left roof of the
test cell with TRMI and when specially designed membrane is present . . . 113
5.47. Thermal resistance and equivalent thermal conductivity of air layer modeled using ISO 6946, Case: Proctor breather membrane is present . . . 115
5.48. Thermal resistance and equivalent thermal conductivity of air layer modeled using ISO 6946, Case: Special breather membrane is present . . . 115
5.49. Summary of results obtained using model studies . . . 116
5.50. Tuned parametric model of outside convective heat transfer coefficients for dif-ferent test cases considered. . . 116
5.51. Tuned parametric model of inside convective heat transfer coefficients for dif-ferent test cases considered. . . 116
5.52. Tuned parametric model of convective heat transfer coefficients on the left side surface bounding the ventilated air layer for different test cases considered. . . 117
5.53. Tuned parametric model of convective heat transfer coefficients on the right side surface bounding the ventilated air layer for different test cases considered. . . 117
10.1. Details of subsystem input output relationship in the heart dipole problem . . . 182
10.2. Results obtained for the heart dipole problem: Case-1 . . . 182
10.3. Results obtained for the heart dipole problem: Case-2 . . . 183
10.4. Results obtained for the heart dipole problem: Case-3 . . . 183
10.5. Details of subsystem input output relationship in the problem of combustion of Propane . . . 185
10.6. Results obtained for the problem of combustion of Propane: Case-1 . . . 185
10.7. Results obtained for the problem of combustion of Propane: case-2 . . . 186
10.8. Results obtained for the problem of combustion of Propane: case-3 . . . 186
10.9. Nomenclature of different design variables and their definition in SSBJ test case. 188 10.10.Bound constraints on different variables in SSBJ test case . . . 188
10.11.Number of input and output variables and number of design points used to gen-erate meta model for each of the disciplinary analysis module . . . 190
10.12.Absolute difference between output values computed using disciplinary meta models and disciplinary analysis modules in each iteration expressed as loga-rithm to base 10 . . . 192
10.13.Number of calls to subsystem meta models in SSBJ test case using DIVE . . . 192
10.14.Comparison of optimum design variables obtained using DIVE and BLISS2000 method in SSBJ test case . . . 193
10.15.Number of calls to subsystem meta models in SSBJ test case using BLISS2000 193 10.16.Different system level design variables in Dassault test case . . . 195
10.17.Interaction variables in Dassault test case . . . 195
10.18.Dassualt test case: Optimal design variables obtained using different MDO frameworks . . . 197
10.19.Dassualt test case: Optimal value of output variables obtained using different MDO frameworks . . . 198
10.20.Dassualt test case: Number of calls for disciplinary analysis by different MDO frameworks . . . 198
Preface
This thesis represents contributions to two fields, first to model in situ energetic performance of test cells used to characterize thin reflective multi-foil insulation (TRMI) products and second to multidisciplinary design optimization. Though apparently different these two fields are linked by techniques to couple model and data using optimization methods, which is the core idea of this thesis work.
The part I of the thesis is a result of work carried out with ACTIS SA, France, a leading manufac-turer of TRMI products and association of European Multi-foil Manufacmanufac-turers (EMM). TRMI products are recognized by European commission as innovative products for which there is no harmonized test standard available. Various efforts are directed to formalize test standards for TRMI products and this thesis work is an attempt to provide mathematical basis and framework to support this activity. In the introductory chapter the fundamental problem related to the char-acterization of TRMI products and limitations of existing methods and standards are presented. Methodology adopted by ACTIS Research and Development team of comparing energetic per-formance of test cell with TRMI product to the classical insulation product such as mineral wool is also presented therein. Possible directions to couple mathematical models and in situ measurement data are discussed in this chapter. The central idea is to estimate intrinsic thermal characteristics of insulation product from the sequences of characteristic meteorological data of the test site and in situ measurements. In chapter 2, details of in situ tests and database generated out of these measurements are discussed. Chapter 3 describes neural networks based approach to model energetic performance of test cells. It is shown that a properly tuned neural networks model can predict energetic performance of test cells at different locations. Details of predictive clustering method developed to estimate energetic performance of the test cell are presented in chapter 4. The proposed methodology is accepted by CEN (European Committee for Standard-ization) as a tool to estimate energetic performance of the test cell during in situ tests. Chapter 5 presents a methodology of physics based modeling to predict energetic performance of test cell. By coupling in situ measurements and parametric one dimensional heat transfer models a new method to estimate energy consumption in a test cell is presented. With this modeling approach it is possible to estimate amount of heat flux or energy transfer across the test cell en-velope by different modes of heat transfer, namely conduction, convection and radiation. Theory behind this modeling technique and developed software named “Software for Predicting Energy Consumption” (SPEC) are presented in chapter 5. Application of SPEC to estimate energy con-sumption in test cells are presented therein. Comments and possible extensions of developed tools and new techniques are discussed in chapter 6.
The part II of this thesis presents contribution to the field of multidisciplinary design optimization (MDO). This work constitute a part of the national level project, Optimisation Multi-Disciplinaire (OMD) supported by l’Agence Nationale de la Recherche Française and R´éseau National des
Technologies Logicielles (ANR/RNTL)1. Chapter 7 presents details of MDO process and
dif-ferent aspects involved in the implementation of MDO in design cycle of the product. Outline of
1
xx Preface
the project “OMD” is provided in this chapter and scope of the work performed under this thesis is defined. In a context of OMD project, chapter 8 presents a brief overview of different essen-tial concepts required in MDO and existing frameworks for MDO. Advantages, disadvantages and comparison of these MDO methods are provided using simple analytic example. A new method named “Disciplinary Interaction Variable Elimination” (DIVE) is proposed in chapter 9. It is shown that DIVE is a generalization of trust region method and have distinct framework for meta model management. Comparison of DIVE framework and existing MDO methods is also presented therein. In chapter 10, DIVE method is illustrated using test problems such as the human heart dipole problem, problem of combustion of Propane and problem of conceptual design of an aircraft. As a part of OMD project, with collaboration of ONERA team, DIVE method is also tested for the test problem of design of super sonic business jet presented by Dassualt aviation. Results from these studies are also presented in chapter 10. All these studies have shown that DIVE method possesses number of advantages over existing MDO methods in terms of accurate solution of state equations, better meta-model management framework, better convergence characteristics and in a way is a generalization of existing MDO methods. Finally in chapter 11, comments and conclusions are presented.
Acknowledgment
Many thanks rather a debt of gratitude I owe to my thesis supervisor Prof. Mohamed Masmoudi for introducing me to the field of model and data coupling. Without his guidance, thought provoking discussions and freedom he provided, this work would not have been possible. I thank Prof. Jacques Périaux and Prof. Alain Dervieux for reviewing my thesis manuscript and for accepting to be “rapporteur” of the thesis. World of thanks also extends to members of jury, Prof. Jérôme Monnier and Prof. Philippe Guillaume from INSA Toulouse, Delfin Braga from ACTIS SA and Thierry Druot from AIRBUS, France. Thank you for your keen interest in my work and accepting to be the member of the jury.
Special thanks go to Delfin Braga of ACTIS SA, for sharing his expertise on testing of thermal insulation products, for technical discussions, his informal style and friendly nature during the course of this work. Interactions with research and development team of ACTIS SA, especially those with Maxim Duran and Ionut Enache always motivated for new ideas. Brain storming sessions with Ludovic Lauwers from association of European Multi-foil Manufacturers (EMM) lead to the development of “Predictive Clustering” method introduced in this thesis work. Thank you Ludovic for all discussions and brain storming sessions.
Encounters with Prof. Phillipe Guillaume as a founder of MODARTT and innovator of virtual piano, were more bemusing. This personality of orchestra director turned mathematics professor, and now a successful entrepreneur always motivated me that with shear passion, dedication and innovative ideas everything is possible.
Working with ONERA team of Jöel Clement, Nathalie Bartoli and Jean Hermetz for MDO project was a learning experience. Many thanks to them for their interest and contribution in testing DIVE method with different test cases. Thanks to Capt. Jeremy Agte of U. S. air force, now a doctoral student at MIT, for providing me with BLISS codes. It helped a lot in building, testing DIVE method and comparing it with BLISS.
I can not miss to acknowledge the training and encouragements I received from my former supervisors E. Janardhana, S. Swaminathan, P. Srinivasa and M. Patil from Vikaram Sarabhai Space Center (VSSC) of Indian Space Research Organization (ISRO). Under their guidance I initiated my first training in multi-disciplinary design optimization.
Help and support rendered by IMT secretariat Christine Marty and Marie-Louise Perez find a special place in this acknowledgment along with Jérôme Fehrenbach who is now an assistant professor in the same institute. Without them it would have been difficult to settle down in Toulouse. The stay in Toulouse is made pleasant by friends like Samy Gallego, Sandra, Jean Luc, Mathieu Fructus, Thierry Touya, Edith Taillefer, Mathieu Causse and whole lot of “Junta” of Indians in Toulouse group. Special thanks to Samy and Mathieu as often invariably I ended up seeking their help to resolve my administrative problems and runs with Prefecture. Cycle rides,
xxii Acknowledgment
week-end excursions and barbecue parties in summer were made graceful by Thangasivam, Kaushik and Laia. Moments I shared with wing commander Nitin, Kanchan, Tanay, Tanvi, Chandrakant, Archana, Anvayi, Ankit and Mr. and Mrs. Chatterejee are treasures for life time. Thank you all for the quality time we spent together and for making my stay in Toulouse an unforgettable experience.
This acknowledgment will be incomplete without thanking my family members in India: my mother Suhasini, brother Nilesh, sister Shubhada and sister-in-law Snehal for their constant support and believing in me in what I am doing. There are many friends back home in India who directly or indirectly helped me. Its not possible to thank each one of them individually as I have a huge network of friends but friends like Nikhil, Munikrishna, Rajesh, Santosh, Devendra, Ganesh do need a mention. Here in Toulouse, the little angel, my son Aalap, ensured that my after work moments were made delightful. Thanks to this little angel who relieved me of my stress and with his mischiefs often made me burst into laughter.
And then, there is a person to whom I owe a very special thanks. Her patience, encouragements and constructive suggestions throughout this thesis work and much of the part of my life assured me to dedicate myself to my work. Thank you very very much Sheetal for being a lovely wife and a true friend.
Part I.
Modeling Energetic Performance of
Test Cells
1. Introduction
Global warming is a crucial subject which has mobilized scientific community to adopt pre-ventive measures to cut down greenhouse gas emissions. The Kyoto Protocol establishes legally binding commitments for the reduction of four greenhouse gases, namely carbon dioxide, methane, nitrous oxide, sulfur hexafluoride [1]. The major production of these greenhouse gases is related to the energy consumption in residential and service industry. It is estimated that to cut down carbon dioxide emissions by 25% till year 2050 amounts to reduction in electricity demands by 75% of its present value [2]. Apart from use for illumination, use of electricity by heat-ing or coolheat-ing devices to maintain inside temperature of a dwellheat-ing represents major share in electricity consumption. Any savings in heating or cooling demands in a dwelling will lead to savings in electricity and thus lesser emission of greenhouse gases. With this perspective international standards are in operation to standardize building construction products and con-struction methodologies which will result in energy efficient buildings. Thermal insulation is a key product in building industry which is used to reduce unwanted heat loss or heat gain and to decrease energy demands of heating and cooling systems. Performance characteristics of a thermal insulation thus governs the energetic performance of the dwelling. In building industry, performance characteristics of a thermal insulation is evaluated in terms of insulation’s ther-mal resistance value, commonly known as R-value or therther-mal transmittance value, commonly known as U-value. Experimentally, standardized guarded hot plate [3] and hot box measure-ments [4] are used to measure R-value of product coupon. Alternatively, R-value or U-value of the insulation product and of the building component such as wall, etc., can also be estimated using methodology described in ISO 6946 [5]. However, a detailed report from Building Energy Research Establishment Ltd. has demonstrated that considerable difference exists between the thermal transmittance value U, computed using ISO standard such as ISO 6946 and the value measured in situ [6] . In certain cases, differences as large as 30% of the in situ values are reported. The difference arises from the fact that laboratory conditions or standards does not simulate factors such as wind, solar radiation, relative humidity, infiltration, etc., which influ-ence in situ performance of an insulation. This raises a question about the adequecy of existing standards and standardization methodologies to estimate in situ performance of thermal insula-tion products. The issue of adequecy of existing methods and standards are further raised with the introduction of new insulation products like Thin Reflective Multi-foil Insulation (TRMI) in European market. TRMI products are recognized by the European Commission as innova-tive products for which there is no harmonized test standard available. Several standardization processes are in progress with organizations nominated by the European Commission such as European Organisation for Technical Approvals (EOTA), European Comittee for Standardiza-tion (CEN) and should be successfully completed by the end of year 2009 [7].
1.1. Thin reflective multi-foil insulation (TRMI)
Actis SA, is a company which specializes in manufacturing and marketing of TRMI products such as Tri-Iso Super 9, Tri-Iso Super 10, etc., and represents 65% of European market of TRMI products [8]. Typical TRMI product of Actis is composed of stitched assembly of several layers of thin reflective foils of low surface emissivity separated by cotton and foam waddings. (See
4 1. Introduction
Fig. 1.1). The thickness of the assembly is about 25 to 35 mm and the insulation product can be installed in the roof or walls with a air cavity of minimum 25 mm on either side of the insulation. Unlike conventional block insulations such as mineral wool or glass wool which principally
Figure 1.1.: Tri-Iso Super-9 (TS9): A Thin reflective multi-foil insulation by Actis
resists the conductive heat transfer, TRMI resists the conductive, convective as well as radiative heat transfer using thin reflective foils and air cavities. It is the configuration of TRMI and air layers and its design to principally resists the radiative heat transfer which is difficult to test using existing standards. Fig. 1.2, reproduced from [9], shows different modes of heat transfer in a typical roof insulated using TRMI with air cavities. As evident from Fig. 1.2, the performance of TRMI is directly linked to thermal resistance of air layer surrounding the TRMI. Thermal resistance of air layers in turn depends on temperature gradient across the air layer, direction of heat transfer, velocity of air within air layers and number of other factors which can not be reproduced in a laboratory. Standard methods used to test TRMI such as hot plate apparatus, hot box method are discussed at length in [3, 4, 9] and therefore, are not discussed here. What we outline are the problems or limitations of the standard laboratory methods such as hot plate and hot box method to estimate TRMI product properties.
Figure 1.2.: Schematic view of different heat transfer modes and important quantities for a thermal heat exchange in a typical roof with TRMI
1.2. Methodology adopted by Actis to test TRMI 5
1.1.1. Limitations using hot plate apparatus
• This test method is principally designed to measure the thermal resistance or transmittance
due to conductive heat transfer whereas radiative heat transfer plays significant role in the performance of TRMI.
• TRMI products do not have a uniform shape and are “quilted”. So measuring their thermal
resistance accurately in a hot plate apparatus is difficult.
• Small air cavities are created between external surfaces of the product and the hot and cold
plates of the apparatus. The low emittance external surfaces affect the thermal resistance of these small air cavities which can produce substantial error in the measurement of U-value of the product.
• Thermal resistance due to air layers need to be modeled separately using empirical models
which can introduce error.
• It is very difficult to measure surface emittance of TRMI products. The rigorous method of
making emittance measurements is expensive and requires a very flat surface and therefore never adopted in practice [9].
• Thermal effects of overlaps of the insulation, thermal bridging effect due to rafter can not
be accounted.
• Performance of TRMI with different directions of heat flow path can not be evaluated.
1.1.2. Limitations using hot box method
In hot box method a representative section of actual roof (or wall or floor) structure is insulated with the desired insulation product and U-value of this assembly is measured. Using rotatable box, effect of structure orientation can also be tested. The measured U-value includes all the effects of cold bridging due to rafters and directly provides U-value of the specific structure. However, some of the limitations of this method are
• Structures of restricted dimension (usually up to 1.2m ×1.2m ) can only be tested [9]. • A separate test is needed for each structure.
• Effect of real life factors such as solar radiation, moisture transfer can not be created in
laboratory conditions and therefore, their effect on U-value can not be tested.
1.2. Methodology adopted by Actis to test TRMI
Owing to unavailability of standards and limitations of existing laboratory methods, Actis Re-search and Development unit has come up with its own methodology to test TRMI product. The methodology estimates in situ performance of insulation product in terms of reduction in the energy consumption of a test cell due to installed insulation product when subjected external weather conditions. The methodology involves constructing identical test cells, identical in their size, orientation, construction and differing only in terms of insulation product used, such as one test cell with TRMI, one with conventional block insulation like mineral wool and other without any insulation. These test cells are subjected to external environment and weather parameters such as temperature, wind speed, relative humidity, solar radiation are monitored along with the
6 1. Introduction
energy consumption in each test cell for a period of three to four weeks. During this period inside temperature of each of the test cell is maintained at pre-defined value using heating or cooling devices. Heat fluxes, temperature over test cell surfaces are also recorded during this test period. At the end of test period, comparison of energy consumption in a test cell with insulation product to the energy consumption in a test cell with no insulation directly indicates effectiveness and in-situ, real life performance of the insulation product. Comparison of energy consumption in a test cell with TRMI product to the energy consumption in a test cell with con-ventional insulation such as mineral wool provides a means to compare in situ performance of these two insulation products. Using this methodology it is shown and independently verified that TRMI product “Tri-Iso Super 9” is equivalent to 200 mm of mineral wool insulation [10].
1.3. Problem description and solution methodology
Existing laboratory measurements used for characterizing thermal performance of insulation products do not account for the effects of convection, radiation and phase change. To overcome these limitations, over the last few years, in situ tests are performed by Actis at its test site in Limoux, France. Also larger set of in situ tests are performed under round robin test campaign of year 2008 at different locations in Europe. A large database of measurements is thus available pertaining to real life performance of insulation products under varying meteorological condi-tions and at different geographic locacondi-tions. The possible use of these measurement data sets are
• To find correlation between external weather conditions and thermal performance of TRMI
and conventional insulation products.
• To develop a mathematical model which can be used to predict energy consumption of a
test cell at different locations using local meteorological data.
• To develop mathematical model that can provide U-value of the test cell considering the
external weather conditions.
• To ascertain a performance index for the repeatability of in situ testing methodology
adopted by Actis in terms of performance of the insulation product tested at two different test sites under similar weather conditions.
• To develop a simple but accurate mathematical model that can compute the amount of heat
flux transfer across different test cell components such as roof, gable, etc., and provide effective thermal properties of different materials and air layers constituting the test cell component.
• A technique to account for scaling effects to estimate performance of test cells of different
dimensions could be built into above model.
With dedicated efforts by CEN and EOTA to provide new standards to characterize TRMI prod-uct these data sets thus, represent invaluable information. However, the drawback of in situ measurements is that the measured insulation performance strongly depends on meteorological conditions. The question that is posed is, how one can estimate intrinsic thermal characteristics of the insulation product from these in situ measurements? Efforts in above directions, with the collaboration of Actis Research and Development team, has lead to the development of new mathematical models and software tools to estimate intrinsic performance of insulation prod-ucts and thereby predict energetic performance of test cells. The central theme underlying all
1.4. Summary and outlook 7
these techniques is to estimate intrinsic thermal characteristics of the insulation system from the sequences of characteristic meteorological data of the test site and in situ measurements. In this part of the thesis we discuss in detail, techniques employed such as neural networks (global assimilation process - GAP), classification technique (predictive clustering - PClust) and using one dimensional parametric heat transfer models (SPEC) describing the complex phe-nomena of heat transfer. Numerical results obtained using in situ measurements are shown to be independent of meteorological conditions.
1.4. Summary and outlook
In this introduction, fundamental problem related to the characterization of in situ performance of insulation products is presented. Issues related to the characterization of TRMI products are discussed at length. Limitations of existing methods and standards are discussed and the methodology of in situ testing adopted by Actis Research and Development team is presented. Different possible directions to couple mathematical models and in situ data are detailed. In following chapters the theory behind different techniques developed and their applications are described. The central theme underlying all these techniques is to estimate intrinsic thermal characteristics of the insulation system from the sequences of characteristic meteorological data of the test site and in situ measurements. In situ measurement data is a backbone of all these models. An insight into in situ testing methodology provides the first step towards model and data coupling and therefore, in chapter 2 we present the methodology used to generate in situ measurement data sets. In chapter 3 neural network based meta modeling approach is discussed. The technique is encoded in a software named “Global Assimilation Process (GAP) and is used to predict energy consumption of test cells at different locations. In chapter 4 predictive cluster-ing methodology is developed to estimate U-value of the test cell and to indicate repeatability index for in situ tests. The methodology is proposed to CEN36 workshop as a tool to estimate U-value of the test cells [7]. This contribution has resulted into a software named “PClust”, an abbreviation for predictive clustering. Techniques presented in chapter 3 and 4 are primarily aimed to standardize evaluation procedures for insulation products. Design of new insulation product requires detailed knowledge of heat transfer paths by conduction, convection and radi-ation across constituent layers of the test cell. A technique based on the concept of heat flux balance and parametric heat transfer models is developed to provide quantitative details of heat flux transfer. The technique also accounts for the interaction of test cell envelope with the sur-rounding environment and provides temperature distribution across different constituent layers of the test cell. The formulation of this physics based modeling approach and its application constitute the contents of chapter 5. The technique described is encoded into a software named “Software for Predicting Energy Consumption” (SPEC). Finally comments and possible exten-sions of developed tools are discussed in chapter 6.
2. In situ measurements
In this chapter we present the methodology used to evaluate in situ thermal performance of insulation products. We briefly outline the test setup, different locations, test cells used, and the database which was generated using these tests. The aim is to understand different data sets that are used for mathematical modeling.
2.1. Test methodology
The test methodology involves subjecting two identical test cells, one test cell without any in-sulation product and another containing the inin-sulation products to be tested, to outside weather conditions. Test cells have the same interior and exterior dimensions and are constructed with the same materials (apart from the roof and gable insulation). Test cells are heated in winter and cooled in summer in the same way. The temperature inside the test cell is maintained at the same specified level. The energy needed to maintain these temperatures is monitored and recorded. Along with the power consumption, other parameters like internal temperature, humidity, heat fluxes on walls and floor and external weather conditions are monitored and recorded through-out the testing period. After the test, all test data are reviewed and analyzed with regard to the insulation of the tested constructions. The energy consumption in the test cell with insulation product is compared with the energy consumption in the test cell without the insulation product. The difference between energy consumption of these two test cells indicates the in situ thermal performance of the insulation product [2].
2.2. Description of test cells
During in situ tests performed by Actis, three test cells, with a roof surface area of35 m2, outside
dimensions of 4×7 m2on floor level and height of3 m are constructed. Each cell is built without
windows and there is no ventilation. The roof with inclination of36ois made up of rafter of 8
× 11 cm with spacing of 48 cm between adjacent rafters and has clay tiles. The floor is made
up of wood paving and the under floor gap is over insulated with40 cm of mineral wool. The
access to each test volume is by an airlock in the gable wall and thus the thermal exchange takes place through walls and roof alone. Inside temperature of each cell is maintained using
two fan heater of 1 KW output. The airlock is heated to1oC less than the main cell and acts
as a guard cell. One test cell contains TRMI of ACTIS and other has20 cm of mineral wool
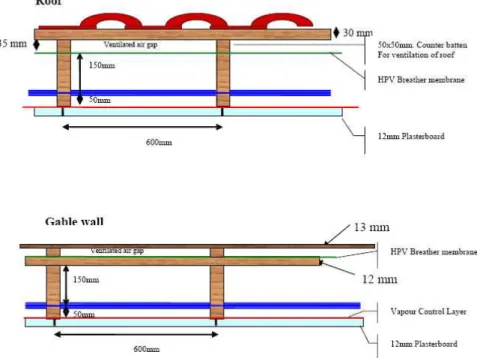
insulation. The third test cell is without any insulation product. The layout of each cell is in accordance with the manufacturer’s instructions [11]. Infra red pictures made outside and inside of the test cells do not reveal any significant differences between each kind of cells. Fig. 2.1 shows layout of the roof, gable and floor of the test cell with multi-foil insulation. Fig. 2.2 shows layout of the roof and gable of the test cell with mineral wool insulation. As evident from Fig. 2.1 and 2.2, air cavity exists between roof tiles and insulation between the rafters. For gables, this air cavity exists between the outer wall of the gable and insulation between the rafters. A breather membrane present in these configurations avoid insulation being directly exposed to the air cavity. The purpose of breather membrane is to allow water vapor from the insulation to
10 2. In situ measurements
Figure 2.1.: Configuration details of the test cell with multi-foil insulation
Figure 2.2.: Configuration details of the test cell with mineral wool insulation
permeate into the surrounding air but to prevent water from the cavity entering the insulation. The vapor control layer present on the innermost surface of the roof and gable prevents the movement of moist air and thus avoids condensation. The floor layout and configuration is same for all test cells and is shown in Fig. 2.3. Material properties of different materials and insulations used in the construction of these test cells are provided in Table 2.1.
2.3. Instrumentation, measurements 11
Figure 2.3.: Configuration details of the test cell floor
Table 2.1.: Details of thermal properties of different materials used in test cell
Material Name Conductivity Surface Emissivity
K (W/moK) ǫ Roof tile 1.15 0.9 Wood 0.15 0.9 Ply-wood 0.15 0.9 Breather membrane - 0.7 Mineral wool 0.04 0.9 Plaster board 0.32 0.9
2.3. Instrumentation, measurements
Each cell is equipped with two temperature sensors located 1.5 m above the floor and placed in an open gray PVC tube to shield them from air movements. Heat flux on the inside surface of the roof and gable walls is measured using heat flux meters. Energy consumption in each test cell is measured by recording current and voltage using calibrated instruments. Fig. 2.4 shows position of different sensors in a typical test cell [10]. Weather parameters namely, outside temperature, relative humidity, wind direction, wind speed and total solar radiation are recorded per minute by a dedicated weather station at the site. Measurements are carried out per second and are stored in the memory of dedicated data logger unit which computes the per minute or per fifteen minute average value of measured quantities and store them. All quality control checks pertaining to instrumentations are made and calibration of all sensors is carried out [11]. Based on these calibration following accuracies are obtained in the measurement of temperature and flux values.
− Temperature measurements on the test cell component surfaces, temperature
measure-ments of inside air of the test cell and outside ambient air temperature measuremeasure-ments are
accurate within±0.1◦C.
− Flux measurements on the test cell components are accurate within 5% of the measured
12 2. In situ measurements
Figure 2.4.: Layout and position of different sensors in a typical test cell
2.4. Database of measurements
Two data sets of measurements, first corresponding to measurements in the winter season of year 2005-2006 and another pertaining to the round robin test campaign in the winter of year 2008 are used in this thesis.
2.4.1. Measurements performed during winter season of year 2005-2006
Measurements during winter season of year 2005-2006 were carried out in test cells located at Limoux, France. The measurement period was spanned from 01-Dec-2005 to 28-Feb-2006. The test cell with TRMI contained “Tri-Iso Super 9 (TS9)” product of Actis. Another test cell contained 200 mm of mineral wool insulation. During the same period identical test cells were built at the test site of TRADA Technology Ltd., an independent certification agency in United Kingdom to characterize TS9 insulation product [10]. Measurements carried out at these two locations constitute the database for the winter season of year 2005-2006. Fig. 2.5 show the schematic layout of the TS9 product and Table 2.2 provides configuration details of the TS9
product. Along with these in situ measurements, meteorological data in terms of ambient
Cotton wadding
Pink foam
Reflective metallic grid
Reflective foil
Figure 2.5.: Schematic layout of TS9 insulation
2.4. Database of measurements 13
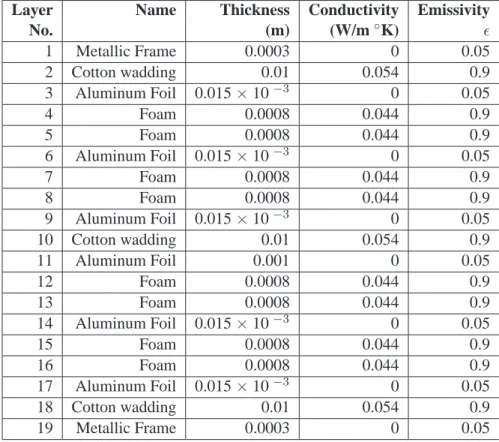
Table 2.2.: Geometrical details and material properties of different layer of TS9 insulation
Layer Name Thickness Conductivity Emissivity
No. (m) (W/m◦K) ǫ 1 Metallic Frame 0.05× 10⁻³ - 0.05 2 Cotton wadding 10× 10−3 0.032 0.90 3 Aluminum Foil 0.075× 10⁻³ - 0.05 4 Foam 0.8× 10⁻³ 0.028 0.90 5 Foam 0.8× 10⁻³ 0.028 0.90 6 Aluminum Foil 0.075× 10⁻³ - 0.05 7 Foam 0.8× 10⁻³ 0.028 0.90 8 Foam 0.8× 10⁻³ 0.028 0.90 9 Aluminum Foil 0.075× 10⁻³ - 0.05 10 Foam 0.8× 10⁻³ 0.028 0.90 11 Foam 0.8× 10⁻³ 0.028 0.90 12 Aluminum Foil 0.075× 10⁻³ - 0.05 13 Cotton wadding 10× 10−3 0.032 0.90 14 Metallic Frame 0.05× 10⁻³ - 0.05
United Kingdom was also collected. The locations selected are Manchester, Norwich, London, Plymouth, Cardiff, Aberdeen, Newcastle and Belfast.
2.4.2. Measurements performed during round robin test campaign of year 2008
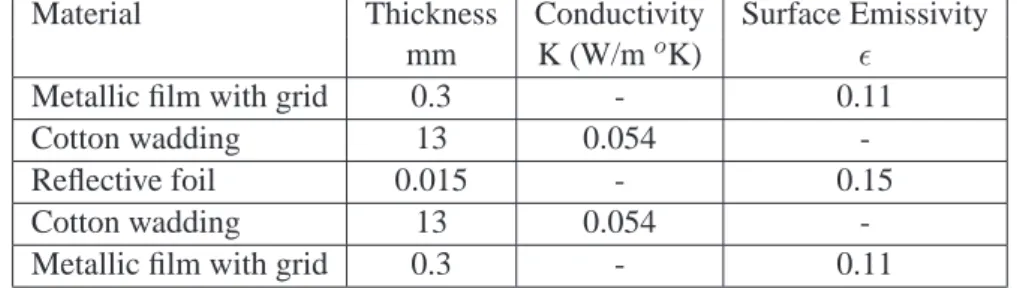
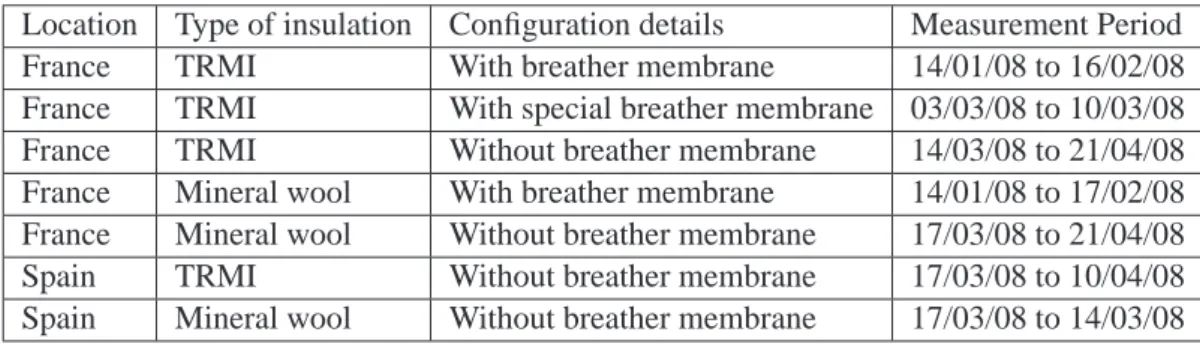
The round robin test campaign in the winter of year 2008 was spanned over 36 weeks starting from 14-Jan-2008 to 21-April-2008. Measurements were carried out in test cells located at dif-ferent locations in Europe, namely, in France, Spain, and Lithuania. As described earlier, three test cells of identical dimensions were built at these sites, one with TRMI, another with mineral wool insulation and third test cell without any insulation. Fig. 2.6 shows schematic layout of the TRMI product used and Table 2.3 provides geometrical details and material properties of this TRMI product. To study the effect of breather membrane on the performance of an insulation,
Cotton wadding
Foam
Reflective foil with metallic grid
Reflective foil
Figure 2.6.: Schematic layout of TRMI product used during round robin test campaign of year 2008
measurements for a period of 2 weeks were carried out by removing the breather membrane from the test cells at each location. A specially designed breather membrane composed of cot-ton wadding and reflective foils was also tested in Limoux, France. The specially designed