HAL Id: hal-01209403
https://hal.archives-ouvertes.fr/hal-01209403
Submitted on 5 Sep 2018
HAL is a multi-disciplinary open access
archive for the deposit and dissemination of
sci-entific research documents, whether they are
pub-lished or not. The documents may come from
teaching and research institutions in France or
abroad, or from public or private research centers.
L’archive ouverte pluridisciplinaire HAL, est
destinée au dépôt et à la diffusion de documents
scientifiques de niveau recherche, publiés ou non,
émanant des établissements d’enseignement et de
recherche français ou étrangers, des laboratoires
publics ou privés.
Effects of the addition of various minerals, proteins and
salts of organic acids on the principal steps of α-lactose
monohydrate crystallisation
Gwénolé Gernigon, Fabien Baillon, Fabienne Espitalier, Cécile Le
Floch-Fouéré, Pierre Schuck, Romain Jeantet
To cite this version:
Gwénolé Gernigon, Fabien Baillon, Fabienne Espitalier, Cécile Le Floch-Fouéré, Pierre Schuck, et al..
Effects of the addition of various minerals, proteins and salts of organic acids on the principal steps of
α-lactose monohydrate crystallisation. International Dairy Journal, Elsevier, 2013, 30 (2), pp.88-95.
�10.1016/j.idairyj.2012.12.005�. �hal-01209403�
Effects of the addition of various minerals, proteins and salts of organic acids on
the principal steps of
a
-lactose monohydrate crystallisation
Gwénolé Gernigon
a,b, Fabien Baillon
c, Fabienne Espitalier
c, Cécile Le Floch-Fouéré
a,b, Pierre Schuck
a,b,*,
Romain Jeantet
a,baINRA, UMR1253, F-35000 Rennes, France
bAgrocampus Ouest, UMR1253, F-35000 Rennes, France
cUniversité de Toulouse, Mines Albi-Carmaux, UMR CNRS 5302, F-81013 Albi, France
a b s t r a c t
To study the effects of whey constituents on lactose crystallisation, a model based on population balance and taking into account mutarotation was implemented. Outputs were the nucleation constants (B0, kn0) and the growth rate constants (kg0, g0). Batch crystallisation of a lactose solution (70 g 100 g!1water) was studied with and without addition of various organic acids, salts, galactose and proteins. Kinetics and crystal size distributions were monitored using refractometry and laser light scattering. Factorial analysis of the results highlighted that the presence of organic acids (lactate, citrate) leads to faster crystallisation and confirmed the fact that whey proteins are slowing down the crystal growth step. The results of this study make a contribution towards a better understanding of lactose crystallisation.
1. Introduction
The dairy industry has to process huge amounts of whey each year. For example, the European production of cheese in 2010 was 8.533 million tonnes (FIL-IDF, 2011), corresponding to roughly 77 million tonnes of liquid whey. Because of environmental and eco-nomic considerations, as well as potential benefits for health, whey is no longer considered a waste product (Smithers, 2008). It is therefore of the utmost importance to process whey properly to supply the ingredient market with high quality products. However, whey is not an easy product to process. In fact, it contains a great deal of free water, lactose, soluble proteins and varying amounts of minerals, especially calcium, phosphate and various monovalent ions. If lactose is not properly crystallised, whey cannot be spray dried correctly without a reduced flow rate and decreased func-tional properties of the powder. Unfortunately, whey composition is highly variable (De Wit, 2001;Gernigon, Piot, Beaucher, Jeantet, & Schuck, 2009), which makes it difficult to anticipate in process optimisation for further processing.
Crystallisation of
a
-lactose has been studied and reviewed by several authors, in particularHaase and Nickerson (1966),Hartel (2001),Hartel and Shastry (1991),Nickerson and Moore (1974),Twieg and Nickerson (1968)andVisser (1980,1982,1984,1988). More recently Mc Leod, Paterson, Jones, and Bronlund (2011)
studied the nucleation mechanisms of
a
-lactose andWong, Bund, Connelly, and Hartel (2010) modelled the continuous crystal-lisation ofa
-lactose through artificial neural networks.Lactose crystallisation consists of a set of complex reactions that strongly depend on the experimental conditions used (tempera-ture, agitation, supersaturation). The three fundamental steps in
a
-lactose crystallisation in aqueous solutions are nucleation, crystal growth and mutarotation. These steps were often studied sepa-rately in the past, with certain simplifications with regard to the other steps (e.g., non rate-limiting mutarotation). Considerable improvement in the understanding of this phenomenon was ach-ieved following the publication byMimouni, Schuck, and Bouhallab (2009)of a kinetic model combining the different stages of lactose crystallisation. It was demonstrated that lactose crystallisation may depend on the mutarotation step, a fact that has been debated for many years. However, its high number of degrees of freedom limits this model, especially when there are few input measurements, as in the present study. It is therefore difficult to rely on the various constants whose value may vary according to the adjustment sequence chosen.In our study we developed a new model based on crystallisation theory and on this model for mutarotation, first by applying pop-ulation and material balances, and secondly by using model solu-tions to study crystallisation experimentally.
*Corresponding author. Tel.: þ33 22 3485322. E-mail address:pierre.schuck@rennes.inra.fr(P. Schuck).
2. Materials and methods 2.1. Reagents and solutions 2.1.1. Reagents
As part of an industrial study about mozzarella whey, the studied compounds were chosen to be representative of the composition of mozzarella whey as determined byGernigon et al. (2009). Labora-tory grade alpha-lactose monohydrate (VWR, Fontenay-sous-Bois, France) was used for the preparation of the supersaturated solu-tion. Pharmaceutical lactose (Asmar, Meulan, France) was used for preparation of the dispersing solution for scattering.
Anhydrous calcium chloride, galactose and calcium lactate pentahydrate were provided by Sigma Aldrich (Lyon, France), and lactic acid (90%), trisodium citrate tetrahydrate, hydrochloric acid (32%), potassium chloride, sodium hydroxide and ammonia by VWR. The whey protein isolate (WPI) used was Prolacta!(Lactalis, Retiers, France). WPI was glycated (lactosylated or galactosylated) by a dry method for 48 h at 50#C following the method ofMorgan
et al. (1999). Reverse osmosis water was used for the preparation of all solutions.
2.1.2. Supersaturated solutions
The solution of lactose was prepared in the 1 L unbaffled glass vessel (10 cm diameter) by dissolving 280 g anhydrous lactose in 400 g water at 70#C, corresponding to a supersaturation ratio (S) of
2.7 at 30#C (S ¼ C
a
/Ca
eq). This supersaturation ratio is sufficientlyhigh to induce non-seeded crystallisation, but low enough to observe differences. The solution was heated on a steel plate until a clear solution was obtained. It was then cooled in a water bath at 30#C and held for 15 min without agitation and the constituent to be
studied was added at the desired concentration below its solubility before beginning the experiment. Agitation was then commenced and time zero (t0) defined. The impeller was vertically and centrally
mounted in the vessel. Agitation was provided by a marine-like impeller (diameter: 4.5 cm) driven at 600 % 5 rpm by a 16 W po-wer electric motor (Eurostar digital, IKA-Werke, Staufen, Germany). This stirring rate permits the maintenance of crystals in suspension during the operation without vortex formation. The volume of the initial solution was 600 mL. About 50 mL of suspension was sampled at the upper part of the vessel during the experiment for the refractometry and size distribution measurements; the final volume was thus about 550 mL.Table 1shows the composition, pH and the number of replicates of the different solutions studied. The solution of lactose without additives was chosen as the reference.
2.2. Refractometry measurements: calibration curve
Standard solutions were prepared, each with a constant additive concentration and increasing lactose concentration. For example, six standard solutions were prepared for lactic acid calibration. Each of these solutions contained 5 g lactic acid 100 g!1water, but
20, 30, 40, 60, 70 and 80 g lactose 100 g!1water, respectively. The
calibration consisted of placing these standard solutions in the same conditions as the experimental solution (30#C) and
meas-uring the refractive index (#Brix) for each of them. A Pal-
a
digitalrefractometer (0e85#Brix; Atago, Tokyo, Japan) was used for all the
refractometry measurements. Assuming there was no precipitation of additive during crystallisation, and knowing the lactose concentrations of the standard solutions, an hyperbolic curve was obtained, as in previous work byMimouni, Schuck, and Bouhallab (2005), which permitted conversion of the refractometry results to concentrations (g 100 g!1water). For example, for lactic acid
calibration, the R-square of the fit was 0.99 and the equation obtained was:
Concentration!g 100 g!1water"
¼ !24 þ 23=!1 þ 3:98:10!3*Brix"ð!1=0:1Þ
2.3. Particle size distribution measurements
The particle size distribution of
a
-lactose monohydrate crystals resulting from the crystallisation process was determined by laser light scattering at ambient temperature using a MasterSizer 2000 (Malvern Instruments, Malvern, UK) equipped with a 5 mW HeeNe laser operating at a wavelength of 633 nm. A slightly supersatu-rated solution (29 g 100 g!1 water lactose) was prepared as thedispersing medium for laser light scattering, to avoid dissolution of lactose crystals in the measurement cell (Mimouni et al., 2005). The slurry collected from the crystallisation experiment was added directly into 100 mL of the slightly supersaturated lactose solution in the measurement cell of the apparatus to reach 8% obscuration. The refractive indices used for solvent and particles were 1.37 and 1.53, respectively. From the size distribution, different particle di-ameters were calculated: the mean volume diameter d(4,3) and the mean-surface diameter d(3,2).
2.4. Model
2.4.1. Population balance
For a closed system with a constant volume V, the population balance necessary to describe the transient particle size distribu-tion in a constant volume, isothermal and well mixed crystalliser
Table 1
Description of the solutions.a
Solution Initial pHb FinalpHb Additives c n replicates 0 3.40 n.d. e 5 1 5.80 6.70 Sodium hydroxide (1.0) 3 2 3.50 n.d. Galactose (9.0) 4 3 5.74 6.94 Galactose (9.0) þ sodium hydroxide (0.01) 1 4 2.37 2.73 Hydrocholoric acid (0.04) 2 5 2.10 n.d. Lactic acid (5.0) 3 6 2.67 2.58 Lactic acid (0.5) 2 7 4.10 n.d. Lactic acid (1.0) þ calcium
lactate (5.0)
3 8 6.41 6.45 Lactic acid (1.0) þ calcium
lactate (5.0) þ sodium hydroxide (1.0)
2 9 5.24 5.39 Calcium lactate (1.0) þ sodium
hydroxide (0.1)
2 10 5.48 n.d. Lactic acid (6.0) þ sodium
hydroxide (6.0)
3 11 5.01 5.07 Lactic acid (1.0) þ sodium
hydroxide (0.6)
1 12 7.56 7.53 Sodium citrate (13.0) 6 13 7.19 7.16 Sodium citrate (1.0) 1 14 4.50 5.12 Calcium chloride (3.0) 3 15 5.82 6.29 Calcium chloride (3.0) þ sodium
hydroxide (0.01)
2 16 3.49 4.07 Potassium chloride (2.0) 3 17 n.d. n.d. Ammonia (1.0) 3 18 6.50 6.49 Whey protein isolate (5.0) 1 19 6.50 6.49 Whey protein isolate (5.0)
þ galactose (9.0)
1 20 n.d. n.d. Galactosylated whey protein
isolate (5.0)
1 21 6.10 5.93 Lactosylated whey protein
isolate (5.0) 1
aAll solutions made using 70 g lactose 100 g!1water. b n.d., not determined.
without agglomeration and breakage is presented in Eq. (1) (Mersmann, 1995). v vtðnðLÞÞ ¼ J _
d
ðL ! LcÞ ! d dL ðG nðLÞÞ (1)where n(L) is the population density of lactose crystals (#m!1m!3),
Lthe particle size (m), J the nucleation rate (#m!3s!1), G the crystal
growth rate (m s!1), L
Cthe nucleus size (m).
d
is the Dirac function,and has the following characteristic values:
if L ¼ Lcthen
d
ðL ! LcÞ ¼ 1if LsLcthen
d
ðL ! LcÞ ¼ 0Thus, the population balance takes into account the different phenomena involved (nucleation, crystal growth) in the course of crystallisation.
This general formula has to be revised to take into account the moments to have access to the experimental values by assuming a growth rate independent of size. Expression of the moment of j order
m
jis provided in Eq.(2):m
j ¼ZN 0
n LjdL (2)
Equation (3) provides expression of the population balance depending on the moments for a constant suspension volume (Mersmann, 1995): v vt !
m
j " ¼ 0j$J þ j$G$!m
j!1" (3)On the basis of the population balance provided by Eq.(3), we can establish the differential equations transformed in terms of moments of order zero to four. Assuming that there is no agglom-eration or breaking, the population balance in the closed vessel can be expressed by the differential equations of nucleation (Eq. (4), j ¼ 0) and growth (Eq.(5); 0 < j < 4):
v vtð
m
0Þ ¼ J (4) v vt !m
j " ¼ jGm
j!1 (5)The mean volume diameter (
m
m) is calculated from the mo-ments of order 3 and 4:d # 4; 3 $ ¼
m
m
4 3 (6) 2.4.2. Material balancesThe change in solute concentration is calculated from the mass balance on the lactose, expressed by:
Accumulation þ rates of mutarotation reaction þ transfer rate between phases
¼ 0
The reactions involved for
a
-lactose in solution are the muta-rotation reactions and the transfer between phases corresponding to crystallisation: dCa dt ¼ 1 mwater % Ca # 1 !R1 L $ !R1 L &f
vr
lactoseVdm3 dt !k1$Ca þ k2$Cb (7)where RL is the ratio between the molar masses of respectively
hydrated lactose and anhydrous lactose, Caand Cbthe
concentra-tions in
a
- andb
-lactose respectively (g 100 g!1water), m waterthewater mass (g),
f
vthe volume shape factor (!),f
lactosethe olumicmass of lactose (g m!3), V the volume of solution (m3), C
a
eqthea
-lactose concentration at equilibrium (g 100 g!1water) and k 1and k2
the mutarotation constants (s!1)
dCb dt ¼k1$Ca! k2$Cbþ Cb#1 !R1 L $ mwater
f
vr
lactoseV dm3 dt (8)The change in mass of water (hydrated lactose crystal) is expressed by: dmwater dt ¼ ! # 1 !R1 L $
f
vr
lactoseVdm3 dt (9)The total lactose concentration in the solution is expressed by
C ¼ Caþ Cb (10)
where C is the total lactose concentration (g. 100 g!1water) which
can be measured.
2.4.3. Expression of the kinetic constants
In addition, we chose classical laws to express homogeneous primary nucleation kinetic (Eqs(11) and (12)) and growth rate ki-netics (Eq.(13)) J ¼ kn0$exp# !B0 ln# Ca Ca;eq $$2 (11) with B0 ¼
f
v$Vm2$g3 ðk$TÞ3 (12)where Vmis the molecular volume of lactose (m3),
g
the surfaceenergy crystal/solution (J m!2), k the Boltzmann constant
(1.38 ( 10!23J K!1), T the temperature (K), B
0the nucleation
con-stant (!) and kn0the nucleation rate constant (nuclei m!3 s!1).
The last two parameters are identified.
We assume lactose solubility as constant in the model, as the final concentrations of our experiments were quite similar. How-ever further studies are required to check this assumption asSmart (1988)had shown that some effect on solubility were possible. At 30#C, an
a
-lactose solubility of 11.28 g 100 g!1water was used inthe model (Mimouni et al., 2009).
G ¼ kg0'Ca! Ca;eq(g0 (13)
where kg0is the growth rate constant (m s!1) and g0the growth
rate order (!). The last two parameters are identified. 2.5. Results of fitted parameters
The four parameters, kn0, B0, kg0and g0, were estimated from the
experimental data (concentration and mean volume diameter) by minimisation of a scalar function. The functions fminsearch and
ode45 of MATLAB!software (2011a, The MathWorks, Natick, MA, USA) were used respectively to find the minimum of a scalar function depending of kn0, B0, kg0and g0variables, and to solve the
systems of eight differential Eqs. (4)e(8). The scalar function minimised was: f ¼npointsX j ¼ 1 !Cj;cal! Cj;exp "2 'C j;exp(2 ! þ 'd cal'4; 3(! dexp'4; 3((2 'd exp'4; 3((2 (14)
All points of lactose concentrations are chosen to define this function and only one point is used for the mean volume diameter. The mean volume diameter observed on the final plateau was taken (Fig. 1).
The quality of the fit was assessed through the mean standard deviation (MSD), on the concentration and mean volume diameter
d(4,3) values. Results of the model and quality of the fit are reported inTable 2.
Fig. 1shows the experimental data (total concentration of lac-tose (a) and mean volume diameter (a)) and the predicted results for the reference. We can observe a good agreement between experimental data and predicted results. Fig. 2 presents the experimental data and the predicted results for the reference for the solution having the worse fit on concentration (MSD ¼ 26.44). This result is due to the high dispersion of experimental points between two independent experiments. Despite this, an adequate agreement it is observed for all experiments treated. The output variables of the system are J and G, corresponding to the kinetics of nucleation and crystal growth, respectively, and linked to the fitted parameters (kinetics constants kn
0and B0for nucleation, and kg0
and g0for crystal growth). J and G decline during the crystallisation
process, as a result of crystal formation, and therefore the initial values of these rates (Ji and Gi) were retained as variables for
analysis of the results. Moreover, two interesting parameters were
Fig. 1. Fit of the model on solution 0 (reference) regarding (a) the concentration (g 100 g!1water; MSD ¼ 2.47 ( 10!3) and (b) the mean volume diameter (mm; MSD ¼ 3.76 ( 10!2):
B, experimental data; d, calculated values for total concentration and mean volume diameter; $$$$, concentration ofb-lactose (g 100 g!1water); - - -, concentration ofa-lactose
(g 100 g!1water).
Table 2
Fitted parameter values [kn0(nuclei m!3s!1), B0(!), kg0(m s!1) and g0(!)], interface tension crystal/solutiong(J m!2),b/aratio and kinetic rate values [Ji(nuclei m!3s!1) and Gi
(m s!1)] as well as the quality of the fit by the model, using mean standard deviation (MSD).
Solution kn0 ( ( 10!8) B0 kg0 (m s!1) ( ( 107) g0 g (J m!2) ( ( 103) b/a Ji (#m!3s!1) ( ( 10!7) Gi (m s!1) ( ( 108) MSD on concentration C ( ( 103) Number of points (Concentration) MSD on diameter d43 ( ( 102) Number of points (diameter) 0 7.86 4.90 2.06 1.48 5.22 2.02 1.95 1.71 2.47 91 3.76 109 1 1.65 2.84 1.59 1.29 4.35 2.13 2.02 1.86 7.98 61 3.11 69 2 4.31 3.72 2.89 1.64 4.76 2.02 2.59 1.82 3.11 107 3.79 130 3 5.27 3.99 2.17 1.43 4.88 2.11 2.63 1.99 3.51 26 5.25 36 4 3.54 4.66 1.42 1.30 5.13 2.01 1.10 1.62 7.53 90 2.74 48 5 1.06 5.84 1.18 1.01 5.53 2.27 1.39 2.21 2.26 105 4.09 87 6 2.91 3.70 2.09 1.36 4.75 2.13 1.83 2.15 3.36 50 3.25 68 7 7.29 2.92 2.10 1.17 4.40 2.56 8.11 2.93 6.02 53 1.06 73 8 6.09 3.26 3.29 1.32 4.56 2.49 5.37 3.61 2.63 67 1.43 63 9 3.43 2.41 3.02 1.61 4.12 2.15 5.68 2.06 1.67 58 3.72 63 10 5.87 2.81 1.89 1.21 4.34 2.43 7.02 2.47 3.45 70 1.44 64 11 7.06 4.01 2.34 1.52 4.88 2.08 3.48 1.82 2.25 41 4.23 32 12 6.49 3.50 1.32 0.84 4.67 2.90 4.79 3.22 4.48 108 2.04 148 13 9.63 3.62 1.18 0.97 4.72 2.57 6.41 2.33 3.45 17 2.34 24 14 19.0 4.97 6.01 1.81 5.25 2.15 4.63 2.88 3.68 68 0.87 102 15 17.6 6.16 3.17 1.49 5.63 2.15 1.92 2.68 2.13 47 1.66 63 16 1.36 1.77 9.17 2.06 3.72 2.07 3.62 2.90 6.56 88 2.74 71 17 20.5 5.18 0.68 1.06 5.32 2.14 4.32 1.16 26.4 45 4.26 61 18 4.80 2.49 2.27 1.69 4.17 2.03 7.48 1.34 3.57 23 3.85 32 19 7.08 3.29 7.69 2.29 4.57 1.93 5.87 1.64 18.2 23 8.80 31 20 6.80 2.41 2.73 1.93 4.12 1.85 7.65 0.82 9.29 13 5.31 18 21 1.82 1.89 1.77 1.50 3.80 2.01 4.02 1.32 10.5 20 3.76 32
retained, i.e., the surface energy between crystal and solution, deduced from the B0, and the maximum
b
-lactose/a
-lactose ratio,corresponding to the maximum consumption of
a
-lactose.2.6. Statistical analyses
The complete data set was analysed using principal components analysis (PCA). The general principles of this multivariate statistical technique have been described in detail elsewhere (Jollife, 2002). PCA was applied to the whole set of 22 crystallisation experiments, after centreing (average subtraction) and scaling. The reference was placed as illustrative individual, i.e., not taking part in the con-struction of the factorial map. The active variables of the PCA were B0, kn0,
g
, Ji, kg0, g0, Giandb
/a
. Hierarchical clustering on principalcomponents (HCPC) was performed, to highlight similarities be-tween groups of individuals (Husson, Josse, & Pagès, 2010) using Ward’s algorithm, which consists of aggregating two clusters such
that the growth of within-inertia is minimum at each step of the algorithm. The within inertia characterises the homogeneity of a cluster. The hierarchical clustering is performed onto the principal components. Similarly the paragons of each cluster were calculated. Main paragons are individuals closest to the centre of a class, regarding all their coordinates in the variable space. Statistical analyses were performed using the Rcmdr package version 1.6-0 (Fox, 2005) of R software version 2.11.1 (R Development Core Team, 2010). PCA and HCPC were done using the FactoMineR package, version 1.14 (Husson, Josse, Le, & Mazet, 2010). Differences between the clusters standardised values for each parameter were checked by analysis of variance (ANOVA) at a threshold of 0.05 performed using the Rcmdr package.
3. Results and discussion
3.1. General considerations about the factorial map
The factorial map (Fig. 3for projection of variables andFig. 4for projection of individuals) summarises about 65% of the total inertia, which is satisfactory considering the number of active individuals (21) and variables (8). It means that the loss of initial information is only 35% while projecting a 21 dimension space (variables) or an 8 dimension space (individuals) on the 2 dimensions of the factorial map. The other significant components (component 3: 18% inertia and component 4: 13% inertia) were also analysed but did not add sufficient information.
3.2. Factor interpretation (based on the correlation circle and the correlation matrix)
Fig. 3displays the correlation circle (projection of the variables on the factorial map). The correlations between the variables are shown by the angle between their projections in the circle. High correlations will result in alignment of the vectors. The quality of the projection is shown by the proximity of the vector to the circle. The first principal component is correlated with B0and
g
(86% and 88%,respectively). It can thus be considered that this axis displays in-dividuals according to their behaviour regarding nucleation. How-ever g0, which is the order of the growth reaction, is also correlated
with this axis (!75%), showing the complexity of crystallisation, which is composed of two interdependent stages. The second principal component is correlated with the maximum
b
/a
ratio (!83%), which can be viewed as a mutarotation imbalance inducedFig. 2. Fit of the model on solution 17 (worst fit) regarding the concentration (a) (MSD ¼ 2.64 10!2) and the diameter (b) (MSD ¼ 4.26 ( 10!2): B, experimental data; d, calculated
values for total concentration and mean volume diameter; $$$$, concentration ofb-lactose (g 100 g!1water), - - -, concentration ofa-lactose (g 100 g!1water).
-1.0 -0.5 0.0 0.5 1.0 -1.0 -0.5 0.0 0. 5 1.0 1stprincipal component (38.65%) 2 nd )% 49. 52( tn en op mo cl api cni rp kn0 B0 Ji 0 kg0 g0 Gi β/α
Fig. 3. Correlation circle of the principal components analysis (PCA) performed on the crystallisation experiments (Table 1). The correlations between the variables are shown by the angle between their projections in the circle. High correlations will result in alignment of the vectors. The quality of the projection is shown by the proximity of the vector to the circle.
by the consumption of
a
-lactose during crystallisation, and thus as the limit of the mutarotation reaction. To summarise, the first principal component tends to scatter individuals through their behaviour in nucleation (which is correlated with the crystal/solu-tion interface tension) and the second principal component through theira
-lactose consumption (which is correlated with the kinetics). To have a complete vision of the correlations between the variables, it is important to comment on the correlation matrix (Table 3). The most significant correlation link B0andg
, which is easily explainedby Eq.(12), and kg0and g0, the pair of growth constants (Eq.(13)). It
should also be noted that Giis almost twice as highly correlated to
the maximum
b
/a
ratio than Ji, which is a confirmation that crystalgrowth consumes more
a
-lactose than nucleation.3.3. Analysis of the clusters originating from the hierarchical clustering on principal components
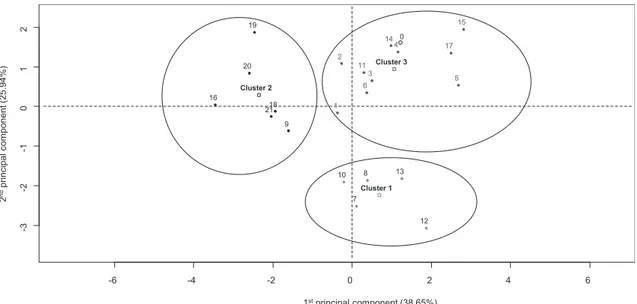
Fig. 4displays the projection of individuals on the factorial map following their similarities with the geometrical centres of the clusters formed by HCPC also projected.Table 4details the differ-ences between the three clusters, showing their standardised mean values for the different kinetics. The standardised values of the first three paragons of each cluster are given to discuss the composition of the clusters (Table 4); paragons are the solutions that are closest to the centre of a cluster, and thus those which are the most
representative of the cluster. In addition, the experimental kinetics and scattering results of the blank (lactose pH3) are compared to those of the first paragon of each cluster (Fig. 5).
3.3.1. Cluster 1
Cluster 1 is clearly different from the other two clusters. It presents a highly negative score for factor 2 and a score close to zero for factor 1 (Fig. 4). Considering its high mean standardised values for Jiand Gi, it can be clearly interpreted as a “fast
crystal-lisation” cluster both for nucleation and crystal growth, respec-tively. These fast crystallisation kinetics led to the formation of many small sized crystals, as shown by the standardised values of this cluster (especially those of the paragons), complemented by the crystal growth curve (Fig. 5). The main paragon of cluster 1 (solution 7) had a shorter induction time than the blank, as shown in the left graph ofFig. 5. It resulted in the formation of smaller crystals, as shown in the right graph ofFig. 5. However, the crystal growth rate of solution 7 was higher than that of the blank.Smart (1988)made a study in a similar fashion of the effects of various additives commonly found in whey on lactose crystallisation. It was
-6 -4 -2 0 2 4 6 -3 -2 -1 0 1 2 1stprincipal component (38.65%) 2 nd )% 49. 52( tn en op mo cl api cni rp 16 20 19 2118 9 1 2 10 7 11 6 8 3 14 4 13 12 17 5 15 Cluster 2 Cluster 3 Cluster 1 0
Fig. 4. Individual graph with hierarchical clustering on principal components. The individuals are projected in the factorial map following their similarities and the geometrical centres of the clusters are also projected. The designation of the individuals corresponds to the designation of the solutions inTable 1.
Table 3
Linear correlations between variables of interest.a
Variable B0 Ji g kg0 g0 Gi b/a kn0 0.62 !0.08 0.56 0.16 0.17 !0.04 !0.09 B0 !0.63 0.98 0.17 0.03 !0.10 !0.13 Ji !0.68 !0.13 !0.07 0.34 0.36 g 0.15 0.00 !0.08 !0.10 kg0 0.89 !0.02 !0.44 g0 !0.16 !0.69 Gi 0.60 b/a aVariables: k
n0(nuclei m!3s!1) and B0(!) are the nucleation constants; Ji(nuclei
m!3s!1) is the nucleation rate; k
g0(m s!1) and g0(!) are the constants related to
crystal growth; Gi(m s!1) is the crystal growth rate;gis the interface tension
crystal/solution (J m!2); b/a(!) is the maximal ratio between b-lactose and
a-lactose.
Table 4
Description of the clusters by their mean and their 3 first paragons, i.e., the 3 individuals closest to the centre of each cluster.a
Standardised Ji Standardised g Standardised Gi Standardised b/a Blank !1.05 1.03 !0.58 !0.70 Cluster 1 mean 0.94a !0.27a 1.13a 1.59a Solution 7 1.75 !0.53 1.15 1.46 Solution 10 1.25 !0.65 0.50 0.97 Solution 13 0.97 0.08 0.30 1.53 Cluster 2 mean 0.66a !1.12b !0.61b !0.73b Solution 9 0.64 !1.05 !0.08 !0.16 Solution 18 1.46 !0.96 !1.10 !0.66 Solution 20 1.54 !1.05 !1.82 !1.35 Cluster 3 mean !0.79b 0.73c !0.18b !0.32b Solution 3 !0.74 0.38 !0.18 !0.31 Solution 11 !0.36 0.39 !0.42 !0.43 Solution 6 !1.11 0.15 0.05 !0.26
aThe superscript letters shows the results of the ANOVA between the clusters
(p ¼ 0.05). Ji(nuclei m!3s!1) is the nucleation rate, Gi(m s!1) is the crystal growth
rate,gis the interface tension crystal/solution (J m!2) andb/a(!) is the maximal
demonstrated that lactates and phosphates as well as a pH higher than 6 may accelerate lactose crystallisation. Moreover the accel-erator effect of phosphates on crystallisation was hindered in the presence of calcium. CitingModler and Lefkovitch (1986), Smart concluded that whey concentrates should be crystallised at the highest pH possible. Our study confirms these conclusions. Indeed, we observed that lactates and citrates were clearly separated from the other additives in terms of their crystallisation kinetics. More-over, our results concerning calcium chloride were similar to those of the blank (solution 0), also confirming his results as he did not report any significant effect in the presence of calcium chloride. 3.3.2. Cluster 2
Cluster 2 contained all the experiments involving whey pro-teins. This cluster displayed low values for crystal growth kinetics. Comparison of the desupersaturation of the main paragon of this class and the blank shows clearly that, despite inhibition of crystal growth, lactose solutions with added whey proteins and related products have faster overall kinetics than lactose solutions without any additive, due to the more rapid nucleation rates (higher Ji) of
the members of class 2. These results confirm the previous work of
Mimouni et al. (2005), which studied the crystallisation of lactose in the presence of proteins using a similar protocol, and showed that the addition of whey proteins did not affect the global kinetics, but did hinder crystal growth.
3.3.3. Cluster 3
Cluster 3 contained all the solutions that had neither rapid global kinetics nor low interface tension between crystal and so-lution. It was the largest cluster and it can also be viewed as a ‘blank’ cluster. In fact, while performing the same PCA with the blank as an active individual, the blank was the paragon of this cluster. Thus solutions present in this cluster were not very differ-ent from the reference.
4. Conclusion
This study presents a new approach to modelling of lactose crystallisation in dairy solutions. Through a systematic assay of
different kinds of model solutions it confirmed previous research published on this topic by several authors. A new model describing lactose crystallisation was developed. It takes into account the dif-ferent phenomena occurring during lactose crystallisation (nuclea-tion, crystal growth, mutarotation) by a moment population balance method. This method works in a single step, and is assessed by a non-linear least squares method, giving very reliable values for each parameter. This model was applied to the experimental results of crystallisations performed at a constant lactose/water ratio, with addition of varying amounts of organic and mineral constituents commonly found in whey. Our study provides new understanding by analysing more closely the specificity of the influence of the con-stituents on crystallisation through a model adjusting the crystal-lisation constants in one single step. Moreover it shows that lactate and citrate have an accelerating effect, in particular on crystal growth. Acknowledgements
This study was part of a research project supported by Lactalis Ingredients (Bourgbarré, France), Herbignac Cheese Ingredients (Herbignac, France) and GEA-Process Engineering France (St Quentin en Yvelines, France). The authors are very grateful for their financial support and the many fruitful discussions. The authors want to thank also Florence Rousseau for her precious help during the experiments.
References
De Wit, J. N. (2001). Lecturer’s handbook on whey and whey products (1st ed.). Brussels, Belgium: European Whey Products Association.
FIL-IDF. (2011). The world dairy situation 2011. Bulletin of the International Dairy Federation 451. Brussels, Belgium: International Dairy Federation.
Fox, J. (2005). The R Commander: a basic statistics graphical user interface to R. Journal of Statistical Software, 14, 1e42.
Gernigon, G., Piot, M., Beaucher, E., Jeantet, R., & Schuck, P. (2009). Physicochemical characterization of mozzarella cheese wheys and stretchwaters in comparison with several other sweet wheys. Journal of Dairy Science, 92, 5371e5377. Haase, G., & Nickerson, T. A. (1966). Kinetic reactions of alpha and beta lactose. ii.
crystallization. Journal of Dairy Science, 49, 757e761.
Hartel, R. (2001). Crystallization in foods (1st ed.). Gaithersburg, MD, USA: Aspen Publishers.
Hartel, R., & Shastry, A. (1991). Sugar crystallization in food products. Critical Re-views in Food Science and Nutrition, 30, 49e112.
Time (h) )r et a w g0 01/ g( noit ul os eht ni noit art ne cn oc es otc aL 0.0 2.2 4.4 6.6 8.8 11.0 20 35 50 65 80 Blank (solution 0) Cluster1 (solution 7) Cluster 2 (solution 9) Cluster 3(solution 3) Time (h) D( 4, 3) (µ m ) 0.0 2.2 4.4 6.6 8.8 11.0 20 60 100 140 180 Blank (solution 0) Cluster1 (solution 7) Cluster 2 (solution 9) Cluster 3(solution 3) La c tos e c onc e ntr a ti o n i n t he s ol u ti o n (g 1 0 0 g -1 wa t e r ) d( 4, 3) ( µ m )
Fig. 5. Comparison of experimental kinetics of main paragons of each cluster and blank. Main paragons are individuals closest to the centre of the class. Panel a, plot of the corresponding desupersaturation experimental curves (g 100 g!1water concentration); panel b, plot of the corresponding d(4,3) (mm) experimental curves: B, blank (solution 0); þ,
Husson, F., Josse, J., Le, S., & Mazet, J. (2010). FactoMineR: Factor analysis and data mining with R. R package version 1.14.http://CRAN.R-project.org/package¼FactoMineR. Husson, F., Josse, J., & Pagès, J. (2010). Principal component methods e Hierarchical
clustering e Partitional clustering: Why would we need to choose for visualizing data?. Technical report-Agrocampus. Available at: http://factominer.free.fr/
docs/HCPC_husson_josse.pdf.
Jolliffe, I. T. (2002). Principal component analysis. New York, NY, USA: Springer Verlag. Mc Leod, J., Paterson, A. H. J., Jones, J. R., & Bronlund, J. E. (2011). Primary nucleation of alpha-lactose monohydrate: the effect of supersaturation and temperature. International Dairy Journal, 21, 455e461.
Mersmann, A. (1995). Crystallization technology handbook (1st ed.). New York, NY, USA: Marcel Dekker, Inc.
Mimouni, A., Schuck, P., & Bouhallab, S. (2005). Kinetics of lactose crystallization and crystal size as monitored by refractometry and laser light scattering: effect of proteins. Lait, 85, 253e260.
Mimouni, A., Schuck, P., & Bouhallab, S. (2009). Isothermal batch crystallization of alpha-lactose: a kinetic model combining mutarotation, nucleation and growth steps. International Dairy Journal, 19, 129e136.
Modler, H. W., & Lefkovitch, H. P. (1986). Influence of pH, casein, and whey-protein denaturation on the composition, crystal size, and yield of lactose from con-densed whey. Journal of Dairy Science, 69, 684e697.
Morgan, F., Mollé, D., Henry, G., Vénien, A., Léonil, J., Peltre, G., et al. (1999). Gly-cation of bovineb-lactoglobulin: effect on the protein structure. International Journal on Food Science and Technology, 34, 429e435.
Nickerson, T. A., & Moore, E. E. (1974). Factors influencing lactose crystallization. Journal of Dairy Science, 57, 1315e1319.
R Development Core Team. (2010). R: A language and environment for statistical computing. Vienna, Austria: R Foundation for Statistical Computing, ISBN 3-900051-07-0, URL:http://www.R-project.org/.
Smart, J. B. (1988). Effect of whey components on the rate of crystallization and solubility ofaelactose monohydrate. New Zealand Journal of Dairy Science and Technology, 23, 275e289.
Smithers, G. W. (2008). Whey and whey proteins e from ‘gutter-to-gold’. Interna-tional Dairy Journal, 18, 695e704.
Twieg, W. C., & Nickerson, T. A. (1968). Kinetics of lactose crystallization. Journal of Dairy Science, 51, 1720e1724.
Visser, R. A. (1980). A natural crystal growth retarder in lactose. Netherlands Milk and Dairy Journal, 34, 255e275.
Visser, R. A. (1982). Growth of non-ionic lactose at various temperatures and su-persaturations. Netherlands Milk and Dairy Journal, 36, 167e193.
Visser, R. A. (1984). Experiments for tracing growth retarders in lactose. Netherlands Milk and Dairy Journal, 38, 107e133.
Visser, R. A. (1988). Crystal growth retarding of alpha-lactose hydrate by sugar phosphates e a continued study. Netherlands Milk and Dairy Journal, 42, 449e468.
Wong, S. Y., Bund, R. K., Connelly, R. K., & Hartel, R. W. (2010). Modeling the crys-tallization kinetic rates of lactose via artificial neural network. Crystal Growth and Design, 10, 2620e2628.


![Risiko- & [und] Schutzfaktoren der psychischen Gesundheit humanitärer Einsatzhelfer : eine systematische Literaturübersicht](data:image/gif;base64,R0lGODlhAQABAIAAAP///wAAACH5BAEAAAAALAAAAAABAAEAAAICRAEAOw==)