HAL Id: hal-02507869
https://hal.archives-ouvertes.fr/hal-02507869
Submitted on 13 Mar 2020HAL is a multi-disciplinary open access archive for the deposit and dissemination of sci-entific research documents, whether they are pub-lished or not. The documents may come from teaching and research institutions in France or abroad, or from public or private research centers.
L’archive ouverte pluridisciplinaire HAL, est destinée au dépôt et à la diffusion de documents scientifiques de niveau recherche, publiés ou non, émanant des établissements d’enseignement et de recherche français ou étrangers, des laboratoires publics ou privés.
NMR-based metabolomics and fluxomics: developments
and future prospects
Patrick Giraudeau
To cite this version:
Patrick Giraudeau. NMR-based metabolomics and fluxomics: developments and future prospects. Analyst, Royal Society of Chemistry, 2020, �10.1039/D0AN00142B�. �hal-02507869�
NMR-based metabolomics and fluxomics:
developments and future prospects
Patrick Giraudeau
a,*a Université de Nantes, CNRS, CEISAM UMR 6230, F-44000 Nantes, France
* Correspondence to: [email protected]
Abstract
NMR spectroscopy is an essential analytical technique in metabolomics and fluxomics workflows, owing to its high structural elucidation capabilities combined with its intrinsic quantitative nature. However, routine NMR “omic” analytical methods suffer from several drawbacks that may have limited its use as a tool of choice, in particular when compared to another widely used technique, mass spectrometry. This review describes, in a critical and perspective discussion, how some of the most recent developments emerging from the NMR community could act as real game changers for metabolomics and fluxomics in the near future. Advanced developments to make NMR metabolomics more resolutive, more sensitive and more accessible are described, as well as new approaches to improve the identification of biomarkers. We hope that this review will convince a broad end-users community of the increasing role of NMR in the “omic” world at the beginning of the 2020s.
Keywords
Metabolomics; Fluxomics; NMR spectroscopy; Resolution; Sensitivity; Accessibility; Structure elucidation
Introduction
In the family of “omic sciences”, metabolomics and fluxomics represent one of the most exciting challenges that the analytical chemists ever had to face. Metabolomics deals with the measurement (identification and quantification) of the largest possible number of metabolites in a broad variety of biological systems, including cells, biofluids and tissues from plant, animal or human origin.1 Fluxomics aims at obtaining information on metabolic fluxes, ie. on the rate of metabolic conversions in such systems.2 Both metabolomics and fluxomics deal with a great diversity of small molecules with molecular weight typically lower than 1000 Da, such as amino acids, carboxylic acids, carbohydrates, alcohols, amines, lipids, more complex molecules such as specialized metabolites, and even drugs and their degradation products. Since metabolites are the final downstream products of genomic, transcriptomic, and/or proteomic perturbations, their measurement brings critical insights into systems biology, making it possible to better characterize and understand biological mechanisms, but also to identify biomarkers of a pathological state or to classify sample groups depending on their origin.
Metabolomics and fluxomics methods actually include several complementary approaches.3 On
the one hand, untargeted metabolomics focuses on the measurement and comparison of all detectable signals in a series of samples from different groups, followed by the assignment of relevant signals to metabolite structures, focusing on signals whose variation across sample groups is statistically different. On the other hand, targeted methods focus on the accurate and precise quantitation of a well-defined set of known metabolites. Between untargeted and targeted methods, some approaches are termed “semi-targeted” when they focus on a specific compound class, e.g. sugars, polar metabolites, etc. Fluxomics also focuses on small molecules, but involves isotopically labeled compounds which are used as tracers to determine the fluxome, ie. the complete set of metabolic fluxes in a living organism. The typical fluxomics approach consists in introducing a 13C-labeled precursor into the biological system, followed by an accurate measurement of the level of incorporation of 13C into metabolites.4
Metabolomics and fluxomics involve well-defined workflows that include successive steps requiring complementary scientific expertise. A tailored design of the biological experiment is required to accurately answer a given biological question, and this requires the combined expertise of biologists and analytical chemists. Generating analytical data on biological samples
requires the expertise of NMR or MS specialists, while the expertise of biostatisticians is often indispensable to exploit the resulting data.
NMR and MS are from far the most widely used methods for metabolomics studies. The advantages and drawbacks of the two methods for the study of complex metabolite mixtures have been extensively reviewed.5-8 They are often summarized by a better reproducibility and a more reliable metabolite structure identification for NMR, versus a much higher sensitivity for MS, although this is certainly a reductive judgment from both sides. In fact, the two techniques are highly complementary, and an increasing number of metabolomics studies have reported the combined used of MS and NMR, either to improve metabolite identification or even in combined multi-platform data integration strategies to improve group classification. In fluxomics, the complementarity between the two techniques is even stronger. While MS provides sensitive information on the fractional enrichment of mass isotopomers, NMR provides detailed positional information on isotope enrichments.9 For all these reasons, an increasing number of analytical platforms report the joint use of NMR and MS on a routine basis.
In spite of this complementarity, the proportion of MS-based experiments in metabolomics has increased much faster than the proportion of those relying on NMR, over the last decade.10
There are certainly multiple and complex reasons explaining this situation, such as the easier accessibility to MS instruments, and the higher associated sensitivity. But intriguingly, the last 20 years have also witnessed tremendous developments in liquid-state NMR spectroscopy, which have been little applied to metabolomics and fluxomics, although these fields would highly benefit from the new tools that the NMR community has been developing for the analysis
of mixtures. Indeed, the vast majority of routine NMR metabolomics analyses rely on 1D 1H
pulse sequences with solvent signal suppression schemes.11 A limited number of 2D experiments are also used to help with structural elucidation,12 and also in fluxomics to facilitate the measurement of positional 13C isotopic enrichments.13 But most of the recent developments which have been driving the small molecule NMR community for the last 20 years (e.g. fast 2D methods, pure-shift spectroscopy, hyperpolarization, etc.) are not part of the daily arsenal in NMR metabolomics. One of the possible reasons lies in the limited connections between the historical NMR groups who have been driving the field for 50 years and the large community of NMR users who are involved in practical metabolomics studies. Unlike the MS community, who has devoted lots of efforts to the development of “omics” sciences, most NMR
spectroscopy groups have rather been focusing on applications in the fields of structural biology or material sciences. And the proportion of presentations on metabolomics and fluxomics is still quite low at NMR conferences.
Fortunately, this paradigm seems to be rapidly changing at the beginning of the 2020s. On the one hand, NMR methodology groups have realized that metabolomics and fluxomics provide a great diversity of complex samples that offer considerable and exciting spectroscopic challenges in terms of concentration, dynamic range and peak separation. On the other hand, metabolomics and fluxomics groups are increasingly aware of the resolution and sensitivity boost offered by new NMR developments. Eventually, an increasing number of research groups involve joint expertise of NMR spectroscopists and omics experts. Rather than being a comprehensive literature review, the present contribution aims at highlighting how emerging NMR methods currently act as a game changer for metabolomics and fluxomics, by being capable of meeting the most exciting challenges raised by a demanding end-users community. Metabolomics and fluxomics are discussed in parallel rather than separately, since they share a number of common features in terms of studied samples and analytical challenges.
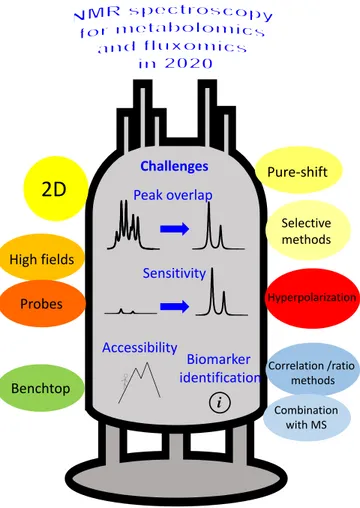
The following challenges –summarized in Figure 1– will be addressed in this review, focusing on how recent NMR advances enabled significant improvements for the analysis of metabolomics samples: peak overlap, low sensitivity, limited accessibility and difficulty in biomarker identification. Challenges pertaining to other parts of the metabolomics and fluxomics workflow (i.e., sample preparation, statistical analysis), while equally important, will not be addressed in details. Regarding peak overlap, we will describe how recent advances in multi-nuclear, multi-pulse and multi-dimensional NMR offer appealing solutions to disentangle overlapping peak resonances, thus making the analysis of metabolomics and fluxomics data easier, less ambiguous and more accurate. We will also describe solutions based on physical and chemical methods to simplify NMR spectra of complex mixtures. We will then discuss how recent sensitivity improvements based on higher magnetic fields, better probes, and hyperpolarization, have significantly reinforced the role of NMR. The accessibility challenge will be discussed in light of the recent advances in the development of benchtop NMR hardware, which offers promising performance for profiling applications on complex samples. Finally, we will attempt to illustrate how processing developments –alone or combined with MS methods– have facilitated the identification of relevant biomarkers from NMR spectra of complex metabolomics and fluxomics samples. Note that this review focuses on
high-throughput, in vitro analysis of biological sample collections, and that in vivo analysis is left out of the scope of the discussion, although this field will also certainly benefit from the developments described here.
Figure 1. Overview of the current challenges in NMR-based metabolomics and fluxomics, and of the main solutions being explored by the research community.
Challenges Peak overlap Sensitivity Accessibility Biomarker identification i Pure-shift
2D
Selective methods Hyperpolarization High fields Probes Benchtop Correlation /ratio methods Combination with MSTowards a better separation of metabolite signals
Commonly studied samples in metabolomics, such as biofluids and extracts, can be qualified as “complex samples” from the analytical point of view. They contain a large diversity of metabolites, and although NMR can “only” detect a few hundreds of them, the corresponding signals are most often heavily overlapped. The resulting spectral complexity is further compounded by the strong solvent peak(s) – which can be efficiently suppressed with appropriate methods.14 Overall, the routine metabolomics workflow still suffers from ubiquitous peak overlaps that make the identification or quantification of metabolites ambiguous. In fluxomics, the overlap between peaks is even further complicated by the complexity of 13C isotopic patterns. Signal processing methods have been developed to
deconvolute overlapping metabolite signals, both in the case of metabolomics15-17 and fluxomics.18 However, these approaches often rely on prior information on the metabolite
resonances, and the corresponding databases are often specific of a given biological matrix. Moreover, deconvolution methods may fail when peak overlap is too strong.19
In order to deal with this drawback, this section highlights how NMR metabolomics and fluxomics have recently benefited from emerging NMR methods which have been developed to disentangle overlapping resonances in small molecule mixtures, and are now increasingly applied to “real-life” omic studies.
Heteronuclear 1D NMR spectroscopy
A first strategy to deal with overlapping peaks in complex mixtures of metabolites is to rely on alternative nuclei. In the case of metabolites, 13C is particularly relevant since it is present in virtually all metabolites, and offers a much larger frequency range than 1H, leading to reduced overlap. Unfortunately, 13C NMR is also much less sensitive than 1H NMR, owing to its lower magnetogyric ratio (ca. ¼ of the proton value) and to a low natural abundance (1.1%). Still, metabolomics studies can benefit from direct 13C detection at natural abundance in the case of concentrated samples such as in food sciences. For instance, 13C NMR profiling has been successfully applied to the classification of coffee beans20 or olive oil.21 The development of more sensitive NMR probes also allowed the acquisition of natural abundance 13C spectra on biofluids.22, 23 Strategies to enhance the sensitivity of 13C NMR profiling based on polarization transfer methods have also been successfully implemented.24 In this case, only relative
NMR signal and the corresponding metabolite concentration. Another approach to enhance the sensitivity of 13C NMR detection is to rely on 13C-enrichment of the biological material. Of
course, such enrichment forms the basis of 13C Metabolic Flux Analysis (MFA) or fluxomics,
as it provides crucial information on the incorporation of labeled carbons by biological systems,
ie. on metabolic pathways.2
Multi-dimensional NMR
Multi-dimensional NMR methods, and particularly 2D NMR, are often used to facilitate the attribution of peaks and to achieve structure elucidation. Indeed, 2D experiments offer the advantage of spreading overlapped peaks along two orthogonal dimensions, thus limiting peak overlap while providing additional information on chemical structures.25 Moreover, the great diversity of multi-dimensional pulse sequences makes it possible to choose the best compromise between sensitivity, rapidity and peak separation. The typical 2D NMR experiments used in metabolomics are J-resolved spectroscopy, homonuclear 2D correlation experiments such as TOCSY (total correlation spectroscopy) or heteronuclear 2D correlation experiments such as HSQC (heteronuclear single-quantum correlation).26 However, these experiments are generally recorded on a small subset of samples from a given study. Moreover, they are mostly used for peak identification and the information on peak volumes is often not exploited. The situation is slightly different in fluxomics, where 2D experiments have become part of the daily arsenal to
determine position-specific isotopic enrichments, from TOCSY or HSQC experiments.13
The main reason why the use of multi-dimensional NMR is still not as widespread as it could be is the long experiment time required to record such spectra with a sufficient resolution and sensitivity.27 For instance, 2D experiments typically need the repetition of several hundreds of
1D experiments, leading to experiment times between a few tens of minutes and several hours. Such durations are often not compatible with the high-throughput character required when analyzing large sample collections such as those typically encountered in metabolomics and fluxomics studies. Fortunately, the NMR community has developed a great variety of methods to accelerate multi-dimensional experiments.28 These methods include fast repetition techniques,29 spectral aliasing,30 non-uniform sampling (NUS)31 of the indirect dimension(s) or less conventional methods such as Hadamard32 or Ultrafast (UF)33 spectroscopies. It is only recently that some of these approaches have reached a sufficient level of maturity to be applied to metabolomics studies.25 Not only they are compatible with high-throughput studies, but it has been shown –at least in the case of UF NMR– that under certain conditions, fast acquisitions
offer a higher repeatability than conventional 2D NMR since they are less sensitive to hardware instabilities.34
The following paragraphs describe recent examples highlighting the potential of such rapid 2D NMR acquisitions for untargeted and targeted metabolomics, and for fluxomics as well. Figure 2 illustrates some of these approaches in the case of UF 2D NMR, which has been chosen as an example since it has reached a sufficient level of maturity to be applied to these three research areas.35 Note that the principles of UF 2D NMR –which relies on a spatial encoding of the sample thanks to the combination of chirp pulses with magnetic field gradients– will not be described here but have been extensively reviewed in recent literature.35, 36 It is also fair to mention that UF 2D NMR suffers from a well-known sensitivity penalty compared to conventional NMR,36 which explains why UF 2D NMR is best suited to relatively concentrated metabolite samples such as extracts.
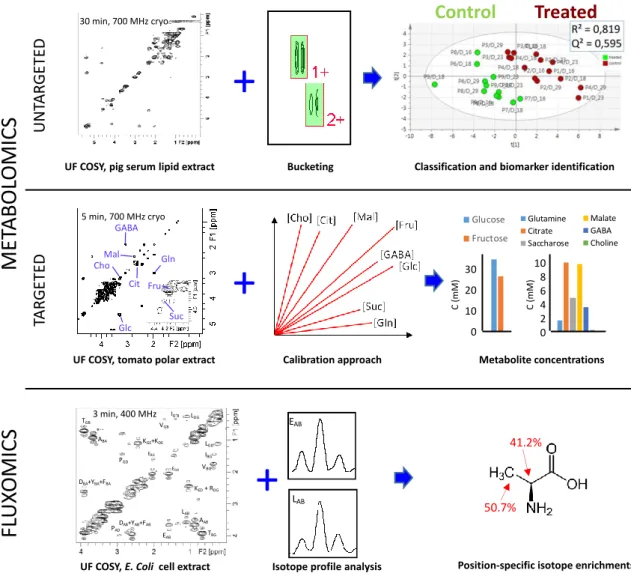
Figure 2. Illustration of the potential of fast 2D NMR methods based on ultrafast 2D NMR (COSY in these examples) in metabolomics and fluxomics. (Top) Untargeted lipidomics performed by fast 2D COSY (30 min at 700 MHz) on pig lipid serum extracts efficiently separates samples from pigs treated
with a growth promoter (ractopamine) versus control pigs.37 (Middle) Targeted quantification combining fast 2D COSY (5 min at 700 MHz) with a calibration approach accurately determines the concentration of metabolites with overlapped peaks in tomato extracts.38 (Bottom) Fast 2D COSY (3
min at 400 MHz) with 13C-decoupling in the F2 dimension applied to 13C-enriched E. Coli. cell extracts makes it possible to measure position-specific isotope enrichments with a 1-2% accuracy.39
In the case of untargeted analyses, 2D NMR could in principle be used as routine data acquisition tool, in addition to (or in replacement of) 1D spectra. Several studies have now demonstrated the input of using 2D NMR in the untargeted metabolomics workflow. One of the first papers along this direction was published by Van et al., who reported a higher performance of 2D TOCSY with zero-quantum filtering, versus 1D 1H NMR for metabolic profiling of urine sample from mice.40 They nicely demonstrated that statistical models obtained
UF COSY, tomato polar extract
+
Calibration approach 0 10 20 30 40 50 60 70 80 90 100 8 8 8 21 21 21 34 34 34 55 55 55 Conce nt ra tion (m M in the N M R tub e)Days Post Anthesis
Glucose Fructose 0 10 20 30 40 50 60 70 80 90 100 8 8 8 21 21 21 34 34 34 55 55 55 C once nt ra ti on (m M in the N M R t ub e)
Days Post Anthesis
Glucose Fructose 0 2 4 6 8 10 12 14 16 18 20 8 8 8 21 21 21 34 34 34 55 55 55 C onc ent ra ti on (m M in the N M R t ube )
Days Post Anthesis Glutamine Citrate Saccharose Malate GABA Choline 0 2 4 6 8 10 12 14 16 18 20 8 8 8 21 21 21 34 34 34 55 55 55 C onc ent ra ti on (m M in the N M R t ube )
Days Post Anthesis Glutamine Citrate Saccharose Malate GABA Choline 0 2 4 6 8 10 12 14 16 18 20 8 8 8 21 21 21 34 34 34 55 55 55
Conc
entr
ation
(mM
in the
NM
R tube
)
Days Post Anthesis Glutamine Citrate Saccharose Malate GABA Choline 30 20 10 0 10 8 6 4 2 0 C ( mM ) C ( mM ) Metabolite concentrations Fru Suc Glc Mal Cit Gln GABA Cho
+
UF COSY, pig serum lipid extract Bucketing Classification and biomarker identification
Control
Treated
30 min, 700 MHz cryo 5 min, 700 MHz cryo TBG AAB LAB EAB DAB+YAB+FAB PAD DBA+YBA+FBA KED+ RDG EGB VBG IBG’ LGD LDG IG’B VGB KGE+KDE PGD EBG ABA TGB+
UF COSY, E. Coli cell extract
EAB
LAB
Isotope profile analysis Position-specific isotope enrichments
41.2% 50.7%
MET
ABOL
OMICS
FL
UX
OMICS
TAR GETED UN TAR GETED 3 min, 400 MHzfrom 2D spectra were more efficient than those obtain from 1D data to characterize statistically relevant changes in low abundance metabolites. However, the experiment duration associated with 2D spectra was extremely long (17 hours per spectrum based on the paper’s experimental parameters) and not suited to routine analysis. Later on, two studies demonstrated efficient data processing strategies to highlight statistically relevant biomarkers from 2D spectra, either based on pattern recognition41 or on image processing methods.42 However, experiments remained limited by their long duration, but the situation started to change ten years ago with the use of fast acquisition methods. In 2009, Ludwig et al. reported the use of Hadamard spectroscopy for untargeted metabolomics of colorectal cancer.43 In 2014, Le Guennec et al. investigated –on model samples– the impact of time-saving strategies such as NUS or UF, associated with classical bucketing data processing strategies.44 Their results showed that 2D spectra –including fast methods– provided a similar group separation compared to 1D data, but a much less ambiguous biomarker identification, that was attributed to a better peak separation. Féraud et
al. reached a similar conclusion on 2D COSY data recorded on human urine samples, showing
that 2D spectra provided a higher level of clustering after statistical analysis.45 In 2018, Marchand et al. applied fast 2D approaches (UF COSY and NUS TOCSY) on pig serum lipid extracts, to address chemical food safety issues associated with the administration of a growth promoter, ractopamine37 (Figure 2a). The results showed that fast 2D methods provided the
same quality of clustering as 1D NMR, with no major time penalty. Moreover, 2D spectroscopy allowed a less ambiguous identification of biomarkers, again resulting from a better spreading of overlapped resonances. These results show that fast 2D NMR methods have reached a sufficient level of maturity to be applied in the routine untargeted metabolomics workflow. However, there are still limitations to their adoption by a large community, such as the lack of automated 2D bucketing tools, or –in the case of UF 2D NMR– the time and expertise needed to implement the method on a spectrometer.
Fast 2D NMR methods also appear to be very promising for targeted quantitative metabolomics. When one needs to accurately determine the concentration of targeted analytes in complex mixtures, 2D NMR provides an appealing solution to the peak overlap issue. However, 2D NMR pulse sequences do not provide immediate quantitative information contrary to 1D NMR. Indeed, as in 1D NMR, the signal (peak volume) is proportional to concentration, but the coefficient of proportionality is different for each peak, owing to the multi-pulse nature of 2D pulse sequences. Several strategies have been considered to circumvent this limitation.46 The first one consists in calibrating the response factor of each peak of interest (at least one per targeted metabolite) by external calibration or standard additions.47, 48 This procedure can lead
to accurate quantification (ca. 1-2%), and multiple peaks can be calibrated simultaneously by carefully designing a single series of calibration mixtures containing all the targeted analytes in known concentration. However, it requires that the analytes are available as commercial standards of known purity. This is the case for most primary metabolites, but may be more problematic for specialized metabolites. An alternative consists in designing specific 2D NMR pulse sequences where the coefficient that correlates the concentration with peak volumes is approximately the same for each peak. Such performance has been reached so far for the HSQC pulse sequence, thanks to a variety of methods that compensate for the impact of J-couplings on peak volumes.49-52 These methods make it possible to quantify multiple analytes from 2D spectra using a single internal reference, exactly like in 1D NMR. However, most of them are less accurate as they do not compensate for differences in transverse relaxation times between analytes. An exception is the HSQC0 method, however it requires long experiment times (3
spectra for each sample) which are not really compatible with high-throughput metabolomics.52 These various targeted quantitative approaches have already been successfully applied to a broad diversity of samples and studies. In most cases, fast 2D experiments were crucial to ensure that the method would be applicable in routine, but also to limit the impact of the spectrometer variability in the course of the experiment. In 2012, Martineau et al. applied a homonuclear double-quantum experiment with optimized experimental parameters to determine the concentration of multiple major metabolites with a standard addition approach.48
Similar results on the same biological matrix were obtained by Le Guennec et al. with a UF COSY experiment. Later on, Jézéquel et al. applied UF COSY with an external calibration method to accurately quantify major metabolites in polar extracts of tomato fruit.38 (Figure 2b). Other recent applications of quantitative 2D NMR with calibration strategies or standard additions include the concentration determination of cyclodextrins in blood plasma7 or of taurine in energy drinks.53 As for direct quantitative HSQC methods, they have also been successfully applied to solve various quantification issues, such as the concentration determination of sugar phosphates in plants8 or the quantification of natural products in herbal supplements.19 The latter example is particularly interesting, since it provides an example where 1D peak overlap is so high that deconvolution approaches fail, thus justifying the need for quantitative 2D NMR methods.
Fast 2D NMR methods have also found applications in the field of fluxomics, where 2D NMR was already used on a regular basis for the determination of position-specific isotope enrichments. Homonuclear UF COSY and UF TOCSY pulse sequences allowed the accurate determination of such enrichments in E. Coli extracts within 3 minutes only (versus several
hours for the conventional experiment).39 A fast heteronuclear J-resolved experiment was also
designed for the same purpose, both in a conventional54 and ultrafast version.55 Eventually, both
approaches were combined with a fast 3D acquisition scheme capable of providing an excellent separation between overlapped metabolite peaks in an UF 2D COSY plane, while retaining the isotope enrichment information in an orthogonal dimension.56 A few minutes only were required to record the 3D spectrum, while hours would have been needed to reach the same result with conventional acquisition strategies. More recently, a fast repetition 2D HSQC method (the ALSOFAST-HSQC) was applied to study the impact of antioxidant gold nanoparticles on cancer cells grown on a 13C glucose-enriched medium. Within 30 minutes, a highly resolved HSQC spectrum was obtained, showing characteristic isotope patterns for each
13C position, opening interesting perspectives for fluxomics.57
The above-mentioned examples highlight the potential of fast 2D NMR acquisition strategies in various areas of metabolomics and fluxomics. At the time of writing, these methods are still not used on a routine basis in most research laboratories. Communication efforts are necessary to make end-users aware of recent methodological advances, as well as efforts to automate the acquisition and processing of fast 2D spectra. Finally, developments are still very active in this field and one should also pay attention to recently developed alternative fast 2D methods, such as absolute minimum sampling, which have not yet been applied to full metabolomics studies but have shown promising results on complex mixtures.58 Another interesting time-saving
strategy was also recently suggested for 1D NMR, which consists in shortening longitudinal relaxation times by adding a paramagnetic co-solute.59 This approach could potentially be
combined with the fast 2D experiments mentioned above.
Pure-shift NMR
While the methods described so far aimed at improving the separation between overlapped
peaks, pure-shift NMR methods focus on the removal of homonuclear couplings on 1H spectra
to turn all multiplets into singlets.60, 61 Different strategies have been described, such as those relying on simultaneous spectral and spatial selection, or on BIRD (bilinear rotation decoupling) building blocks. Those approaches are applicable both in 1D and 2D NMR and have the potential to greatly simplify the assignment and quantification of biomarkers in metabolomics.
However, a major drawback of 1D pure-shift NMR method is that they suffer from low sensitivity –a few percent of the one from conventional 1D experiments. A second limitation is that they may be hampered by artefacts due to the data chunking mode used during acquisition,
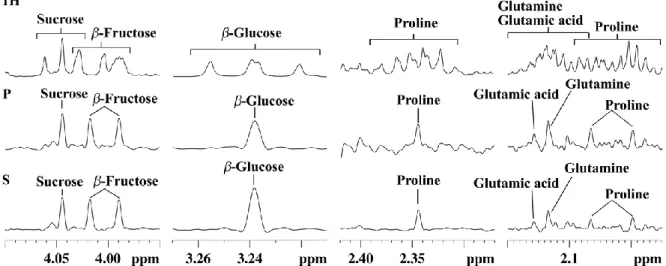
and also due to imperfect decoupling in the case of strongly coupled systems. This may explain why the application of 1D pure-shift NMR to metabolomics has been quite limited so far. However, the latter limitation was recently circumvented thanks to the SAPPHIRE-PSYCHE approach which is able to deliver “ultraclean” 1D pure-shift 1H spectra almost free of artefacts.62 Based on this approach, Lopez et al. recently demonstrated the very first successful application of 1D pure-shift NMR to a real metabolomics study on Physalis Peruviana fruit extracts from different Andean ecosystems.63 Figure 3 illustrates how this optimized
SAPPHIRE-PSYCHE method leads to nicely homodecoupled 1H spectra while leading to much
cleaner spectra than the original PSYCHE method. In this study, the spectra were processed with statistical analysis and compared to those obtained from conventional 1D 1H NMR data. The PLS separation between sample groups was found comparable between conventional and
pure-shift 1H NMR, but the biomarker identification based on STOCSY analysis of the NMR
data was improved with the pure-shift approach, leading to a much less ambiguous identification of biomarkers. While the approach is limited in terms of sensitivity, the spectra obtained with the SAPPHIRE-PSYCHE method are much less prone to artefacts than other shift methods, and this result certainly opens nice perspectives for the application of pure-shift NMR to metabolomics. Another recent study should be noted, which reports the use of PSYCHE NMR with statistical analysis to detect adulteration of honey and to assess the geographical origin of tea.64 However, the results were less convincing compared to
conventional 1D NMR, probably because the pulse sequence did not include the SAPPHIRE module, which further justifies the potential impact of this recent methodological advance.
Figure 3. Selected expansion regions of 1H NMR (1H), PSYCHE (P), and SAPPHIRE (S) spectra of an aqueous extract of Cape gooseberry (Bambamarca I) showing signal assignments. Figure
reproduced from Ref. 63 under Creative Commons Attribution 4.0 International License (http://creativecommons.org/licenses/by/4.0/)
While 1D pure-shift NMR experiments are sensitivity-limited, this is not the case of heteronuclear 1H-13C 2D experiments where pure-shift spectra can be obtained in the 1H dimension at no cost in terms of sensitivity, and with a substantial gain in resolution. Such a pure-shift 2D HSQC approach was in fact included in the QUIPU approach, already mentioned in the previous section, which was successfully applied to various targeted quantitative studies.19, 51, 65 In 2019, Timári et al. suggested that the pure-shift 2D approach could be relevant for untargeted metabolomics;66 application to a real untargeted metabolomics study could be expected in the near future. Finally, the first application of pure-shift NMR to the field of fluxomics has been reported very recently by Sinnaeve et al., who developed a pure-shift 2D heteronuclear J-resolved experiment to extract position-specific 13C enrichments in heavily overlapped systems.67
Since all the studies involving pure-shift NMR in metabolomics and fluxomics are less than 2 years old at the time of writing, one could anticipate that pure-shift NMR will certainly find many successful applications in the field, particularly for samples offering sufficient metabolite concentrations. Together with the 2D NMR developments mentioned previously, this forms the demonstration that pulse sequence NMR developments have much to offer to the field, and that metabolomics and fluxomics would highly benefit from stronger interactions with the NMR methodology community.
Towards more selective NMR experiments
While the methods described in the previous section aimed at improving the separation between signals from all detectable metabolites in a mixture, an alternative is to reduce the number of observable analytes in order to yield simpler spectra. This approach may seem paradoxal in metabolomics, which by essence aims at detecting a maximum number of signals. However, when targeted information is sought, for instance on a specific class of molecules, or on molecules with specific properties, selective methods can be an efficient way of discriminating certain metabolite classes. While this strategy may be seen as a loss of universality of the NMR detector, it actually makes NMR closer to MS, which is by essence a selective method, particularly when coupled to chromatography.
Molecule-selective pulse sequences
A first strategy along this line is to rely on pulse sequence capable of filtering out the signal from certain classes of molecules. In the case of biofluids, a widely used method consists in using a CPMG (Carr-Purcell-Meiboom-Gill) pulse sequence before detection –possibly combined with a water presaturation scheme– so that the signals from large molecules (e.g., Proteins) are eliminated through T2 relaxation during the pulse sequence.68 This leads to a flatter
baseline and enhances the contribution from smaller molecules. On the contrary, diffusion-based filters make it possible to filter out the signals from fast-diffusing molecules (metabolites) while those from slow-diffusing molecules (lipids, proteins) can be observed.69 Recent examples in the literature highlight the complementarity of those methods in a variety of situations.29, 70 Concerning the diffusion-edited experiment, it is worth highlighting the 2D DOSY (diffusion-ordered spectroscopy) experiment, which has the potential to virtually separate signals from mixture components based on their diffusion coefficients.71 However, this method has been little applied in metabolomics studies, apart from examples where it was used for the identification of metabolites with overlapping signals.72, 73
Physical and Chemical methods for spectral simplification
Several approaches have been described that rely on physical of chemical discrimination of metabolite signals. The most obvious approach is to rely on the physical separation of mixture components through high-performance liquid chromatography (HPLC) prior to NMR detection.74 While regularly used in natural product chemistry for the identification of unknown
compatible with high-throughput analysis, but also because it is a dilutive technique associated with solvent gradients which are detrimental to the quality of NMR spectra.
Other recent developments –mainly driven by the group of Bruschweiler– relies on selective interaction between metabolites and charged silica nanoparticles.75 Such nanoparticles are added to the NMR sample, and metabolites that bind to the nanoparticles experience strong line broadening. This leads to the selective suppression of the NMR signals of metabolites whose charge is opposite to the charge of the nanoparticles. Depending on the cationic or anionic nature of the nanoparticles, one can finely tune the resulting interaction, leading to the extinction of specific signals. Salvia et al. suggested an interesting complementary approach which consists in specifically targeting metabolites of interest by coating nanoparticles with ligands that would selectively bind to them.76 These “chemosensing” approaches leads to a spectral simplification that can be beneficial when spectra are overcrowded. Figure 4 shows how this method can significantly simplify 2D HSQC spectra of urine samples. On a side note, such nanoparticles can also be used at the sample preparation stage, prior to the NMR detection, to remove the proteins from serum samples.75 While these methods appear promising, their application to real case studies in metabolomics or fluxomics has not been demonstrated yet.
Figure 4. 1D 1H and 2D 13C–1H HSQC spectra of 10-compound model mixture (a) without and (b) with anionic silica nanoparticles (SNPs). Red and blue squares highlight the cross-peaks that are
suppressed by the presence of SNPs. Reprinted with permission from Ref. 75. Copyright 2016 American Chemical Society
Towards more sensitive NMR metabolomics
Magnets and probes
The low sensitivity of NMR is certainly the major bottleneck for its broad application in the field of metabolomics, particularly when compared to MS. NMR is inherently affected by the weak nuclear polarization. For instance, at a 14 T magnetic field operating at 300 K –the typical configuration for metabolomics– the polarization of 1H is only 0.000008. This leads to limits of detection in the µM range, which is good enough for the detection of primary metabolites in biofluids, but not adapted to the detection of specialized metabolites in plant samples, for instance.
Fortunately, numerous recent developments have paved the way towards more sensitive NMR metabolomics and fluxomics, announcing a better complementarity between NMR and MS in the near future. A straightforward –but technically challenging– approach consists in increasing
the magnetic field. Traditional NMR metabolomics experiment are performed at a 1H Larmor
frequency between 500 and 800 MHz, but commercial magnets are now available at up to 1.2 GHz,77 whose potential for metabolomics remains to be explored –although preliminary spectra on biofluids have been recently reported63. Since the NMR sensitivity scales with B
03/2, a
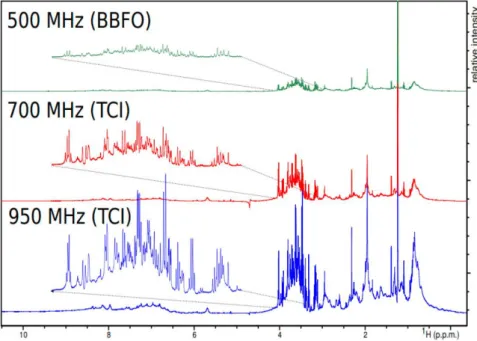
sensitivity gain of ca. 2.8 can be obtained by switching from 600 MHz to 1.2 GHz, which may seem useless when considering the price difference (a factor of ca. 15 between the two equipments at the time of writing). However, this magnetic field increase would in principle translate to a considerable 7.8 gain in experiment time –a game changer for high-throughput applications. In addition, higher magnetic fields also come with an improvement in spectral dispersion that can help to better separate overlapping signals. The impact of very high magnetic fields for routine metabolomics or fluxomics has not been systematically evaluated yet, but preliminary data at very high field5 (Figure 5) highlight their potential to detect small signals from metabolites in overcrowded regions.
An alternative technological approach to improve sensitivity is the development of more sensitive probes that help maximizing the signal-to-noise ratio (SNR). This is the case of cryogenically cooled probes, capable of improving the SNR by a factor of 3 to 4.78 However, such probes are not well suited to samples with a high salinity, such as extracts dissolved in a buffer, as is often the case in plant metabolomics.79 Alternatively, microprobes have been designed to maximize the sensitivity for mass-limited samples. For instance, a 1.5 mm high
temperature superconducting probe has been developed for 13C NMR metabolomics at natural
serum.23 Microprobes have also been developed under HR-MAS (high-resolution magic angle
spinning) configurations, in order to work on small amounts of tissue samples.80
Still with the aim to pursue the quest for a sensitive NMR detection of metabolites in mass-limited samples, recent developments in the field of microfluidics seem particularly promising. For instance, Utz and co-workers recently developed a system that can detect metabolites at
sub-millimolar concentrations in sample volumes of a few µL only.81 Such methods open very
promising perspectives for analyses on very small samples –they could even make NMR a tool of choice for the emerging domains of single-cell metabolomics and fluxomics.82
Figure 5. Demonstration of magnetic field strength and probe specificity on spectral resolution of bovine serum recorded with the same parameter set on three spectrometers
working at 500, 700, and 950 MHz proton frequencies at 25 °C. Figure reproduced from Ref.5
under Creative Commons Attribution 4.0 International License (http://creativecommons.org/licenses/by/4.0/)
Hyperpolarization
While the microprobe and microfluidics strategies mentioned above achieve an impressive performance in reducing the sample mass needed for NMR metabolomics and fluxomics, they do not act much on the limit of detection in terms of molar concentration. Such a goal could be reached in a near future through the application of hyperpolarization methods that can enhance the NMR sensitivity by up to 4 orders of magnitude by drastically enhancing the nuclear polarization. Among the hyperpolarization methods, two techniques have been recently applied to samples with metabolomics or fluxomics relevance. The first approach is the use of
para-hydrogen to transfer the transfer of hyperpolarization from H2 in the para state to the nuclear
spins of analytes. The most general implementation of this method is the SABRE technique (signal amplification by reversible exchange) where an iridium-based metal complex is used to transfer the hyperpolarization to the analytes in a reversible fashion.83 While this method is limited to metabolites that can bind to this iridum catalyst –although attempts have been made to make it more versatile84– it is relatively simple to implement, and the reversible interaction makes the approach compatible with the acquisition of multi-dimensional experiments.85 Under certain conditions, the SABRE method can even be used for quantitative analysis when combined with a standard addition method.86 This approach was successfully applied by Tessari
et al. to quantify analytes at low micromolar concentrations in natural extracts.87 It should be noted that the short lifetimes of SABRE-enhanced signals make the use of multidimensional
cumbersome, but this drawback can be circumvented by combining it with UF 2D NMR 88, 89
or by relying on flow or shuttling systems that enable multi-scan experiments.85, 90
A second approach is the use of dissolution dynamic nuclear polarization (D-DNP), where the sample is mixed with free radicals in a solution that forms a glass upon freezing at 1-2 K.91, 92 Under such a glassy state, the polarization can be transferred from electrons to nuclei by irradiating the sample with microwaves. The frozen sample can then be quickly transferred to a liquid-state NMR spectrometer where signals enhanced by several orders of magnitude compared to a classical NMR experiment can be obtained. This approach is very general, since it can in principle enhance the signal of all metabolites in a mixture. However, it is technically demanding as it requires specific and expensive hardware in addition to the NMR magnet. Moreover, the hyperpolarization decreases according to the apparent longitudinal relaxation times while the sample is being transferred, which makes current hardware mainly suited for
13C NMR spectroscopy. Still, D-DNP has been successfully applied to cancer cell and plant
extracts at natural 13C abundance93 (Figure 6), and Bornet et al. demonstrated an excellent repeatability (ca. 4%) for this method, making it compatible with the precision requirements of metabolomics.94 In addition, while D-DNP is an irreversible experiment which is not compatible with the time-incremented nature of conventional multi-dimensional NMR, 2D spectra can be recorded by relying on UF 2D experiments, as shown by Dumez et al. on extracts.93 Apart from this work at natural 13C abundance, Lerche and co-workers have developed an elegant approach that relies on the incubation of the targeted biological material (eg. cancer cells) prior to the D-DNP experiment.95 This approach has the double advantage that it benefits from an enhanced sensitivity thanks to 13C labeling, while providing selective information on metabolic pathways through the detection of a limited number of metabolites –
those which have incorporated the initial 13C labels. This strategy opens the way to
hyperpolarized fluxomics applications.
Considering the current limitations in terms of sample transfer between the polarizer and the liquid-state spectrometer (several seconds), one can anticipate that D-DNP will mainly open perspectives to enhance the sensitivity of 13C NMR metabolomics. But the technique is rapidly improving,96 and the development of rapid dissolution and transfer systems should make D-DNP compatible with the detection of hyperpolarized 1H spectra, opening considerable perspectives for metabolomics and fluxomics.
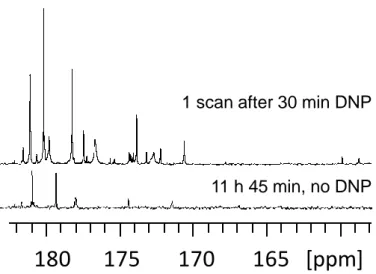
Figure 6. Quaternary region of 13C NMR spectra of green tomato fruit pericarp extracts. (Top) Single-scan 13C NMR spectrum of a 20 mg extract (prepared from 20 mg lyophilized ground tissue) recorded with a single 90° pulse after D-DNP boosted by cross polarization. Th extract was first dissolved in 200 μL of a mixture of H2O/D2O/glycerol-d8 (1:4:5) doped with 50 mM TEMPOL, then polarized for
28 min at 1.2 K and 6.7 T, and finally dissolved with 5 mL of hot D2O and transferred to a 500 MHz spectrometer equipped with a cryogenic probe. (Bottom) Conventional spectrum, obtained without hyperpolarization, of an identical extract dissolved in 700 μL of D2O, recorded with 1024 scans (11 h 45 min) at 700 MHz using a cryogenic probe. Adapted with permission from Ref. 94. Copyright 2016
American Chemical Society.
11 h 45 min, no DNP 1 scan after 30 min DNP
Control sample
1 scan after 30 min DNP
500 MHz
Tomato extract
1 scan after 30 min DNP
500 MHz
Tomato extract
1024 scans (11 h 45 min)
700 MHz, no DNP
*
*
Mal + Cit GABA Gln180 175 170 165 [ppm]
Towards more accessible NMR metabolomics
In addition to its lower sensitivity, the limited accessibility of NMR is certainly the second reason explaining that is it less widespread than MS in metabolomics and fluxomics applications. This accessibility arises from complex reasons that combine the cost and heaviness of the NMR equipment –often judged as prohibitive even though operating costs are much lower than for MS– with its high level of technicity, including the need to handle cryogenic fluids to fill superconducting magnets. Therefore, there is a major challenge in making NMR more accessible, and several manufacturers have been tackling it since 2013 with the development of compact NMR spectrometers.97 Such low-field magnets (1H resonance between 40 to 100 MHz) are transportable (<100 kg), low-cost (<100 000 €) and rely on permanent magnets that do not require any specific operation (apart from a well-regulated room temperature).
Writing about such magnets –which have been initially developed for teaching and reaction/process monitoring purposes– may seem in contradiction with the resolution and sensitivity limitations of NMR metabolomics and fluxomics. Indeed, a 60 MHz magnet is – regardless of probe homogeneity considerations– more than 30 times less sensitive than a 600 MHz one, and peaks are much more overlapped owing to the limited frequency range (10 ppm corresponds to 600 Hz on a 60 MHz spectrometer, versus 6000 Hz on a 600 MHz spectrometer). Therefore, there is little chance that such compact spectrometers could replace high-field NMR instruments for the discovery of new biomarkers. However, when considering untargeted approaches which aim at separating sample groups for classification purposes (diagnosis, authentication…), fingerprinting strategies relying on the bucketing of the 1H NMR fingerprint
could contain enough information to provide the expected group separation. This is particularly the case when sample amount is not limited, such as in extracts, food matrices or even urine samples.
Such metabolomics classification approaches using benchtop NMR instruments have already been reported in the recent literature. An impressive study was published in 2018 by Percival
et al., showing how a 60 MHz benchtop spectrometer could detect and quantify a dozen of
metabolites in urine and serum, with limits of detection of ca. 25 µM.98 Incorporated within a classical metabolomics workflow, the benchtop method led to a very efficient group separation between urine samples from type 2 diabetic patients and healthy controls. Other illustrations of the potential of benchtop NMR metabolomics were reported in the so-called “foodomics” field, such as the discrimination between beef versus horse meat99 or the detection of adulteration of
perilla oil with soybean oil.100 An application to the quality control of diesel fuel was also
recently reported.101 Although not belonging to metabolomics in the strictest sense of the word,
these profiling applications are very interesting, because they illustrate the potential of benchtop NMR to make metabolomics approaches accessible to fields of science and industry where NMR is not traditionally used.
The potential of benchtop NMR for metabolomics is still unexplored, and all the applications mentioned above are less than 2 years old. Moreover, these applications relied on basic 1D 1H NMR experiments, thus not taking advantage of the full pulse sequence programming capabilities of NMR spectroscopy. In the last few years, the emergence of pulse programming capabilities on benchtop instruments, associated with the implementation of gradient coils –a basic ingredient of all modern pulse sequences– has made it possible to accelerate the implementation of classical high-field tools for the characterization of complex mixtures. The
first UF 2D NMR spectra on a benchtop spectrometer were published by Gouilleux et al.,102
then the first DOSY and pure-shift experiments at low field were also reported.103 The implementation of a gradient coil also allowed the implementation of advanced solvent
suppression methods.104 The combination of benchtop NMR with SABRE hyperpolarization
also opens promising perspectives to alleviate the sensitivity limitation of benchtop instruments.105 Such tools have the potential to maximize the potential of benchtop NMR
metabolomics, and considering that their implementation is extremely recent, many interesting stories remain to be written. Along this line, Gouilleux et al. demonstrated that UF 2D COSY spectra of edible oils, recorded in 2.4 min on a 43 MHz benchtop spectrometer and processed with multivariate analysis, provided a much better discrimination of the botanical origin of edible oils than 1D spectra recorded in the same duration106 (Figure 7). This improved
performance of fast 2D NMR was attributed to the better separation of overlapping lipid resonances. This result highlights the need for advanced pulse sequences to maximize the capabilities of benchtop instruments for metabolomics.
Figure 7. Illustration of the potential of 2D experiments for the profiling of food samples with benchtop NMR spectroscopy. (Top) Ultrafast 2D COSY spectrum recorded in 2.4 min on a sunflower
oil sample in non-deuterated chloroform. (Middle) PCA analysis obtained with such UF 2D NMR experiments on 23 edible oil samples from different botanical origins. (Bottom) PCA on the same sample set with standard 1D experiments and a variable bucketing approach. Reprinted from Ref. 106
with permission from Elsevier. UF COSY, 2.4 min
Sunflower oil
Towards an improved identification of biomarkers
The identification of known and unknown biomarkers in biological samples is one of the major challenges that both MS and NMR have to face in metabolomics. In MS, the challenge arises from the huge number of features that can be detected –up to 30,000 in blood for instance107 and to the fact that a given feature does not correspond to a unique metabolite. In NMR, the main bottleneck is to identify peaks that belong to the same compound within complex and overlapped spectra patterns. Lots of efforts have recently been devoted to address this
challenge.6 They include the development of dedicated 1D and 2D NMR methods combined
with databases, as well as statistical methods based on correlations or ratio analysis.
NMR methods and databases
Most of the methods to better extract individual sub-spectra from mixtures rely on the combination of dedicated 1D and 2D pulse sequences with spiking experiments (when standards are available) and databases. In 1D NMR, selective TOCSY approaches have been developed to make the identification and quantification of individual metabolites easier, by helping to connect peaks which are part of the same spin system.108 This approach can even be
combined with HPLC fractionation to help identifying unknown compounds in the case of very complex mixtures.109 But most identification approaches also rely on 2D NMR pulse sequences, among which TOCSY and 1H-13C HSQC are the most popular. 2D spectra are increasingly
available in databases such as HMDB (Human Metabolome Database),110 BMRB (Biological
Magnetic Resonance Data Bank),111 MMCD (Madison Metabolomics Consortium Database)112
and PRIMe (Platform for RIKEN Metabolomics).113 Bruschweiler and co-workers proposed an
improved algorithm named COLMAR (Complex Mixture Analysis by NMR) which has been made available on a web server and helps to identify metabolites from a database relying on
HSQC, TOCSY and HSQC-TOCSY spectra.114 In parallel of these approaches, complementary
efforts have focused on the use of 13C labeling to circumvent the sensitivity limitation of 13C NMR in these identification workflows. For instance, the DemixC method is based on the covariance processing of 13C-13C TOCSY spectra.115
Using the above mentioned strategies combining 1D and 2D spectra with spiking experiments and databases, the NMR metabolomics community has obtained impressive results in terms of identification. For instance, Gowda and Raftery identified nearly 70 metabolites in human blood
to identify 209 metabolites in human urine relying on the combined use of NMR and databases.117 These impressive results highlight the performance of NMR as an essential
identification tool in metabolomics, and such approaches will certainly benefit from the tremendous current advances in machine learning.
Correlation and ratio analysis methods
Correlation methods form an impressive set of approaches capable of identifying peaks that belong to the same metabolite, and they have also contributed to maximize the potential of NMR for the identification of metabolites in complex mixtures. The most widely used method is the STOCSY (statistical correlation spectroscopy) which correlates the intensity variables in a set of 1D spectra to generate a pseudo-two-dimensional NMR spectrum that displays the correlation among the peak intensities across the whole sample.118 Metabolites can be identified based on peaks showing the highest level of correlations. Research along this line is still very active, with the recent development of several variants.119, 120
A slightly different approach has been recently published, that resembles the molecular network approach which is increasingly popular in the analysis of MS metabolomics data.121 In their so-called « maximal clique » method, Li et al. developed an automated algorithm to analyse TOCSY spectra by representing peak connectivities as a mathematical graph, in which each subgraph can be assigned to an individual spin system.122 This original method offers a way to
easily extract critical spin system information from 2D spectra.
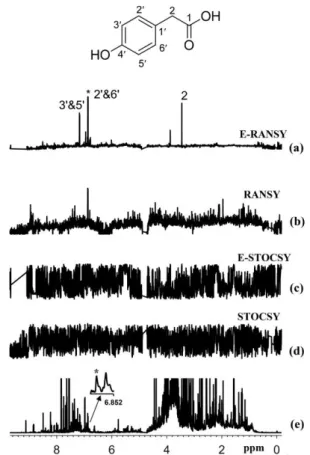
A last family of approaches relying on ratio analysis were recently developed by Raftery and co-workers to automate the extraction of relevant information from a set of NMR metabolomics spectra. The initial method, called RANSY (ratio analysis of nuclear magnetic resonance spectroscopy), identifies the peaks of individual metabolites by relying on the principles that the intensity ratios from a given metabolite are fixed.123 It first requires defining a « driving » peak belonging the compound of interest. Peak ratios derived from a set of NMR spectra are then divided by the ratios’ standard deviations across a sample set to generate the individual RANSY spectrum. Very recently, a derived version of this approach was described, called E-RANSY (extractive ratio analysis NMR spectroscopy).124 In this approach, the NMR spectra of metabolic extracts obtained at different pH conditions from the same biological sample are compared through the ratio approach. Ratio methods (RANSY and E-RANSY) were shown to be significantly more efficient than the correlation approaches. Figure 8 illustrate the potential of such ratio methods in the case of urine.
Figure 8. Comparison of the results of ratio analysis and correlation analysis of either extracted urine or intact urine spectra using the driving peak as indicated by the asterisk (*). The spectra shown are (a) E-RANSY, (b) RANSY, (c) E-STOCSY, (d) STOCSY, and (e) the intact urine 1D 1H NMR spectrum.
The inset shows the structure of 4-hydroxyphenylacetic acid identified on the basis of E-RANSY. Peaks in the E-RANSY spectrum are labeled with the corresponding protons as labeled in the structure of the metabolite. For RANSY and STOCSY, intact urine NMR spectra were used; for E-RANSY and E-STOCSY, ethyl acetate extracted urine NMR spectra were used. Reproduced with permission from
Ref. 124. Copyright 2019 Americal Chemical Society.
Combined NMR/MS strategies
The ultimate approach to an efficient identification of biomarkers would most likely rely on the combination of several analytical techniques, typically NMR and MS, to maximize the accessible structural information. In particular, accurate mass determination by MS can significantly improve the structure elucidation process by NMR. That being said, there are not many studies where both techniques have been employed synergystically, in particular due to the difficulty to extract information from specific metabolites without relying on purification steps. Some multivariate statistical analysis methods have been introduced that integrate NMR and MS, but they do not provide molecular structures.125, 126
Significant efforts along this direction have been made by Bruschweiler and co-workers to efficiently combine both analytical methods for an easier identification of metabolites. For the
identification of known metabolites (ie. those which are already present in databases), an NMR/MS translator has been developed127 which first identifies candidate structures from 1D
and 2D NMR spectra associated with a database query, followed by the determination of the m/z ratio for the possible ions, adducts and fragments for these candidates. The calculated m/z ratios are then compared with the real mass spectrum to identify the structure of known metabolites. When signals from unknown metabolites are highlighted, a second approach to
identify them is the SUMMIT MS/NMR approach, which works the other way around.128 The
SUMMIT method first identifies the possible chemical formulas for all mixture components from accurate masses obtained by MS, and generates consistent candidate chemical structures corresponding to these formulas. Then, the NMR spectra of these candidates are predicted and compared with the experimental NMR spectra of the complex mixture to identify the structures matching the information obtained from both analytical methods.
Conclusion
The take home message of this review is that liquid-state NMR of complex mixtures is currently experiencing tremendous developments which have the potential to bring back NMR in the foreground of metabolomics and fluxomics. Most of these developments aim at making NMR more resolutive (fast 2D methods, pure-shift…), more sensitive (probes, hyperpolarization…), but also to maximize the structure elucidation capabilities of NMR. Still, these advanced methodological developments often come with a loss of the intrinsic characteristics of 1D NMR, such as its absolute quantitative properties or its non-destructive character. But NMR spectroscopists have shown great ability to deal with these drawbacks by suggesting clever analytical approaches. Eventually, readers should also keep an eye on the rapidly evolving field of benchtop NMR, since those portable instruments could make NMR profiling much more broadly accessible within the next decade.
An additional message lies in the high complementarity between MS and NMR. While this complementarity was highlighted in the structure elucidation section of this review, other promising studies also recently highlighted such complementarity for the quantitative analysis of samples with metabolomics relevance.129, 130 In untargeted metabolomics, multiple studies
have been showing the complementarity of the MS and NMR to solve specific biological questions.3, 131 But even more promising results arise from the recent development of advanced statistical approaches dedicated to the integration of analytical data from multiple platforms.132,
133 While NMR has a lot to bring to metabolomics and fluxomics, these recent works certainly
predict a bright future for multi-technique analytical workflows in the field.
Acknowledgements
The author is grateful to the numerous colleagues and students from the EBSI group at the CEISAM research institute for their hard work and critical discussions over the last 10 years. Special thanks to Dr. Jean-Nicolas Dumez for the critical reading of the manuscript. The Corsaire metabolomics core facility is also acknowledged, as well as the Francophone metabolomics and fluxomics family (RFMF, MetaboHUB and others). The author acknowledges support of the European Research Council under the European Union’s Horizon 2020 research and innovation program (ERC Grant Agreement n° 814747/SUMMIT).
References
1. J. L. Markley, R. Brüschweiler, A. S. Edison, H. R. Eghbalnia, R. Powers, D. Raftery and D. S. Wishart, Curr. Opin. Biotechnol., 2017, 43, 34-40.
2. S. Heux, C. Bergès, P. Millard, J.-C. Portais and F. Létisse, Curr. Opin. Biotechnol., 2017, 43, 104-109.
3. K. Bingol, High Throughput, 2018, 7, 9.
4. S. Niedenführ, W. Wiechert and K. Nöh, Current Opinion in Biotechnology, 2015, 34, 82-90. 5. A.-H. Emwas, R. Roy, T. R. McKay, L. Tenori, E. Saccenti, A. N. G. Gowda, D. Raftery, F. Alahmari,
L. Jaremko, M. Jaremko and S. D. Wishart, Metabolites, 2019, 9.
6. G. A. Nagana Gowda and D. Raftery, J. Magn. Reson., 2015, 260, 144-160.
7. P. G. Takis, V. Ghini, L. Tenori, P. Turano and C. Luchinat, TrAC Trends Anal. Chem., 2019, 120, 115300.
8. A. Vignoli, V. Ghini, G. Meoni, C. Licari, P. G. Takis, L. Tenori, P. Turano and C. Luchinat, Angew. Chem. Int. Ed., 2019, 58, 968-994.
9. L. Peng, J. Proteomics Bioinform., 2012, 5, 9.
10. W. B. Dunn, D. I. Broadhurst, H. J. Atherton, R. Goodacre and J. L. Griffin, Chemical Society Reviews, 2011, 40, 387-426.
11. O. Beckonert, H. C. Keun, T. M. D. Ebbels, J. Bundy, E. Holmes, J. C. Lindon and J. K. Nicholson, Nat. Protocols, 2007, 2, 2692-2703.
12. R. Nakabayashi and K. Saito, Anal. Bioanal. Chem, 2013, 405, 5005-5011.
13. S. Massou, C. Nicolas, F. Letisse and J.-C. Portais, Phytochemistry, 2007, 68, 2330-2340. 14. P. Giraudeau, V. Silvestre and S. Akoka, Metabolomics, 2015, 11, 1041-1055.
15. J. Hao, M. Liebeke, W. Astle, M. De Iorio, J. G. Bundy and T. M. D. Ebbels, Nature protocols, 2014, 9, 1416-1427.
16. S. Ravanbakhsh, P. Liu, T. C. Bjordahl, R. Mandal, J. R. Grant, M. Wilson, R. Eisner, I. Sinelnikov, X. Hu, C. Luchinat, R. Greiner and D. S. Wishart, PLoS ONE, 2015, 10, e0124219.
17. P. Lacy, R. T. McKay, M. Finkel, A. Karnovsky, S. Woehler, M. J. Lewis, D. Chang and K. A. Stringer, PLoS ONE, 2014, 9, e85732.
18. S. Heux, J. Poinot, S. Massou, S. Sokol and J.-C. Portais, Metab. Eng., 2014, 25, 8-19.
19. P. M. Le, C. Milande, E. Martineau, P. Giraudeau and J. Farjon, Journal of pharmaceutical and biomedical analysis, 2019, 165, 155-161.
20. F. Wei, K. Furihata, M. Koda, F. Hu, R. Kato, T. Miyakawa and M. Tanokura, J. Agric. Food Chem., 2012, 60, 10118-10125.
21. N. Merchak, V. Silvestre, D. Loquet, T. Rizk, S. Akoka and J. Bejjani, Analytical and Bioanalytical Chemistry, 2017, 409, 307-315.
22. H. C. Keun, O. Beckonert, J. L. Griffin, C. Richter, D. Moskau, J. C. Lindon and J. K. Nicholson, Anal. Chem., 2002, 74, 4588-4593.
23. C. S. Clendinen, B. Lee-McMullen, C. M. Williams, G. S. Stupp, K. Vandenborne, D. A. Hahn, G. A. Walter and A. S. Edison, Anal. Chem., 2014, 86, 9242-9250.
24. N. Merchak, J. Bejjani, T. Rizk, V. Silvestre, G. S. Remaud and S. Akoka, Analytical Methods, 2015, 7, 4889-4891.
25. J. Marchand, E. Martineau, Y. Guitton, G. Dervilly-Pinel and P. Giraudeau, Curr. Op. Biotechnol., 2017, 43, 49-55.
26. E. A. Mahrous and M. A. Farag, J. Adv. Res., 2015, 6, 3-15.
27. R. R. Ernst, G. Bodenhausen and A. Wokaun, Principles of nuclear magnetic resonance in one and two dimensions, Oxford, Oxford Science Publications edn., 1987.
28. L. Rouger, B. Gouilleux and P. Giraudeau, in Encyclopedia of Spectroscopy and Spectrometry (Third Edition), eds. G. E. Tranter and D. W. Koppenaal, Academic Press, Oxford, 2017, DOI: