To link to this article: DOI: 10.1016/j.calphad.2011.09.004
URL
http://dx.doi.org/10.1016/j.calphad.2011.09.004
This is an author-deposited version published in: http://oatao.univ-toulouse.fr/
Eprints ID: 5546
To cite this version:
Connétable, Damien and Mathon, Muriel and Lacaze, Jacques First
principle energies of binary and ternary phases of the Fe–Nb–Ni–Cr
system. (2011) Calphad, vol. 35 (n° 4). pp. 588-593. ISSN 0364-5916
Open Archive Toulouse Archive Ouverte (OATAO)
OATAO is an open access repository that collects the work of Toulouse researchers
and makes it freely available over the web where possible.
Any correspondence concerning this service should be sent to the repository
administrator:
[email protected]
First principle energies of binary and ternary phases of the Fe–Nb–Ni–Cr system
Damien Connétable
∗, Muriel Mathon, Jacques Lacaze
CIRIMAT UMR 5085, CNRS-INP-UPS, École Nationale d’Ingénieurs en Arts Chimiques et Technologiques (ENSIACET) 4, allée Émile Monso, BP 44362, F-31030 Toulouse Cedex 4, France
Keywords:
First principles calculations Formation energies Nickel Iron Chromium Niobium
a b s t r a c t
We present first principles enthalpies of formation and lattice parameters of iron, nickel, chromium and niobium alloys. Some of these results have been partially used in a recent assessment of the Fe–Ni–Cr–Nb quaternary phase diagram. Emphasis has been put on the fcc (A1) and bcc (A2) unary structures, the X3Y-D022,-L12,-D03,-D0a,X2Y-C14(MgZn2),-C15(MgCu2)and -C36(MgNi2)Laves and X7Y6-D85(µ)
binary phases, and the X8Y4Z18-D8b(σ) ternary phase. We employed the state of the art to compute
their properties by means of the DFT (PBE functional and PAW pseudo potentials). A comparison with experimental and theoretical data is also provided.
1. Introduction
Inconel 718 is a nickel-based superalloy used in the aeronautic and nuclear industries. This material contains mainly Ni, Fe, Cr and a few atomic percent of Nb, Mo and Al, as well as smaller amounts of Ti, Co, C, Si, Mn and Ta. Its production involves thermo-mechanical and heat treatments that induce phase changes and give it its microstructure with high mechanical performance. The present work was carried out within a long-term study aiming at modeling the phase transformations during thermo-mechanical processing of Inconel 718. The phases that can appear during solidification and processing of this alloy are mainly fcc (
γ
) Ni-richsolid solution, D0a-Ni3Nb (
δ
), D022-Ni3Nb (γ
′′), L12(γ
′or Ni3Al),possibly MC and M6C carbides, Laves and bcc (
α
) or hcp-Ni3Ti (η
).The results presented below were used to generate a database for nickel superalloys. As a first step to build this thermodynamic database the quaternary system Ni–Nb–Fe–Cr was considered in which a large number of crystal structures (unary: X, binary: X/Y and ternary X/Y/Z) are required.
In modern Ni-based superalloys for airfoil turbines, the main hardening phase is represented by the L12
γ
′-Ni3Al phase, whichwas not studied here as it is not the predominant hardening phase for Nb-rich alloys like the alloys 706 and 718. In these latter alloys, the principal hardening mechanism is associated with the phase Ni3Nb-D022. It is a metastable phase that transforms to the
∗Corresponding author.
E-mail address:[email protected](D. Connétable).
stable orthorhombic Ni3Nb-D0aupon ageing. The precipitation of
the metastable D022 phase is achieved by heat-treating the
Nb-supersaturated gamma phase at a temperature between 1023 and 873 K [1–4].
In superalloys, the Laves phases have a negative impact on the mechanical properties, because they precipitate at grain bound-aries and are factors of embrittlement. The presence of Laves phase Fe2Nb formed after ageing for various times at 1048 K has been
noted by Peard and Borland [5] in a 56.4% Fe–3.8% Nb–39.8% Ni alloy. Savin [6] also studied ternary alloys of Fe–Nb–Ni, quenched from the liquid state. At the highest rates, amorphous materials and phases such as C15 or distorted D85appear. They noted a C36
for-mation for the composition 40% Fe–40% Ni–20% Nb. Peard and Bor-land [5] also noted the presence of orthorhombic D0a
(
Fe,
Ni)
Nbin the alloy 56.4% Fe–3.8% Nb–39.8% Ni. In the Fe–Nb–Ni system, Ueyama et al. [7] have identified a D0ain a 10% Fe–15% Nb–75% Ni
alloy equilibrated for 240 h at 1473 K and then water quenched. The
σ
phase occurs in a number of binary and ternary systems involving transition-group elements [1]. It is brittle and is of technological importance in connection with stainless steels. The interest in theσ
phase goes far beyond its technological properties and is related to the fundamental problem of structural stability in crystal chemistry and the physics of metals and alloys.In this paper we present the results (lattice parameters and formation energies) of an ab initio study of Ni–Nb–Fe–Cr alloys. Emphasis was put on two unary structures, fcc (A1) and bcc (A2), eight binary phases, X3Y-D022, -L12, -D0a, -D03, D85(Fe7W6-type,
µ
), X2Y-C14(
MgZn2), -C15(
MgCu2)
and -C36(
MgNi2)
Laves, andon the
σ
ternary phase (FeCr-type). In this work we compare doi:10.1016/j.calphad.2011.09.004our results to experimental and theoretical information whenever available.
2. Computational details
The calculations were made within the density functional the-ory formalism (DFT) and the pseudo-potential approximation. They were performed by means of plane wave methods as imple-mented in the Vienna ab initio simulation program (VASP) [8]. We used Projected augmented waves pseudo potentials (PAW) [9], and the Perdew–Burke–Ernzerhof [10] generalized gradient approxi-mation of the exchange and correlation functional. The pseudopo-tentials of Fe, Cr and Nb contain semi-core states, whereas those for Ni do not. Collinear magnetism (ferro and non magnetic struc-tures) was taken into account in our simulations. The cut-off was fixed to 400 eV with Monkhorst Pack dense mesh grids (about 5000
k points atom/cell) to optimize the ground states, and to compute
the converged formation energies we increased the convergence criteria to about 13 000 k-points atom/cell (equivalent by band-folding to a 24
×
24×
24 k-grid for the reference states) with a higher energy cut-off (500 eV). For all structures, the k-mesh grids were not shifted (24×
24×
24 for cubic, hexagonal and orthorhom-bic structures). TheΓpoint is always included. The precision of the formation energies was in the range of about 1 meV/atom or 0.5 kJ/mol.3. Results and discussion
3.1. Pure elements
Before studying the relative stability of binary and ternary phases, we firstly studied the fcc (A1) and bcc (A2) structures. These structures correspond to the reference states for Nb, Cr, Fe (bcc) and Ni (fcc). The results for the cohesive and formation energies for the unaries are defined as
Ec
[
X] =
E0bulk[
X] −
EXat (1) and Ef[
X] =
E0bulk[
X] −
E ref 0[
X]
(2) where Ebulk0
[
X]
is the reference energy of an X atom, EXat is theenergy of an isolated X atom, and ErefO
[
X]
is the energy of the reference state are presented in Table 1. For these reference states, DFT simulations reproduce fairly well the experimental cohesive energies. In the case of fcc-Fe and bcc-Ni, the ground states are ferromagnetic, whereas fcc-Cr and Nb are found to be paramagnetic. Anti-ferromagnetism was not taken into account in our simulations. Moreover, we also report the results for Fe, Cr and Nb fcc and Ni bcc.3.2. X3Y –L12
The prototype of the cubic structure L12is Cu3Au (cP4, Pm3m,
space group 221), where the atoms (4 per unit cell) are on the sites of a fcc lattice: the X atoms are in 3c (center of the face of the cube) and the Y atoms are located in 1a (seeFig. 1). To compute the formation energies of the binaries we defined Efas
Ef
[
XnYm] = (
E0[
XnYm] −
nE0ref[
X] −
mEref
0
[
Y])/(
n+
m)
(3)where E0ref are the energies of the reference states and E0
[
XnYm]
isthe energy of the system. The energies of the pure elements in the L12-fcc ordered phase are equal to the fcc A1 ones (X3X
=
A1).As one can see fromTable 2, the formation energies of the Ni3Y
phases (where Y
=
Cr, Nb and Fe) are negative (underlined in Table 2), suggesting that these structures are thermodynamicallyTable 1
Optimized lattice parameters (in Å), formation energies Ef(in meV/atom), cohesive
energies Ec(in eV), and total magnetic moments (in Bohr’s magneton,µb) of pure
bcc and fcc phases. System ao(Å) Ef Ec µ bcc structures Nb* 3.313 – 7.06 0.0 3.30 – 7.57 0.0 Exp. [11] Ni 2.805 929 – 0.54 Fe* 2.839 – 5.07 2.24 2.87 – 4.28 2.20 Exp. [11] Cr* 2.844 – 4.04 0.0 2.88 - 4.10 antiferro Exp. [11] fcc structures Nb 4.217 323 – 0.0 Ni* 3.520 – 4.88 0.62 3.52 – 4.44 0.61 Exp. [11] Fe 3.453 156 – 0.89 Cr 3.625 388 – 0.0 *Reference states.
Fig. 1. Schematic representation of the D022, D03and L12structures.
favoured. Experimentally, the ordered Ni3Fe-L12 is stable in
the Fe–Ni phase diagram below 790 K. The optimized lattice parameters are in agreement with experimental data [12] and the calculated Ef values of Ni3Fe and Ni3Cr agree with previous
calculated data [13].
3.3. X3Y -D022and -D03structures
X3Y-D022 and -D03have tetragonal and cubic structures,
re-spectively.
The first one, D022(4 atoms per unit cell), is based on TiAl3(tI8, I4
/
mmm, space group 139), where the Al atoms are located in 4d,2b, and Ti in 2a. The second one, D03(4 atoms per unit cell), has
a cubic structure
(
WFe3prototype, cF16, Fm3m, space group 225),where the Y atoms are in 4a, and the X atoms are in 4b and 8c (see Fig. 1). The atoms sit on the sites of a body centered cubic lattice.
There are many structures related to D022 and the continuity
between different lattices depends on the tetragonal c
/
a ratio.Thus, when c
=
2a, the atoms are on the sites of an fcc lattice, and when a/
c=
√
2, D022 becomes D03. These relations haveinduced some difficulties in the optimization of unit cells, and many minima (absolute and local) are often noticed, depending on the values of the lattice parameters. The ab initio results, presented in the assessment published earlier [27], correspond to those of D03and not D022. For the present paper, D022was computed again
Table 2
Optimized lattice parameters (in Å), formation energies E1
f (in meV/atom), Ef2
(in kJ/mol), and total magnetic moments (in Bohr’s magnetonµb) of X3Y-L12. We
have underlined systems with negative energies.
X/Y ao(Å) E1f Ef2 µ Nb/Ni 4.038 93 36.0 0.0 Nb/Fe 4.038 313 120.9 0.0 Nb/Cr 4.120 525 202.9 2.71 Ni/Nb 3.689 −154 −59.3 0.81 3.640 Theo. [14] Ni/Fe 3.548 −91 −35.2 4.78 3.545 −89 Theo. [13] 3.52 Exp. [12] Ni/Cr 3.565 −10 −3.7 2.17 3.55 Exp. [12] Fe/Nb 3.715 17 6.6 3.58 Fe/Ni 3.602 40 15.6 8.29 3.578 48 Theo. [13] Fe/Cr 3.545 43 16.6 2.79 Cr/Nb 3.801 486 187.4 1.9 Cr/Ni 3.577 214 82.7 0.0 Cr/Fe 3.575 243 93.9 0.21 Table 3
Optimized lattice parameters (in Å), formation energies E1
f (in meV/atom), Ef2
(in kJ/mol), and total magnetic moments (in Bohr’s magnetonµb) of D03and D022.
We have underlined systems with negative energies.
X/Y ao co Ef1 Ef2 µ X3Y-D022 Nb/Nb 3.879 9.812 144 55.6 0.0 Nb/Ni 3.943 8.488 83 32.2 0.0 Nb/Fe 3.772 9.174 210 81.3 0.0 Nb/Cr 3.768 9.486 256 98.7 0.0 Ni/Nb 3.643 7.484 −308 −118.7 0.0 3.63 7.42 – – – Exp. [15] Ni/Ni 3.520 7.058 0 0.0 2.5 Ni/Fe 3.546 7.104 −76 −29.2 4.5 Ni/Cr 3.490 7.194 4 1.4 0.0 Fe/Nb 3.569 8.258 14 5.5 5.7 Fe/Ni 3.472 7.378 84 32.3 2.3 Fe/Fe 3.462 6.884 161 62.1 0.0 Fe/Cr 3.480 7.026 120 46.4 0.0 Cr/Nb 3.494 8.888 334 129.1 0.0 Cr/Ni 3.580 7.138 178 68.7 0.0 Cr/Fe 3.537 7.338 256 99.0 0.0 Cr/Cr 2.793 7.076 274 105.7 0.0 X3Y-D03 Nb/Ni 6.416 21 8.0 0.0 Nb/Fe 6.355 7 2.7 0.1 Nb/Cr 6.412 81 31.3 0.0 Ni/Nb 5.862 −145 −55.7 0.0 Ni/Fe 5.650 17 6.4 4.4 Ni/Cr 5.653 107 41.4 2.0 Fe/Nb 5.898 −69 −26.5 5.1 Fe/Ni 5.690 292 111.8 3.0 Fe/Cr 5.669 60 23.2 5.6 Cr/Nb 5.952 68 26.2 0.0 Cr/Ni 5.700 218 84.2 0.1 Cr/Fe 5.697 116 44.6 2.0
and new formation energies and lattice parameters are reported. Results for D03and D022are listed inTable 3. Only two D022
(
Ni3Ywhere Y
=
Nb or Fe) structures are found to be thermodynamically favored, and one D03(Ni3Nb). These results are in agreement withexperimental observations.
Due to the importance of the metastable Ni3Nb-D022phase, its
elastic constants were computed [16]. The elastic constants of fcc-Ni, bcc-Nb and Ni3Nb-D022are reported inTable 4. Our results are
in agreement with experimental data [11,17] for reference states and with previous calculations of D022[18]. The elastic behavior of
Ni3Nb is found to be close to that of nickel. From these data, we
computed the bulk and shear moduli (within the Reuss, Voigt and
Table 4
Comparison of the elastic constants (in GPa) of the Ni3Nb-D022, Nb-bcc and Ni-fcc
phases. C11 C12 C13 C33 C44 C66 Bo Ni-fcc 274 160 – – 130 – 198 250a 150a – – 131a – 198b Ni3Nb-D022 285 180 159 306 113 119 208 288c 188c 162c 299c 115c 104c 211c Nb-bcc 235 137 – – 16 – 170 236a 139a – – 29a – 173b aExp. [17]. bExp. [11]. cTheo. [18]. Table 5
Reuss, Voigt and Hillt(BH,R,V, in GPa) bulk modulus, bulk modulus along x, y and
z directions (Ba,b,c, in GPa), anisotropic parameters(A1,2,3), Young’s modulus (E, in GPa), Poisson’s ratio (ν) and shear modulus (G, in GPa).
BH,R,V Ba,b Bc GR,V GH Ni 198 594 594 101 93 Ni3Nb-D022 208 624 624 94 90 Theo.[18] 211 656 591 91 86 Nb 171 513 513 29 25 A1,2 A3 E ν Ni 2.28 2.28 242 0.30 Ni3Nb-D022 1.66 2.27 235 0.31 Theo. [18] 1.75 2.08 228 0.32 Nb 0.33 0.33 72 0.43
Hill approximations) (Boand GH,R,V), the Young’s modulus (E), and
the Poisson’s ratio (
ν
), following relations given previously in [19]. The anisotropy was also investigated. The bulk modulus along thea, b and c axes (see appendix of [20]), and the shear anisotropic factors (Ai, a measure of the degree of elastic anisotropy) were
computed. The results are reported inTable 5.
Plotting the directional bulk modulus Bo showed that Bo is
isotropic (spherical shape), in spite of tetragonal symmetry of the system. This is confirmed by the values of Ba, Bband Bcwhich are
all equal.
3.4. X2Y -C36, -C14 and -C15 Laves phases
We have studied the three polymorphs of the Laves phase of composition X2Y: C36, C15 and C14. C36 (24 atoms/uc) is a
hexagonal structure (seeFig. 2), with MgNi2as prototype (hP24, P63
/
mmc, No. 194). Y atoms are located in 4e, 4f, and X in 6g, 6h and 4f. C14 (12 atoms/uc) has also a hexagonal symmetry, MgZn2-prototype (hP12, P6/mmc, space group 194), with Y atoms located
in 4f and X in 2a, 6h. Finally, C15 (6 atoms/uc), is based on MgCu2,
it is a cubic structure (cF24, Fd3m, space group 227) where the Y atoms are in 8a and the X atoms are in 16d sites of the diamond like structure.
The results are listed inTables 6–8. The Cr–Nb binary has been studied experimentally and theoretically by Grujicic et al. [21] and Pavlů et al. [22], respectively. In this system Cr2Nb is present at high
temperature as C14 and as C15 at low temperature. Moreover, C14 is also observed in the Fe–Nb phase diagram as Fe2Nb. We find that
X2Nb (where X
=
Ni, Fe and Cr)-C14, -C15 and -C36 have negativeenergies. In the previous study [27], one mistake appeared for Cr2Nb-C14, which is corrected here. A discussion of the magnetic
properties of Fe2Nb-C14 was presented previously [27]. We can
note that C14 is found to be weakly ferromagnetic, in agreement with our simulations (1.6
µb
). Our results are in agreement with experimental data for Cr2Nb, though C36 could have been expectedin the phase of C14. While Ni2Nb appears to be highly favored,
it does not show up in the Ni–Nb system where Ni3Nb appears
Fig. 2. Schematic representation of the X2Y-C14, -C15 and -C36 Laves.
Table 6
Optimized lattice parameters (in Å), formation energies E1
f (in meV/atom), E2f
(in kJ/mol), and total magnetic moments (in Bohr’s magnetonµb) of X2Y-C36. We
have underlined systems with negative energies.
X/Y ao co Ef Ec µ Nb/Nb 5.460 17.585 315 729.4 0.0 5.48 17.52 Theo. [22] Nb/Ni 5.273 17.027 540 1249.8 0.0 Nb/Fe 5.248 16.904 783 1813.3 0.0 Nb/Cr 5.339 17.224 693 1604.9 11.2 5.32 17.15 Theo. [22] Ni/Nb 4.805 15.648 −194 −449.8 2.3 Ni/Ni 4.615 14.948 215 498.0 13.8 Ni/Fe 4.637 15.098 89 207.3 32.6 Ni/Cr 4.587 15.037 240 556.3 0.3 Fe/Nb 4.793 15.822 −158 −366.6 8.1 Fe/Ni 4.645 15.124 184 425.8 39.2 Fe/Fe 4.555 14.845 367 849.6 8.8 Fe/Cr 4.665 15.184 153 354.9 6.6 Cr/Nb 4.911 16.060 −44 −101.7 0.0 4.90 16.02 Theo. [22] 4.82 15.77 −58 – Theo. [23] 4.87 15.26 Exp. [21] Cr/Ni 4.658 15.097 274 635.5 0.0 Cr/Fe 4.627 14.985 309 716.2 Cr/Cr 4.681 15.310 281 649.9 0.4 4.65 15.23 Theo. [22]
When a Laves phase is stable in a binary system, it is seen that the other two Laves phases have very similar Ef. This is
in line with the well known fact that various forms of Laves phases appear in either binary or ternary systems when varying the temperature and composition, as it is the case for the Cr–Nb system. In most cases, unstable Laves phases show similar positive
Ef values for each X/Y combination. There are, however, a few
exceptions: C14–Nb2Fe and –Fe2Fe that have less positive values
than the two other forms, while C36-Fe2Fe shows much higher
values than the other variants (the magnetism is not able to explain this ‘‘anomaly’’).
To complete the description of the stable structures, we report, for information, inTable 9optimized internal parameters. From one composition to another, these parameters vary only slightly (less than 5%).
3.5. X7Y6-D85
The prototype of D85is Fe7W6(labeled
µ
) with 13 atoms perunit cell. X7Y6-D85has a trigonal structure (hR13, R3m, space group
Table 7
Optimized lattice parameters (in Å), formation energies Ef (in meV/atom and
kJ/mol), and total magnetic moments (in Bohr’s magneton) of X2Y-C14. We have
underlined systems with negative energies.
X/Y ao co E1f Ef2 µ Nb/Nb 2.746 8.642 162 187.2 0.0 2.75 8.68 Theo. [22] Nb/Ni 2.648 8.381 555 642.4 0.0 Nb/Fe 2.624 8.198 21 24.8 0.0 Nb/Cr 2.741 8.033 743 860.8 0.0 2.69 8.36 Theo. [22] Ni/Nb 2.405 7.808 −201 −232.3 0.0 Ni/Ni 2.312 7.440 201 233.0 7.1 Ni/Fe 2.324 7.502 83 96.2 16.4 Ni/Cr 2.350 6.622 184 213.2 15.9 Fe/Nb 2.384 7.875 −150 −174.1 1.6 Fe/Ni 2.319 7.540 189 218.4 19.1 Fe/Fe 2.345 7.668 152 175.8 29.2 Fe/Cr 2.325 7.470 174 201.8 2.9 Cr/Nb 2.450 8.083 −35 −40.0 0.0 2.42 8.06 Theo. [22] 2.42 7.87 Theo. [23] 2.47 8.07 Exp. [24] Cr/Ni 2.338 7.534 288 333.6 0.0 Cr/Fe 2.317 7.459 322 372.8 0.0 Cr/Cr 2.335 7.691 290 335.3 −0.3 2.32 7.66 Theo. [22] Table 8
Optimized lattice parameters (in Å), formation energies Ef (in meV/atom and
kJ/mol), and total magnetic moments (in Bohr’s magneton) of X2Y-C15. We have
underlined systems with negative energies.
X/Y ao Ef1 E2f µ Nb/Nb 7.678 163 94.2 0.0 7.69 Theo. [22] Nb/Ni 7.429 511 295.8 0.0 Nb/Fe 7.393 780 451.6 0.0 Nb/Cr 7.456 626 362.2 5.7 7.50 Theo. [22] Ni/Nb 6.795 −188 −108.8 2.0 Ni/Ni 6.527 227 131.4 3.4 Ni/Fe 6.562 99 57.6 8.1 Ni/Cr 6.483 259 150.1 0.0 Fe/Nb 6.799 −148 −86.0 4.8 Fe/Ni 6.563 178 102.8 9.9 Fe/Fe 6.444 359 207.8 6.7 Fe/Cr 6.440 263 152.6 0.0 Cr/Nb 6.949 −48 −27.6 0.0 6.93 Theo. [22] 6.82 Theo. [23] 6.991 −77 Exp. [24] Cr/Ni 6.574 261 150.8 0.0 Cr/Fe 6.521 297 172.0 0.0 Cr/Cr 6.616 276 160.0 0.0 6.58 Theo. [22]
166), where the X atoms are in 1a and 6h, and the Y atoms are in 2c3(seeFig. 3). D8
5is present in the Ni–Nb and Fe–Nb systems.
Table 10shows that X7Nb6(where X
=
Ni and Fe) and Cr7Y6(where Y
=
Ni and Nb) have negative formation energies. Read et al. [25] studied the magnetic properties of the D85 phase inFe–Nb, and he concluded that D85 is anti-ferromagnetic below
270 K. In our simulations, restricting us to ferromagnetic behaviors, we found that Fe7Nb6 is ferromagnetic, with a total magnetic
moment equal to about 8.6
µb
. The difference in energy is generallysmall. For other structures, no experimental values have been reported.
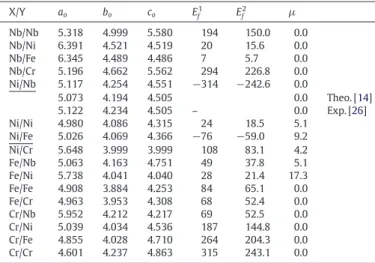
3.6. X3Y -D0a
D0ais based on the orthorhombic Cu3Ti-prototype (oP8, Pmmn,
Table 9
Internal parameters of stable structures (C14, C36, D85and D0a).
C36-X2Nb X 4f 1/3 2/3 0.1236 X 6g 1/2 0 0 X 6h 0.1639 0.3278 1/4 Nb 4e 0 0 0.0946 Nb 4f 1/3 2/3 0.8435 C14-X2Nb X 2a 0 0 0 X 6h 0.8311 0.6622 1/4 Nb 4f 1/3 2/3 0.0553 D85-X7Nb6 X 1a 0 0 0 X 6h 0.0907 0.5904 0.0907 Nb 2c 0.1683 0.1683 0.1683 Nb 2c 0.3445 0.3445 0.3445 Nb 2c 0.4510 0.4510 0.4510 D0a-X3Y Y 2b 1/2 1/2 0.3479 Y 4f 0.2493 0 0.1601 X 2a 0 0 0.6520
Fig. 3. Schematic representation of the D85, D0aandσ-D8bstructures.
Table 10
Optimized lattice parameters (in Å), formation energies E1
f (in meV/atom) Ef2
(in kJ/mol), and total magnetic moments (in Bohr’s magnetonµb) of X7Y6-D85. We
have underlined systems with negative energies.
X/Y ao co Ef1 Ef2 µ Nb/Nb 5.433 9.515 167 209.3 0.0 Nb/Ni 5.265 8.628 349 437.2 0.0 Nb/Fe 5.252 8.608 705 883.8 0.0 Nb/Cr 5.301 8.739 685 859.4 0.4 Ni/Nb 4.879 8.789 −223 −280.2 0.1 Ni/Ni 4.613 8.040 164 206.2 7.7 Ni/Fe 4.631 8.174 30 37.4 29.9 Ni/Cr 4.586 8.136 157 196.8 2.1 Fe/Nb 4.870 8.880 −140 −175.7 8.6 Fe/Ni 4.620 8.145 117 146.8 18.8 Fe/Fe 4.568 8.043 235 294.6 10.1 Fe/Cr 4.584 8.144 114 143.3 3.6 Cr/Nb 4.920 9.212 −8 −10.0 0.2 Cr/Ni 4.610 8.233 −136 −170.2 0.0 Cr/Fe 4.604 8.323 194 243.0 9.8 Cr/Cr 4.639 8.422 221 277.7 2.8
in 2a (seeFig. 3). Ni3Nb (
δ
) is the only known D0aphase in theFe–Ni–Nb–Cr quaternary system.
The results are listed inTable 11. Ab initio simulations reproduce the experimental data on Ni3Nb fairly well. We also predict another
Table 11
Optimized lattice parameters (in Å), formation energies E1
f (in meV/atom), Ef2
(in kJ/mol), and total magnetic moments (in Bohr’s magnetonµb) of X6Y2-D0a. We
have underlined systems with negative energies.
X/Y ao bo co Ef1 Ef2 µ Nb/Nb 5.318 4.999 5.580 194 150.0 0.0 Nb/Ni 6.391 4.521 4.519 20 15.6 0.0 Nb/Fe 6.345 4.489 4.486 7 5.7 0.0 Nb/Cr 5.196 4.662 5.562 294 226.8 0.0 Ni/Nb 5.117 4.254 4.551 −314 −242.6 0.0 5.073 4.194 4.505 0.0 Theo. [14] 5.122 4.234 4.505 – 0.0 Exp. [26] Ni/Ni 4.980 4.086 4.315 24 18.5 5.1 Ni/Fe 5.026 4.069 4.366 −76 −59.0 9.2 Ni/Cr 5.648 3.999 3.999 108 83.1 4.2 Fe/Nb 5.063 4.163 4.751 49 37.8 5.1 Fe/Ni 5.738 4.041 4.040 28 21.4 17.3 Fe/Fe 4.908 3.884 4.253 84 65.1 0.0 Fe/Cr 4.963 3.953 4.308 68 52.4 0.0 Cr/Nb 5.952 4.212 4.217 69 52.5 0.0 Cr/Ni 5.039 4.034 4.536 187 144.8 0.0 Cr/Fe 4.855 4.028 4.710 264 204.3 0.0 Cr/Cr 4.601 4.237 4.863 315 243.1 0.0 Table 12
Optimized lattice parameters (in Å), formation energies E1
f (in meV/atom), Ef2
(in kJ/mol), and total magnetic moments (in Bohr’s magnetonµb) of X8Y4Z18-σ.
We have underlined systems with negative energies.
X/Y/Z ao co Ef1 Ef2 µ Ni/Nb/Nb 9.715 5.257 209 605.8 0.0 Ni/Nb/Ni 8.763 4.625 −72 −207.7 0.1 Ni/Nb/Fe 8.820 4.692 8 24.5 39.9 Ni/Nb/Cr 8.850 4.770 132 383.1 0.0 Ni/Cr/Nb 9.570 5.160 226 654.5 0.0 Fe/Nb/Nb 8.849 5.198 254 734.0 15.8 Fe/Nb/Ni 8.839 4.644 −65 −185.6 24.8 Fe/Nb/Fe 8.926 4.692 −0 −0.3 54.7 Fe/Nb/Cr 8.778 4.787 153 444.3 12.0 Fe/Cr/Nb 9.691 5.095 304 880.9 19.5 Fe/Fe/Cr 8.649 4.617 143 415.3 17.6 Fe/Cr/Fe 8.448 4.462 171 494.7 15.0 Fe/Cr/Cr 8.650 4.630 131 378.2 12.1 Cr/Cr/Fe 8.645 4.495 63 181.3 20.2 Cr/Fe/Cr 8.768 4.577 155 448.4 8.5 Cr/Fe/Fe 8.626 4.460 98 285.2 12.1
favored structure, Ni3Fe, which is not present in the Ni–Fe phase
diagram.
3.7. X8Y4Z18-
σ
Due to the complex structure of
σ
phase (X8Y4Z18), we haverestricted ourself to some of them. X8Y4Z18 is based on FeCr-
σ
(D8b, P42
/
mmm, space group 136).σ
is composed of five nonequivalent positions, but only three sub-lattices were considered for the calculations. The X atoms are located in 8i, the Y atoms are in 4f and the Z atoms are in 2a, 8i and 8j, seeFig. 3. The first sub-lattice has been studied with Ni and Fe. The results are summarized in Table 12. Two systems
(
X8Nb4Ni18,
X=
Ni and Fe) have negativeenergies.
3.8. Conclusion
In conclusion, we have presented a systematic ab initio study of the formation energies and lattice parameters of the unary and binary phases and one ternary phase of the Ni–Nb–Cr–Fe system. We reproduce satisfactorily the experimental values for the lattice parameters and formation energies, and propose
Fig. 4. Formation energies for the Ni1−xYxalloys as a function of the Y content
expressed by x. Pentagons stand for Nb, stars for Cr and triangles for Fe.
formation energies for many metastable structures. InFig. 4, we have summarized main results for the Ni–Y (Y
=
Fe, Nb and Cr) binary phases, for which many negative formation energies were found. Thus, this first-principles database should provide a good complement to the available CALPHAD thermodynamic databases.Acknowledgments
The authors acknowledge the Midi-Pyrénées region for its financial support (No. 07009816). This work was granted access to the HPC resources of CALMIP (CICT Toulouse, France) under the allocation 2011-p0842.
References
[1] W.E. Quist, R. Taggart, D.H. Polonis, Metall. Trans. 2 (1971) 825–832. [2] J. Manenc, J. Bourgeot, H. De Boer, Scr. Metall. 2 (1968) 453–458. [3] I. Kirman, Scr. Metall. 2 (1968) 679–680.
[4] J. Manenc, Scr. Metall. 2 (1968) 705–706. [5] K.A. Peard, D.W. Borland, Scr. Metall. 3 (1969) 267. [6] V.V. Savin, Fiz. Met. Metalloved. 68 (1989) 143–149.
[7] T. Ueyama, M.M. Ghanem, N. Miura, M. Takeyama, T. Matsuo, Ther-mec’97, International Conference on Thermomechanical Processing of Steels and Others Materials, The Minerals, Metals and Materials Society, 1997, pp. 1753–1760.
[8] G. Kresse, J. Hafner, Phys. Rev. B 47 (1993) 558; 49 (1994) 14251; G. Kresse, J. Furthmüler, Phys. Rev. B 54 (1996) 11169; G. Kresse, J. Furthmüller, Comput. Mater. Sci. 6 (1996) 15. [9] G. Kresse, D. Joubert, Phys. Rev. B 59 (1999) 1758.
[10] J.P. Perdew, K. Burke, M. Ernzerhof, Phys. Rev. Lett. 77 (1996) 3865; J.P. Perdew, K. Burke, M. Ernzerhof, Phys. Rev. Lett. 78 (1997) 1396. [11] C. Kittel, Introduction to Solid State Physics, Wiley, New York, 1996. [12] Y. Tanaka, S. Ishida, S. Asano, Mater. Trans. 46 (2005) 355.
[13] Y. Mishin, M.J. Mehl, D.A. Papaconstantopoulos, Acta Mater. 53 (2005) 4029. [14] P. Ravindran, G. Subramoniam, R. Asokamani, Phys. Rev. B 53 (1995) 1129. [15] Superalloys: a technical guide By Matthew J. Donachie, Stephen James
Donachie ASM International, 2002 - Technology & Engineering.
[16] We employed six types of infinitesimal deformations to calculate Cij. Curves
were fitted with polynomial functions. 20×20×20 k-grid and 500 eV energy cut-off were used as convergence criteria.
[17] G. Simmons, H. Wang, Single Crystal Elastic Constants and Calculated Aggregate Properties: A Handbook, second ed. MIT Press, Cambridge, MA, 1971.
[18] S. Dai, W. Liu, Comput. Mater. Sci. 49 (2010) 414–418. [19] D. Connétable, O. Thomas, Phys. Rev. B 79 (2009) 094101.
[20] P. Ravindran, L. Fast, P.A. Korzhavyi, B. Johansson, J. Wills, O. Eriksson, J. Appl. Phys. 84 (1998) 4891.
[21] M. Grujicic, S. Tangrila, O.B. Cavin, W.D. Porter, C.R. Hubbard, Mater. Sci. Eng. A160 (1993) 37.
[22] J. Pavlü, J. V˘re˘st’ál, M. Šob, Calphad Comput. Coupling Phase Diagr. Thermochem. 33 (2009) 179.
[23] S. Hong, C.L. Fu, Intermetallics 7 (1999) 5.
[24] D.J. Thoma, J.H. Perezko, Mater. Sci. Eng. 1 156 (1992) 97.
[25] D.A. Read, G.C. Hallam, M.S. Sabota, A. Mustaffa, Phys. B 86–88 (1977) 66. [26] T. Fang, S.J. Kennedy, L. Quan, T.J. Hicks, J. Phys.: Condens. Matter. 4 (1992)
2405.
[27] M. Mathon, D. Connétable, B. Sundman, J. Lacaze, Calphad Comput. Coupling Phase Diagr. Thermochem. 33 (2009) 136–161.