To link to this article
: DOI:10.1016/j.msec.2012.08.005
http://dx.doi.org/10.1016/j.msec.2012.08.005
This is an author-deposited version published in:
http://oatao.univ-toulouse.fr/
Eprints ID: 9922
To cite this version:
Fabre, Paul-Louis and Latapie, Laure and Launay, Jérôme and Reynes,
Olivier and Temple-Boyer, Pierre Unexpected effect of copper ions on
electrochemical impedance behaviour of self-assembled alkylaminethiol
monolayer. (2013) Materials Science and Engineering: C, 33 (1). pp.
64-66. ISSN 0928-4931
O
pen
A
rchive
T
oulouse
A
rchive
O
uverte (
OATAO
)
OATAO is an open access repository that collects the work of Toulouse researchers and
makes it freely available over the web where possible.
Any correspondence concerning this service should be sent to the repository
administrator:
[email protected]
Unexpected effect of copper ions on electrochemical impedance behaviour of
self-assembled alkylaminethiol monolayer
Paul-Louis Fabre
a,b, Laure Latapie
a,b, Jérôme Launay
c, Olivier Reynes
a,b,⁎
, Pierre Temple-Boyer
caUniversité Paul Sabatier, Laboratoire de Génie Chimique, Bat. 2R1, 118 route de Narbonne, F-31062 Toulouse cedex 09, France bCNRS, Laboratoire de Génie Chimique UMR 5503, F-31062 Toulouse cedex 09, France
cCNRS, Laboratoire d'Analyses et d'Architectures des Systèmes, UPR 8001, 7 Avenue du Colonel Roche, 31077 Toulouse Cedex4, France
a b s t r a c t
Keywords:
Equivalent electrical circuit Self-assembled monolayer
Electrochemical impedance spectroscopy
Effect of copper ions on the electrochemical behaviour of an alkylaminethiol monolayer has been studied by electrochemical impedance spectrosocpy. RAMAN experiment shows the effective adsorption of receptor onto the gold surfaces. The study of Nyquist plot shows that the gold/monolayer/electrolyte interface can be described by a serial combination of two R, CPE electrical circuits. In the presence of increasing amounts of copper, the Nyquist plots at low frequencies were modified showing an increase of the resistance of the second R, CPE electrical circuit. Moreover, this increase of resistance varies linearly with the amounts of cop-per ions added in solution from 10−8mol·L−1to 10−5mol·L−1.
1. Introduction
The electrochemical impedance spectroscopy (EIS) was a method currently used to study the electrochemical sensing properties of sen-sors built with self assembled monolayers [1–3]. In the absence of redox probe in solution, EIS was more sensible than cyclic voltammetry to study the change on the electrical interface properties due to the in-teractions between the guest and the immobilized receptor[4]. Many works have shown that gold/monolayer/electrolyte interface can be de-scribed by a simple electrical circuit which associates an electrolyte re-sistance to a R, CPE parallel electrical circuit[5,6]. Ben Ali et al. have shown that in the presence of copper ions the charge transfer resistance of the sensitive layer decreases linearly with Cu2+concentration when
a negative dc potential was applied[7]. On the other hand, some works have shown that an additional R, CPE parallel electrical circuit can be added to describe the gold/short thiol/solution interface[8,9]. This sec-ond R, CPE electrical circuit could be related to the monolayer's ability to store a charge[8]or the reorganization of the thiol monolayers on the surface[9], the interpretation of this second electrical circuit was not clear. Bjorefos et al. have shown that in the presence of aluminium ions for positive dc applied potential at low frequencies, the resistance of the second electrical circuit increases from 20% to 30% in the presence of 10−4mol·L−1of Al ions[10]. Taking into account these previous
works, the electrical circuit to describe the EIS behaviour of a monolayer
was not again clearly defined. Moreover, it seems that the EIS behaviour in the presence of cations depending on the dc potential applied.
In this work, a monolayer formed by the adsorption of a thiol amine compound onto the gold surface was characterized by RAMAN spec-troscopy. The electrical parameters corresponding to the gold/SAM/ electrolyte interface and the effect of copper ion were studied by EIS. 2. Experimental
2-aminoethanethiol (1), potassium nitrate and copper nitrate were purchased from Sigma-Aldrich and were used without purification. The gold surfaces were cleaned with piranha solution for 30 s then were thoroughly rinsed with water and ethanol. A monolayer of 2-aminoethanethiol (1) was formed by dipping the gold surfaces (elec-trodes or gold squares; area: 1 cm2) for 4 h into an ethanolic solution
containing 10−3mol·L−1of 1. The modified surfaces were then rinsed
thoroughly with water and ethanol in order to remove the weakly adsorbed 1. They were dried under vacuum for 6 h. The RAMAN spectra were carried out with a LABRAM HR 800 equipped with a Helium–Neon laser (λ=638.8 nm).
The gold electrodes, used as working electrode for electrochemical ex-periments, were fabricated by using microelectronic mass-fabrication processes. Firstly, P-type (3–5 Ω.cm) silicon substrates were thermally oxidized to grow an 800 nm thick silicon oxide (SiO2) layer. The whole
metallization process was optimised in order to obtain a good adherence of titanium/gold (Ti/Au — 30 nm/300 nm) layers on the wafer while maintaining good upper interface properties. This optimisation was obtained by suppressing the Ti/Au annealing process and by using low-deposition rates (≈1 nm/min) for both evaporation processes. The gold electrodes were capped by a SiO2 layer deposited by PECVD
⁎ Corresponding author at: Université Paul Sabatier, Laboratoire de Génie Chimique, Bat. 2R1, 118 route de Narbonne, F-31062 Toulouse cedex 09, France. Tel.: +33 5 61 55 61 21; fax: +33 5 61 55 61 39.
technique (Plasma Enhanced Chemical Vapour Deposition) to protect the electrical stripes and to define precisely the gold sensitive area (1 mm2).
Photolithography was especially developed to obtain mass fabrication and the precise design for the SiO2deposition.
Impedance measurements were performed using a classical three-electrode cell. The counter and reference three-electrodes were a platinum wire and a saturated calomel electrode (S.C.E.), respectively. All electrochemical measurements were carried out at room temperature. An aqueous solution KNO3 0.1 mol·L−1 (pH=5–6) was used as
supporting electrolyte. Nyquist plots were recorded using a μ autolab Fra II in a frequency range from 10 kHz to 50 mHz at an open circuit volt-age (E=0.6 V/SCE). The amplitude of alternating voltvolt-age was 10 mV. The modified electrodes were dipped into copper ion solution for 20 min be-fore to record the Nyquist plots. The resistances (R) and the constant phase elements (CPE) were estimated, the first time, using the FRA soft-ware. These values were then used and adjusted to simulate experimental data, by using the ZSim demo 3.20 freeware, in order to validate the as-sumed equivalent circuit.
3. Results
Raman spectroscopy experiments were carried out to verify that the compound 1 was adsorbed onto the gold surfaces. After to have dipped the gold square into an ethanolic solution containing 1 mmol·L− 1
of sulphur–amine compound 1, the modi-fied gold surface was studied by Raman spectroscopy (Fig. 1).
In depict of a low surface coverage (Γ1around 10−9–10−10mol·cm−2
[11]), the Raman spectrum confirms the presence of receptor 1 absorbed onto gold surface. Indeed, a peak around 2800 cm−1corresponding to
CH2groups was observed[12]. Moreover, the presence at 1600 cm−1of
an ill defined shoulder shows the presence of amine end group. The electrochemical behaviours of the gold bare electrodes and the gold electrodes modified by a self-assembled monolayer of 1 were stud-ied in free copper solution by electrochemical impedance spectroscopy (Fig. 2).
For the unmodified gold electrodes (insertFig. 2), the Nyquist plot in the absence of redox probe exhibits a semi circle at 0.6 V versus S.C.E. This electrochemical behaviour (representing the gold/electrolyte inter-face) has been interpreted in terms of electrical equivalent circuit by a simple model (Fig. 2) which associated a serial combination of electrolyte resistance (Re) and a circuit containing the polarization resistance (R1) in
parallel with the Constant Phase Element (CPE1). At this applied potential
the impedance of Warburg is minimised. The polarization resistance R1
corresponding to the diameter of the semi circle was determined by the cross points between the semi-circle and the Zr axis at high and low fre-quencies. The polarization resistance of electrode was estimated to be 3400±10 Ω·cm−2. The Nyquist plots of gold/SAMs/electrolyte interface
exhibit also, in free copper solution, the beginning of a semi-circle with a diameter which is higher than this observed for the gold bare electrode. Similar behaviour has been already reported for gold surfaces modified by a monolayer of mercaptoundecanoic acid in the presence of redox probe[6]. The high value of the charge transfer resistance reported for gold/mercaptoundecanoic acid interface (around 700 kΩ·cm−2) was
explained by the high insulating properties of thiol adsorbed on gold. In this work, the polarization resistance (R1) of gold/thiol interface was
esti-mated (taking into account the simple model described above) to be 880±10 kΩ·cm−2 (Fig. 2). This increase of resistance at the SAM's/
electrolyte interface shows an increase of the insulating properties of the monolayer of 1 due to the formation of a more compact organic layer. Indeed, adsorption of thiol with a weak length chain increases the coverage surface (less area defects) compared to sulphur compounds with a long carbonated skeleton.
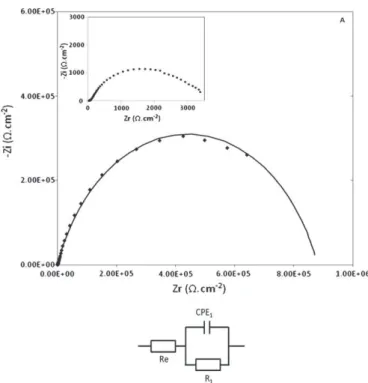
However, in a frequency range from 10 kHz to 35.8 Hz, the simulated Nyquist plots did not fit with the experimental data showing that the sim-ple model used for the gold/thiol/electrolyte interface was not adapted (Fig. 3).
Taking into account the previous works[8,9]an additional R2, CPE2
parallel electrical circuit can be added to the simple equivalent circuit (insertFig. 2) to describe the gold/short thiol/solution interface. The resulting equivalent electrical circuit (insertFig. 3) contains then the
Fig. 1. RAMAN spectrum recorded after functionalization of gold surface by receptor 1.
Fig. 2. In insert: Nyquist plots for the gold bare electrode (•). Nyquist plots for the gold electrode modified by a monolayer of 1 (♦). Fitting curve obtained by using the electri-cal circuit represented here (—).
Fig. 3. Nyquist plots for the gold electrode modified by a monolayer of 1 recorded in the frequency range from 10 kHz to 35.8 Hz (♦). Fitting curve obtained by using the simple electrical circuit describesFig. 2(− − −). Fitting curve obtained using the elec-trical circuit added in inset (—).
electrolyte resistance (Re) associated to a serial combination of two R, CPE parallel electrical circuit. The first R1, CPE1electrical circuit could be
relat-ed to the ion permeation inside the monolayer and was observrelat-ed at high frequency range. The second R2, CPE2parallel electrical circuit which was
observed at low frequency corresponds to the SAM end group/electrolyte interface. This extra R, CPE circuit was related to either the ability of the monolayer to store a charge at the SAM/electrolyte interface and the ease to move an ion from the interface to the SAM[8]or a change of struc-ture of the SAM[9]. This point is not clear and is subject to discussion. Whatever it was, the simulated curves fit better with the experimental data at high and low frequencies (Fig. 3 and Fig. 4).
Addition of copper ions to KNO30.1 mol·L−1solution modified
the Nyquist plots of the functionalized gold electrodes (Fig. 4). In the presence of increasing amounts of copper cations in solution, an increase of the diameter of the semi circle was ob-served until 10− 5mol·L− 1of Cu2 + added. A similar behaviour
has been reported for electrodes modified by SAM of phosphorylat-ed tyrosine-terminatphosphorylat-ed propanethiol[10]. Indeed, when a positive dc potential was applied, an increase of the resistance at low fre-quency was observed in the presence of 100 μM of aluminium ions. Taking into account the equivalent electrical circuit (insert
Fig. 3), this is the resistance of the second R2, CPE2parallel circuit
which increases in the presence of copper ions. This increase of re-sistance could be explained by the formation of a more compact monolayer due to a reorganization of the amine end group of the monolayer. Indeed, the binding of copper ions needs two amine groups per Cu2 +ion which induces a change of the structure of the monolayer at the interface SAM/electrolyte. In this case, the area defects were reduced and the layer becomes more insulating. This kind of behaviour has been already reported by Echegoyen et al. [13]. In the presence of potassium cations, a change of the structure of the SAM was observed. After removing the ions, the
resistance of charge transfer was increased showing that the SAM became more compact.
Using the assumed electrical circuit (Fig. 3), the analysis of Nyquist plots shows that R2increases until 1230 ± 10 kΩ·cm−2in the presence
of 10−5mol·L−1of Cu2+(Table 1). The uncertainties associated to R 1
and CPE1were too large probably due to the strong influence of the
sec-ond electrical circuit which masks them.
The evolution of ΔR2(ΔR2=R2in the presence of copper−R2in free
copper solution) was followed in function of copper concentrations added in solution (Fig. 5).
Between 10−8mol·L−1and 10−5mol·L−1, ∆R
2increases linearly
with the copper ion concentration. Above 10−5mol·L−1of copper ions,
the ∆R2was unchanged showing the saturation of sensitive monolayers
adsorbed on gold surface. 4. Conclusion
RAMAN spectroscopy shows the effective adsorption of thiol amine compound onto the gold surface. Analysis of Nyquist plots of the mod-ified electrode shows that the equivalent electrical circuit which trans-duces the electrical properties of the gold/monolayer/interface contains two R, CPE parallel circuit. In the presence of Cu2+, the resistance R2
in-creases linearly with the copper concentrations from 10−8mol·L−1to
10−5mol·L−1of copper ions. The unexpected increase of R
2was
prob-ably due to a reorganization of the thiol monolayers which form a more compact layer with an increase of its insulating properties.
Acknowledgements
The authors would like to thank Mrs C. Routaboul for her assis-tance in the RAMAN spectroscopy.
References
[1] B. Pejcic, R. De Marco, Electrochim. Acta 51 (2006) 6217.
[2] V. Ganesh, M.P.C. Sanz, J.C. Mareque-Rivas, Chem. Commun. (2007) 5010. [3] C. Ribaut, K. Reybier, O. Reynes, J. Launay, A. Valentin, P.-L. Fabre, F. Nepveu,
Biosens. Bioelectron. 24 (2009) 2721.
[4] M.A. Herranz, B. Colonna, L. Echegoyen, PNAS 99 (2002) 5040.
[5] F. Darain, D.-S. Park, J.-S. Park, Y.B. Shim, Biosens. Bioelectron. 19 (2004) 1245. [6] A. Tlili, A. Abdelghani, S. Ameur, N. Jaffrezic-Renault, Mater. Sci. Eng. C 26 (2006) 546. [7] M. Ben Ali, T. Homri, Y. Korpan, M. Ali Maaref, L. Liu, N. Jaffrezic-Renault, C.
Martelet, Mater. Sci. Eng. C 26 (2006) 149.
[8] Boubour, R.B. Lennox, J. Phys. Chem. B 10 (4) (2000) 9004. [9] R.P. Janek, W.R. Fawcett, J. Phys. Chem. B 101 (1997) 8550. [10] F. Bjorefors, R.M. Petoral Jr., K. Uvdal, Anal. Chem. 79 (2007) 8391. [11] M. Wirde, U. Gelius, L. Nyholm, Langmuir 15 (1999) 6370–6378.
[12] L. Riauba, G. Niaura, O. Eicher-Lorka, E. Butkus, J. Phys. Chem. A 110 (2006) 13394–13404.
[13] B. Colonna, L. Echegoyen, Chem. Comm. (2001) 1104–1105. Fig. 4. Nyquist plots recorded for a gold electrode modified by a monolayer of 1 in
KNO30.1 mol·L−1at an applied potential to 0.6 V versus S.C.E in the presence of
cop-per ions. (■: 0 mol·L−1; ♦: 10−8mol·L−1; ▲: 10−7mol·L−1; ●: 10−6mol·L−1; Δ:
10−5mol·L−1; □: 10−4mol·L−1). Fitting curve obtained using the electrical circuit
added in insertFig. 3(—).
Table 1
Simulated values of electrical elements in the equivalent circuit (Fig. 3) obtained by fitting the experimental data.
Cu2+ concentration (mol·L−1) CPE110−5 (F·cm−2) R1 (kΩ·cm−2) CPE2(Q) 10−4 (F·cm−2) R2 (kΩ·cm−2) 0 1.26 ± 0.6 100 ± 50 2.19 ± 0.1 880 ± 10 10−8 a a 2.87 ± 0.1 950 ± 10 10−7 a a 3.75 ± 0.15 1050 ± 20 10−6 a a 3.07 ± 0.15 1130 ± 20 10−5 a a 3.07 ± 0.15 1230 ± 20 10−4 a a 3.05 ± 0.15 1250 ± 20 a
Not indicated due to too large uncertainties.