Pépite | Optimisation des laboratoires d'analyses médicales
164
0
0
Texte intégral
(2) Thèse de Sohrab Faramarzi Oghani, Université de Lille, 2018. © 2018 Tous droits réservés.. lilliad.univ-lille.fr.
(3) Thèse de Sohrab Faramarzi Oghani, Université de Lille, 2018. Abstract This thesis focuses on the optimization of clinical laboratory design and operating decisions. A clinical laboratory is an organization gathering human and machinery resources to analyze blood samples. In this thesis, a decision support tool including mathematical models, a heuristic algorithm and a customized simulation model is developed to aid decision makers for the main strategic, tactical and operational problems in clinical laboratory design and operations management. This decision support tool follows a top-down stepwise framework starting from strategic problems and ending with operational ones, including a recursive loop for modification and improvement. In this thesis, machine selection and facility layout are studied as the main strategic problems, analyzer configuration as the tactical problem, and assignment, aliquoting and scheduling as the principal operational problems. In order to deal with the machine selection problem for a clinical laboratory, a mathematical model is proposed which aids to select the most appropriate machines to equip the system. To tackle the physical arrangement of instruments within the laboratory area, a heuristic approach is developed. The proposed heuristic comprises the key constraints of laboratory layout design. To address the analyzer configuration problem which mainly deals with the assignment of chemical materials to the analyzers in a clinical laboratory, a bi-objective mathematical model is developed. In addition, to determine an efficient assignment of sample tubes to the analyzers, a mathematical model with three objectives is proposed. A customized, flexible, and fine-grained simulation model is developed in FlexSim to study the clinical laboratory designed through the outputs of developed mathematical models and layout algorithm. Simulation model plays a key role in the proposed framework as it is used for many purposes. The simulation model helps the designer to construct and analyze a complete clinical laboratory taking into account all major features of the system. This simulation attribute provides the ability to scrutinize the system behaviour and to find out whether the designed system is efficient. System performance analysis through simulation and resulting key performance indicators give helpful feedback for system improvement. Furthermore, the simulation model can be fruitful to decide on scheduling, aliquoting and staffing problems through the evaluation of various scenarios proposed by the decision maker for each of these problems. To verify the validity of the proposed framework, data extracted from a real case is used. The output results seal on the applicability and the efficiency of the proposed framework as well as competency of proposed techniques to deal with each optimization problem. To the best of our knowledge, this thesis is one of the leading studies on the optimization of clinical laboratories. Keywords: Clinical laboratory, optimization, machine selection problem, facility layout problem, analyzer configuration problem, assignment problem, aliquoting problem, scheduling problem, mathematical modeling, heuristic algorithm, computer simulation, FlexSim.. © 2018 Tous droits réservés.. lilliad.univ-lille.fr.
(4) Thèse de Sohrab Faramarzi Oghani, Université de Lille, 2018. To My sweetheart, Parisa My parents, Maman and Baba My brother, Saeed My grand-parents All my family members, friends, teachers, and My loneliness. © 2018 Tous droits réservés.. lilliad.univ-lille.fr.
(5) Thèse de Sohrab Faramarzi Oghani, Université de Lille, 2018. Acknowledgment Finally, the last section of my thesis came, the hardest but the sweetest! I would like to express my sincere gratitude to my supervisor Prof. El-Ghazali Talbi for his continuous support and invaluable guidance and also, for providing a pleasant working environment during three years. I learnt a lot from him and always enjoyed working with him. I would like to express my special appreciation to Dr. Eric Varlet for sharing his invaluable knowledge and experiences on clinical laboratories during three years. We always put our minds together to solve a problem. Thanks for always pushing me to be the best I can be. I would like to thank my jury members: Prof. Yves Crama, Dr. Alice Yalaoui, Pr. Greet Vanden Berghe, and Prof. David Duvivier for reviewing my thesis and their insightful comments and critics.. I’m grateful to my colleagues in BONUS (previously DOLPHIN) and INOCS teams, specially to Martin Bué for his support, sympathy and cooperation during three years. I also would like to thank Othman Touijer for his valuable contributions on simulation aspect of this project. I also would like to take this opportunity to thank my wife, Parisa, for her kind and endless support and encouragement. Thanks for having my back! Last but not least, I would like to thank my parents, my brother, my grand-parents and all my family members and friends and of course my teachers.. © 2018 Tous droits réservés.. lilliad.univ-lille.fr.
(6) Thèse de Sohrab Faramarzi Oghani, Université de Lille, 2018. Table of Contents Chapter 1: Introduction to Clinical Laboratory Optimization ........................................................ 1 1.1. Introduction to clinical laboratory optimization project ..................................................................... 2 1.1.1. Motivation and significance ........................................................................................................ 2 1.1.2. Project foundation and research collaboration ............................................................................ 2 1.2. Introduction to clinical laboratory organization .................................................................................. 3 1.2.1. Terminology ................................................................................................................................ 3 1.2.2. Clinical laboratory structure ........................................................................................................ 4 1.2.3. Patient sample workflow: from sample collection to tests result preparation ........................... 5 1.3. Introduction to clinical laboratory main decision problems ............................................................... 9 1.4. Application of operations research in clinical laboratory optimization: a survey ............................. 11 1.5. Proposed framework for clinical laboratory optimization ................................................................. 12 1.6. Sources of information and case study ............................................................................................. 14 1.6.1. Case study .................................................................................................................................. 15 1.7. Data management .............................................................................................................................. 16 1.8. Thesis main contributions .................................................................................................................. 17 1.9. Thesis structure .................................................................................................................................. 17. Chapter 2: Machine Selection Problem for Clinical Laboratories ................................................. 19 2.1. Introduction to machine selection problem in industries ................................................................... 20 2.2. Machine selection for clinical laboratories ........................................................................................ 24 2.3. Proposed mathematical model ........................................................................................................... 25 2.3.1. Definitions and problem assumptions ........................................................................................ 25 2.3.2. Notations .................................................................................................................................... 27 2.3.3. Mathematical model ................................................................................................................... 29 2.4. Model variation .................................................................................................................................. 30 2.4.1. Multi-part analyzers (Multi-discipline analyzers) ...................................................................... 30 2.5. Model decomposition ........................................................................................................................ 33 2.6. Model validation ................................................................................................................................ 34 2.6.1. Description of the case study...................................................................................................... 34 2.6.2. Numerical results ........................................................................................................................ 35 2.7. Conclusion ......................................................................................................................................... 36. Chapter 3: Facility Layout Problem for Clinical Laboratories ...................................................... 38 3.1. Introduction and literature review...................................................................................................... 39 3.1.1. FLP variations ............................................................................................................................ 39 3.1.1.1. System characteristics impacting the FLP .......................................................................... 39. © 2018 Tous droits réservés.. lilliad.univ-lille.fr.
(7) Thèse de Sohrab Faramarzi Oghani, Université de Lille, 2018. 3.1.1.2. Static vs. dynamic FPL....................................................................................................... 41 3.1.1.3. Discrete vs. continuous FLP ............................................................................................... 41 3.1.1.4. Single-objective vs. multi-objective FLP ........................................................................... 42 3.1.2. Modeling approaches for the FLP .............................................................................................. 42 3.1.3. Resolution approaches for the FLP ............................................................................................ 44 3.2. Facility layout design for clinical laboratories with a standalone sorter ............................................ 47 3.2.1. Definitions and problem assumptions ........................................................................................ 47 3.2.1.1. Laboratory area-related definitions and assumptions ......................................................... 47 3.2.1.2. Facility-related definitions and assumptions ...................................................................... 48 3.2.2. Objective function ...................................................................................................................... 48 3.2.3. Problem constraints .................................................................................................................... 49 3.3. Resolution approach .......................................................................................................................... 49 3.3.1. Generation of initial solutions .................................................................................................... 50 3.3.1.1. Facility sorting ................................................................................................................... 50 3.3.1.2. Facility placement .............................................................................................................. 50 3.3.2. Selection of diverse solutions .................................................................................................... 53 3.3.3. Improvement of the selected solutions ....................................................................................... 53 3.4. Experimental results .......................................................................................................................... 54 3.5. Conclusion ......................................................................................................................................... 57. Chapter 4: Analyzer Configuration Problem for Clinical Laboratories ....................................... 59 4.1. Introduction........................................................................................................................................ 60 4.2. Analyzer configuration problem ........................................................................................................ 61 4.3. First proposed mathematical model ................................................................................................... 61 4.3.1. Assumptions ............................................................................................................................... 62 4.3.2. Notations .................................................................................................................................... 63 4.3.3. Mathematical formulation .......................................................................................................... 65 4.4. Model variations ................................................................................................................................ 54 4.4.1. Analyzer configuration problem with reagent disposal minimization........................................ 66 4.4.2. Analyzer configuration problem with multi suppliers ................................................................ 66 4.5. Second proposed mathematical model............................................................................................... 68 4.5.1. Assumptions ............................................................................................................................... 69 4.5.2. Notations .................................................................................................................................... 70 4.5.3. Mathematical formulation .......................................................................................................... 72 4.6. Resolution approach and computational results................................................................................. 73 4.6.1. Solution procedure ..................................................................................................................... 73 4.6.2. Case study and numerical results................................................................................................ 74 4.7. Conclusion ......................................................................................................................................... 77. © 2018 Tous droits réservés.. lilliad.univ-lille.fr.
(8) Thèse de Sohrab Faramarzi Oghani, Université de Lille, 2018. Chapter 5: Operational Problems of Clinical Laboratories .......................................................... 78 5.1. General introduction to operational problems in clinical laboratories ............................................... 79 5.2. Assignment problem for clinical laboratories .................................................................................... 79 5.2.1. Introduction to the assignment problem ..................................................................................... 79 5.2.1.1. The classic assignment problem ......................................................................................... 80 5.2.1.1.1. Mathematical model ............................................................................................... 80 5.2.1.1.2. Graph model ........................................................................................................... 80 5.2.1.2. The generalized assignment problem (GAP) ..................................................................... 81 5.2.2. Assignment problem description for clinical laboratories .......................................................... 82 5.2.3. Proposed mathematical model .................................................................................................... 82 5.2.3.1. Assumptions ....................................................................................................................... 84 5.2.3.2. Notations ............................................................................................................................ 85 5.2.3.3. Mathematical formulation .................................................................................................. 87 5.2.3. Resolution approach and computational results ......................................................................... 91 5.3. Aliquoting problem for clinical laboratories...................................................................................... 94 5.3.1. Introduction to the aliquoting problem ....................................................................................... 94 5.3.2. Proposed global frameworks for the aliquoting problem ........................................................... 96 5.3.2.1. First proposed framework for the aliquoting problem........................................................ 96 5.3.2.2. Second proposed framework for the aliquoting problem ................................................... 98 5.4. Scheduling problem for clinical laboratory ....................................................................................... 99 5.4.1. Introduction to the scheduling problem ...................................................................................... 99 5.4.1.1. Scheduling theory vs. scheduling practice ....................................................................... 101 5.4.1.2. Widely used approaches for the scheduling problems in practice .................................... 101 5.4.1.2.1. Dispatching rules .................................................................................................. 102 5.4.2. Description of the clinical laboratory scheduling problem....................................................... 102 5.4.3. Proposed approach for the clinical laboratory scheduling problem ......................................... 104 5.5. Conclusion ....................................................................................................................................... 104. Chapter 6: Clinical Laboratory Simulation Modeling and Analysis ........................................... 106 6.1. Introduction to computer simulation ................................................................................................ 107 6.1.1. Types of simulation models...................................................................................................... 107 6.1.2. Important concepts in simulation studies ................................................................................. 108 6.1.3. How to conduct a successful simulation model? ...................................................................... 109 6.2. Toward a customized environment for clinical laboratory simulation modeling ............................ 111 6.2.1. Customized simulation environment main characteristics ....................................................... 112 6.3. Clinical laboratory simulation modeling ......................................................................................... 113 6.3.1. General standalone clinical laboratory workflow ..................................................................... 113 6.3.2. Simulation model inputs and assumptions ............................................................................... 117. © 2018 Tous droits réservés.. lilliad.univ-lille.fr.
(9) Thèse de Sohrab Faramarzi Oghani, Université de Lille, 2018. 6.3.2.1. Measurement units ........................................................................................................... 117 6.3.2.2. System components .......................................................................................................... 118 6.3.2.2.1. System components: facilities............................................................................... 118 6.3.2.2.2. System components: operators ............................................................................ 122 6.3.2.3. System entities ................................................................................................................. 124 6.3.2.4. System layout ................................................................................................................... 125 6.3.2.5. Assignment, aliquoting and scheduling in clinical laboratory ......................................... 125 6.3.2.6. Other assumptions ............................................................................................................ 125 6.3.3. Key performance indicators (KPIs) .......................................................................................... 126 6.3.4. Simulation model in FlexSim ................................................................................................... 126 6.4. Simulation output results ................................................................................................................. 129 6.5. Conclusion ....................................................................................................................................... 138. Chapter 7: General Conclusion and Future Perspectives ............................................................. 140 7.1. General conclusion .......................................................................................................................... 141 7.2. Future perspectives .......................................................................................................................... 142 7.3. List of publications and scientific productions ................................................................................ 144. References .......................................................................................................................................... 145. © 2018 Tous droits réservés.. lilliad.univ-lille.fr.
(10) Thèse de Sohrab Faramarzi Oghani, Université de Lille, 2018. List of Tables 1-1. Main sources of information used for data extraction in each step of the project ......................... 15 1-2. Statistical status of the tests requested by each class of tubes in the case study ............................ 15 2-1. Notations used in the proposed mathematical model .................................................................... 27 2-2. Modifications required to add multi-part analyzers....................................................................... 31 2-3. Numerical results ........................................................................................................................... 35 3-1. All clinical laboratory instruments ................................................................................................ 55 4-1. Notations used in the first proposed mathematical model ............................................................. 63 4-2. Modifications required to build the multi-supplier analyzer configuration model ........................ 67 4-3. Notations used in the second proposed mathematical model ........................................................ 70 4-4. Extreme values of each objective function .................................................................................... 75 4-5. Value of objective functions under different importance factors .................................................. 76 4-6. A portion of analyzer configuration solution................................................................................. 76 5-1. Notations used in the proposed mathematical model .................................................................... 85 5-2. Extreme values of each objective function .................................................................................... 91 5-3. Values of objective functions under different sets of importance factors ..................................... 92 5-4. Assignment of tubes to the analyzers ............................................................................................ 92 5-5. Assignment of tubes’ tests to the analyzers ................................................................................... 93 5-6. Assignment output results.............................................................................................................. 93 6-1. Clinical laboratory instruments.................................................................................................... 118 6-2. The number and duties of operators in the clinical laboratory .................................................... 123 6-3. A portion of raw data extracted from a simulation run................................................................ 132 6-4. A portion of the main clinical laboratory KPIs............................................................................ 133 6-5. A portion of the main clinical laboratory KPIs for dynamic tube arrival .................................... 137. © 2018 Tous droits réservés.. lilliad.univ-lille.fr.
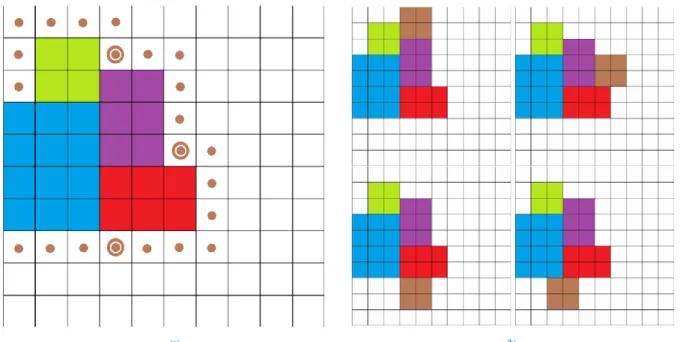
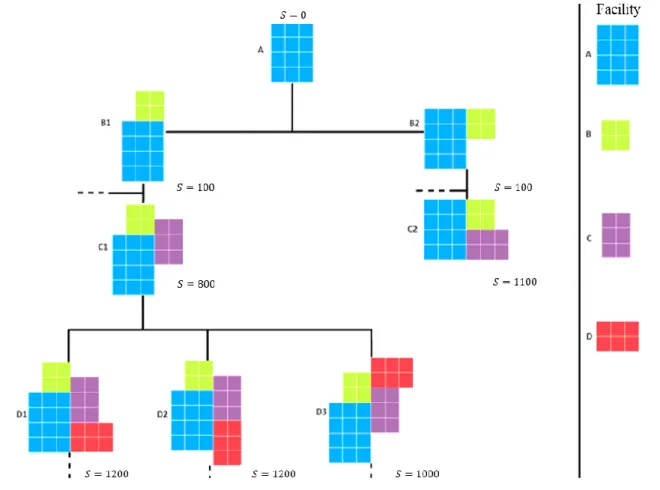
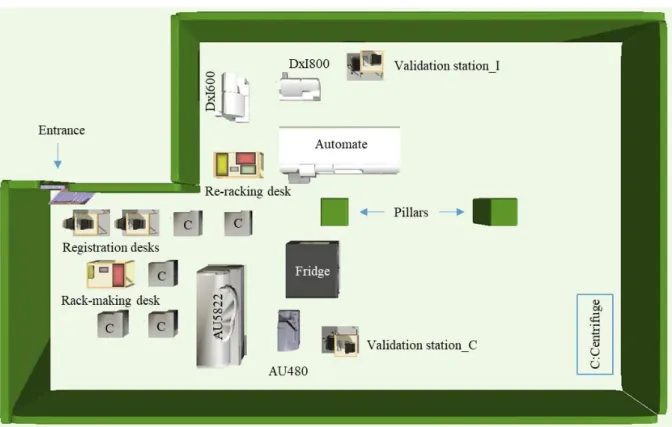
(11) Thèse de Sohrab Faramarzi Oghani, Université de Lille, 2018. List of Figures 1-1. Clinical laboratory network ............................................................................................................. 5 1-2. Schematic of patient sample flow .................................................................................................... 8 1-3. Main steps of operations in examination site................................................................................... 8 1-4. Clinical laboratory main design and planning decision problems ................................................. 10 1-5. Procedure applied to tackle optimization problems ....................................................................... 13 1-6. Proposed framework for efficient CL design ................................................................................ 14 1-7. Control panel of the developed Excel-based tool for data management ....................................... 16 2-1. Equipment selection problem resolution approaches .................................................................... 24 2-2. Example of an analyzer with two parts and useful notations......................................................... 31 2-3. Model decomposition procedure ................................................................................................... 33 2-4. Selected machines to equip the clinical laboratory ........................................................................ 36 3-1. Regular and irregular facility shapes ............................................................................................ 40 3-2. (a) Flow patterns and FLP. (b) Facility pick-up and drop-off locations. (c) backtracking and bypassing .............................................................................................................................................. 41 3-3. Multi-floor layout ......................................................................................................................... 41 3-4. Euclidean and rectilinear norms .................................................................................................... 42 3-5. Facility layout problem representation tree .................................................................................. 46 3-6. Example of a laboratory area ......................................................................................................... 47 3-7. Illustration of facility placement via the proposed algorithm ........................................................ 51 3-8. Illustration of generating more solutions through considering more potential points in the neighbourhood. ..................................................................................................................................... 52 3-9. An illustrative example for the tree of possibilities in the placement procedure ........................... 53 3-10. Laboratory area ............................................................................................................................ 54 3-11. Laboratory layout design considering entrance 𝐸1 ..................................................................... 56 3-12. Laboratory layout design considering entrance 𝐸2 ..................................................................... 56 3-13. Final clinical laboratory layout design ........................................................................................ 57 4-1. Analyzer configuration problem (ACP) in clinical laboratory ...................................................... 60 5-1. A weighted bipartite network for a matching problem with |𝑁1 | = |𝑁2 | = 5 .............................. 81 5-2. A feasible solution for the example ............................................................................................... 81 5-3. Optimal balanced assignment of the illustrative example ............................................................. 84 5-4. Impact of aliquoting on the number of tubes in a clinical laboratory ............................................ 94 5-5. All possible aliquoting options for the illustrative example .......................................................... 95 5-6. Global scheme of the first proposed approach for the aliquoting problem. .................................. 97 5-7. Effect of aliquoting on the assignment output matrices ................................................................ 97 5-8. Global picture of the second proposed framework for the aliquoting problem. ........................... 98 5-9. Gantt chart of two jobs on two machines. ..................................................................................... 99. © 2018 Tous droits réservés.. lilliad.univ-lille.fr.
(12) Thèse de Sohrab Faramarzi Oghani, Université de Lille, 2018. 5-10. Standards used to address a scheduling problem in the literature ............................................. 100 6-1. Types of simulation models ......................................................................................................... 109 6-2. Framework for a successful simulation study ............................................................................ 110 6-3. Comparison of simulation software tools ................................................................................... 112 6-4. Automate components ................................................................................................................. 116 6-5. General standalone clinical laboratory workflow ........................................................................ 117 6-6. Registration desk (a) and Rack-making desk for centrifuges (b). ............................................... 118 6-7. Components of AU480 analyzer modeled in FlexSim ................................................................ 120 6-8. Components of AU5822 analyzer modeled in FlexSim .............................................................. 121 6-9. Components of DxI600 analyzer modeled in FlexSim................................................................ 122 6-10. Types of flow items used in clinical laboratory simulation modeling ....................................... 124 6-11. Schematic view of general steps to create clinical laboratory simulation model in FlexSim... . 128 6-12. Simulation model of the designed clinical laboratory in FlexSim............................................. 129 6-13. Snapshots of different sections and operations of the running simulation model in FlexSim ... 130 6-14. TAT of all tubes in the clinical laboratory................................................................................. 133 6-15. Utilization of analyzers in the laboratory .................................................................................. 135 6-16. Utilization of operators in the laboratory................................................................................... 135 6-17. Waiting times at several queues of the laboratory ..................................................................... 136 6-18. Dynamic tube arrival to the laboratory ...................................................................................... 137. © 2018 Tous droits réservés.. lilliad.univ-lille.fr.
(13) Thèse de Sohrab Faramarzi Oghani, Université de Lille, 2018. Chapter 1. Introduction to Clinical Laboratory Optimization. © 2018 Tous droits réservés.. lilliad.univ-lille.fr.
(14) Thèse de Sohrab Faramarzi Oghani, Université de Lille, 2018. Chapter 1: Introduction to clinical laboratory optimization. 2. 1.1. Introduction to clinical laboratory optimization project 1.1.1. Motivation and significance A clinical analysis laboratory is an organization gathering human and machinery resources to analyze human fluid samples such as blood and urine. These laboratories are noticed as one of the principal and preliminary blocks in health services where most of the medical diagnoses and treatments depend on. Therefore, efficiency and effectiveness of these organizations have straight impact on the performance of other dependent health sectors. Furthermore, reducing operating costs in laboratories decreases the cost of treatment and eventually increases patient satisfaction. Surveying the current situation of clinical laboratories implies the trend of fusion among these organizations which on one side, decreases the number of clinical laboratories and on the other side, enlarges the magnitude of the emerging laboratories and imposes more tasks to these organizations. This pervasive phenomenon which is mainly the consequence of financial pressures done by reimbursement organizations addresses the clinical laboratories as huge organizations which require profound and precise scientific efforts while designing and planning such complex systems. Although, a wide number of studies has been carried out to improve and optimize healthcare systems [see (Onar et al., 2018) and (Brailsford and Vissers, 2011)], optimization of clinical laboratories still can be spotted as a virgin domain of research where only a few dispersed studies are observed in the literature of operations research. In addition, a lack of customized and intelligent decision support tool is fully appreciated to aid clinical laboratories (CLs) designers and managers facing strategic, tactical and operational decision problems. Concluding the above discussion, a need for a smart decision tool is fully appreciated to facilitate the design process of clinical laboratories. Hence, clinical laboratory optimization research project has been launched with the aim to firstly address the principal strategic, tactical and operational problems of clinical laboratories design and planning and secondly, to provide a customized decision support tool to efficiently deal with the identified decision problems.. 1.1.2. Project foundation and research collaboration The clinical laboratory optimization (CLO) research project has been carried out in the BONUS (previously DOLPHIN) research team of Inria Lille-Nord Europe under supervision of Prof. El-Ghazali Talbi. Originally, the CLO project has been founded by Normand-Info company, a Beckman Coulter subsidiary, to improve CLs performance. Generally, Normand-Info provides information technology (IT) solutions for CLs and Beckman Coulter is a huge international company, mainly manufacturing human biology analyzers and equipment.. © 2018 Tous droits réservés.. lilliad.univ-lille.fr.
(15) Thèse de Sohrab Faramarzi Oghani, Université de Lille, 2018. Chapter 1: Introduction to clinical laboratory optimization. 3. 1.2. Introduction to clinical laboratory organization 1.2.1. Terminology In this section, definitions of frequently used terms and phrases in this thesis are briefly expressed. . Laboratory information system (LIS) is used by the laboratory staff to fill in the prescriptions and the information on the sample. LIS transmits orders to the data manager and receives results from it. LIS creates the result forms and transmits them to the ordering physicians and to the patients.. . Data manager (DM) is a software that consolidates patient test information from multiple instruments in the laboratory. It enhances the LIS, empowering laboratory personnel to access and manage information from a single workstation. Also, DM offers customized rules where the laboratory personnel expertise could be compiled in order to automate the laboratory workflow. Applying automated rules reduce significantly user actions and decision on each sample or result.. . Analysis (Test) is a set of process steps to establish the value or the characteristics of one property. Triglyceride is an example for test.. . STAT is the name given to a test with urgent request. It comes from a Latin word ‘statim’, which means instantly or immediately.. . Complementary analysis (Reflex) is an analysis added to the original prescribed order. They are generally requested when initial analysis results indicate a suspicion of pathology. The complementary analysis allows confirming or refuting the suspected pathology.. . Rerun implies to the test repetition. When for any reason, the quality of a result is under question, the same analysis is performed again. It is generally performed on the same instrument, but according to the suspicion, another instrument could be chosen to perform the rerun.. . Discipline refers to a set of tests. Immunology, Chemistry, Hematology and Coagulation are some examples for discipline.. . Prescription (Order) is a list of analysis prescribed by a physician.. . Sample (Specimen) is a portion of fluid drawn from the patient (blood sample, urine sample, etc.) and placed in a tube. A tube could contain adjuvants to allow a better conservation of the sample. The type of tube (according to the adjuvants) is generally materialized by the cap color.. . Sample delivery involves packaging and transportation of samples from the drawing sites to the analysis sites. Sample delivery is also used for transportation in-between analysis sites, or when specific analysis is performed by a sub-contractor laboratory.. . Tube is a container for specimen of a patient. The terms ‘tube’ and ‘sample’ are used interchangeably in this thesis.. © 2018 Tous droits réservés.. lilliad.univ-lille.fr.
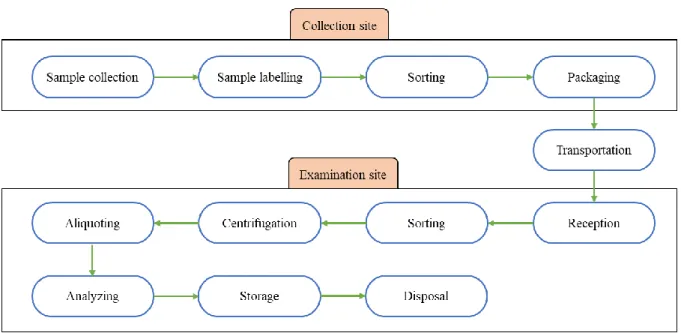
(16) Thèse de Sohrab Faramarzi Oghani, Université de Lille, 2018. Chapter 1: Introduction to clinical laboratory optimization . 4. Rack is a net-like container in which tubes are placed. Generally, racks are used by staff for tube sorting and transportation, and by some machines for processing. Various types of rack exist in a laboratory for different applications.. . Analyzer refers to the machines utilized to perform the tests on samples.. . Registration is the act of recording prescription and sample information into the LIS. It is also where sample conformity to the requested tests is checked.. . Centrifugation is the act of separating blood into its components done by a centrifuge machine.. . Aliquoting is the act of making more tubes out of one. Aliquot is a part of the sample drawn from a primary tube and placed in a secondary tube.. . Reagent is a chemical substance used by the analyzers to perform tests.. 1.2.2. Clinical laboratory structure In general, a classic clinical laboratory is made of two sites: collection site and examination site. Collection site also known as drawing site, is a sector of a laboratory which receives patients. Nurses of the laboratory draw samples from the patients. The nature of the samples, the volumes, and the tube types used to collect the samples are defined according to the ordered tests. Each drawn sample is then labelled to be identified later for the next operations. Finally, tubes are packed and delivered to the examination sites. Examination site also known as analysis site, is an area of the laboratory where instruments are used to prepare and perform tests on samples. An examination site might serve one or more remote collection sites. In better words, an examination site may receive tubes from several collection sites. Nowadays, due to some cost-related reasons, examination sites are growing and getting bigger to serve more collection sites. This trend is making an examination site as a huge organization where many crucial tasks must be done properly and many decisions must be made efficiently. Figure 1-1 illustrates the emerging network of clinical laboratories where a few examination sites give services to many collection sites. In this thesis, the main focus is on the examination site. Hereafter, the term ‘laboratory’ refers to the examination site. According to the type of material handling system used in a laboratory, three types of clinical laboratory can be identified: . Clinical laboratory with standalone sorter where tubes are transported within the racks by laboratory staff. In this type of laboratories, no automated system is used to convey the rack of tubes.. . Automated clinical laboratory where an automation line is used to convey the tubes between different points in the laboratory.. . Hybrid clinical laboratory where only some points of the laboratory is connected through automation line and the remaining tube transportations are carried out by personnel.. © 2018 Tous droits réservés.. lilliad.univ-lille.fr.
(17) Thèse de Sohrab Faramarzi Oghani, Université de Lille, 2018. Chapter 1: Introduction to clinical laboratory optimization. 5. Figure 1-1. Clinical laboratory network.. 1.2.3. Patient sample workflow: from sample collection to tests result preparation In this section, patient sample workflow is described from collection sites where samples are created till tests analysis and result validation and preparation in examination site. 1. Sample drawing: Part of the samples is drawn by laboratory personnel: nurses or lab technicians in the collection site of the laboratory. Another part is drawn by doctors or nurses at their office or at patient’s home. At last, a part is draw by medical staff in hospitals. All the drawn samples arrive at laboratory collection sites or at the examination site. According to the prescription, several samples. © 2018 Tous droits réservés.. lilliad.univ-lille.fr.
(18) Thèse de Sohrab Faramarzi Oghani, Université de Lille, 2018. Chapter 1: Introduction to clinical laboratory optimization. 6. could be drawn from a patient and placed in different tubes. The tube type depends on the tests to be done. Each tube is identified by a unique identifier on a barcode label. This unique identifier allows the electronic association with the patient order (prescription) in the LIS, and further in the DM or the laboratory device. The quantity of the drawn sample could be adapted according to the organization of the laboratory workflow. Some laboratories are drawing more samples per patient to avoid having to create aliquot later and to have a unique destination instrument per tube. 2. Packaging (sample delivery): Samples are grouped in racks. Racks are placed in carrier cases. Carrier cases could be refrigerated when required. Both racks and carrier cases generally have a unique barcode label. 3. Transportation to the examination site: Carrier cases are conveyed by courier to the examination sites. The job of the courier is generally organized in the form of tours. 4. Receipt of the samples (identification, quality, volume, and associated prescription are controlled): When arrived, samples are checked. The tube types, their volumes and aspects are reviewed to ensure the needed quality of the sample for the prescribed tests. When reviewed, part or all of a prescription could be rejected if the quality of the samples is not good enough to perform the tests. If the quality of the sample is not optimal, but could allow some analysis, non-conformity comments will be indicated in the electronic records of the order and will be indicated on the final report (sent to the physician). At the end of the receipt phase the samples are sorted and placed on racks according to their workflow and associated pre-analytical steps. 5. Rack building according to the pre-analytical steps: Racks are generally specific to each manufacturer or to a family of instruments of one manufacturer. A sample will be moved from a rack to another according to the devices on their workflow path. 6. Carrying samples to the pre-analytical devices: Several pre-analytical steps could be needed to get the sample preparation completed. The sample is generally moved to different pre-analytical devices to perform these steps. 7. Sample preparation for the requested tests: a) Aliquoter: For some analysis the primary tube cannot be used directly. For example, a dilution could be requested. Aliquoting is also used to avoid cross contamination between tests. Furthermore, aliquoting is used to simplify and optimize the workflow of samples. If one sample must be run on two instruments, creating an aliquot allows to perform in parallel the analysis, one is done on the aliquot while the other is done on the primary tube. In addition, aliquots are created to be sent to other specialized laboratories for some specific tests.. © 2018 Tous droits réservés.. lilliad.univ-lille.fr.
(19) Thèse de Sohrab Faramarzi Oghani, Université de Lille, 2018. Chapter 1: Introduction to clinical laboratory optimization. 7. b) Centrifuge: Some tests are performed on blood plasma (or serum). Plasma is obtained by centrifugation of the blood sample. Centrifugation separates the blood cells from the plasma. Serum is obtained by blood coagulation. c) Sorter: According to the prescribed analysis, samples are placed on racks dedicated to the analyzers chosen to perform the tests. d) Decapper (optional): Some instruments cannot draw a sample through the tube cap. In such case, the tube cap is removed by one of the de-cappers before being placed on the analyzer. 8. Moving samples to the analyzers: Once the samples prepared, racks are moved to the instruments and placed in their input regions. Some instruments have a sequential access to the sample (a queue of racks is built). In this case, the samples are analyzed one by one according to the order in which they are loaded into the instrument. Other instruments could access samples in any order and could prioritize the tubes according to their emergency. In this case, STAT samples could be analyzed first. Actually, the instrument may have a specific input region for STAT tubes. 9. Analysis on the instrument: Once drawn by the instrument, the samples are placed in an output region. Some instruments have a waiting zone allowing the sample to be drawn again to perform a rerun test before unloading the sample. The rerun test is generally requested by the data manager or by the LIS if the result is suspicious or the first result is out of the range of the analyzer. 10. Moving the sample to other instruments: To complete the order, a sample might be moved from one instrument to another. The remaining analyses are done following the same schema, from step 8 to 9. 11. Recapping (Optional): To avoid pouring the samples, tubes might be recapped. 12. Transportation of the samples to the storage: Samples with all tests done are transported to the storage. 13. Storage of the sample in fridges (archiving): Once all analysis done, samples are stored in a fridge, usually for a few days. This allows requesting eventual rerun or reflex. There are two kinds of storage: a) Short period storage: Samples are stored for one to seven days in fridges. The organization of the fridge should allow retrieving any sample rapidly. The location of the sample in the fridge is generally materialized by a fridge ID, a shelf ID, a rack ID and a position in the rack. b) Long period storage (serum banks): Some samples must be stored for a longer amount of time according to the applicable regulation rules. Serum bank is a storage location of serums in the laboratory. Stability of a sample is maintained by freezing. 14. Complementary analysis (Reflex): According to the test result, one or more complementary tests might be requested by the physician or by the laboratory biologist. To handle Reflex tests, steps 8 to 14 must be followed again.. © 2018 Tous droits réservés.. lilliad.univ-lille.fr.
(20) Thèse de Sohrab Faramarzi Oghani, Université de Lille, 2018. Chapter 1: Introduction to clinical laboratory optimization. 8. Figure 1-2 schematically depicts patient sample flow throughout the laboratory organization.. Figure 1-2. Schematic of patient sample flow.. Focusing only on examination site operations, the process can be classified into three steps: Preanalytical, analytical and post-analytical. Pre-analytical step includes tube registration, centrifugation, sorting and aliquoting. Analytical step indicates to the phase when tubes are analyzed by analyzers. Post-analytical step refers to tube storage and result validation and preparation. It is noteworthy that tube transportation is also a key operation in the laboratory which interconnects different steps of the process. Figure 1-3 illustrates the principal steps of operations in the examination site. Alongside the patient sample flow, information flow plays an important role in a clinical laboratory. As a part of the information exchange, analyzers transmit test results to the validation consoles where results are checked and validated by specialists. Generally, a portion of the results are validated automatically through the customized rules defined in DM and the remaining must be validated by specialists. Validated results are then prepared to be sent to the physicians and the patients.. Figure 1-3. Main steps of operations in examination site.. © 2018 Tous droits réservés.. lilliad.univ-lille.fr.
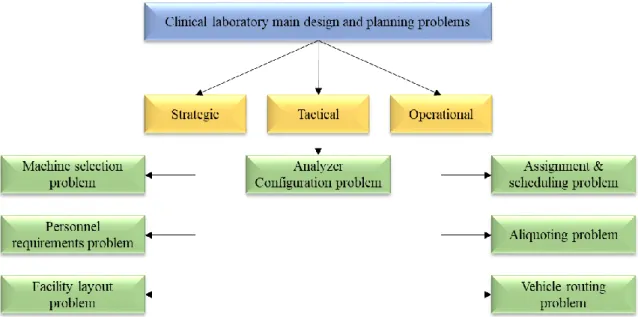
(21) Thèse de Sohrab Faramarzi Oghani, Université de Lille, 2018. Chapter 1: Introduction to clinical laboratory optimization. 9. 1.3. Introduction to clinical laboratory main decision problems Designing a modern clinical laboratory as a complex system is a difficult challenge. Generally, designing a complex system to achieve a number of strategic objectives involves making a series of complicated decisions over time (Hayes and Wheelwright, 1979). Making these decisions in a way that supports the system’s high-level goals requires full and detailed understanding of design issues interactions as well as their impact on the system’s ultimate goals. In systems engineering literature, numerous approaches have been addressed to manage the manufacturing system design. Axiomatic design (AD) methodology has been introduced as a systematic, scientific approach to deal with complex system design (Suh, 1990). This approach focuses on the generation of system requirements and selection of means for achievement (Cochran et al., 2002). In AD, objectives are stated as functional requirements (FRs) and solutions as design parameters (DPs). Briefly, the AD starts from the high-level FRs and decompose them into the lower-level FRs and in order to fulfil each of them, a DP is proposed. Concepts of the AD is helpful to understand the main objectives of the design and consequently, decompose the complex design problem into sub-problems. With regards to the axiomatic design principles and profound investigation of clinical laboratories requirements, as well as comparing clinical laboratories with service and manufacturing systems, the following problems are listed as the main decision issues for design and planning of a clinical laboratory. Machine selection problem - In order to equip a laboratory, type and quantity of required equipment have to be determined. Machine selection problem deals with the specification of the type and number of required analyzers and non-analytical machines inside the laboratory to satisfy the demand with the aim of optimizing one or more objectives under certain constraints. Personnel requirements problem - Along with the laboratory equipment selection problem, employee requirements is essential to be addressed. Determining the number of full-time employees and in the next step, tasks assignment are crucial problems for clinical laboratories. Facility layout problem - Specification of the location of each instrument in the laboratory is a key design problem. The facility layout problem is defined as the placement of facilities in a laboratory with the aim of determining the most effective arrangement according to one or more objectives under specific constraints. Analyzer configuration problem - In clinical laboratories, analyzers require reagent to be able to perform a test. Analyzer configuration problem deals with the specification of the type and quantity of reagent bottles placed into each analyzer with the aim of optimizing one or more objectives under certain constraints.. © 2018 Tous droits réservés.. lilliad.univ-lille.fr.
(22) Thèse de Sohrab Faramarzi Oghani, Université de Lille, 2018. Chapter 1: Introduction to clinical laboratory optimization. 10. Assignment and scheduling problem - Normally, there are more than one eligible analyzer to analyze a test of a sample. Efficient assignment of tubes and tests of tubes to the analyzers in a clinical laboratory is known as the assignment problem. Scheduling problem deals with determining the sequence of tubes on different operational processes. Aliquoting problem - In clinical laboratories, there is an option to make more tubes out of one which is called aliquoting. In one hand, beside the costs of aliquoting, it generates more tubes in the laboratory which complicates tube handling; one the other hand, it provides the opportunity to simplify the sample workflow throughout the laboratory by dispatching the primary and its aliquoted tubes to different destinations for analysis simultaneously instead of sending a tube to different destinations sequentially. To characterize and resolve the aliquoting problem following questions must be answered: Which tubes must be aliquoted? How many aliquots must be created from each aliquoting candidate? How tests must be assigned to the aliquoted tubes? Vehicle routing problem - Patient samples are taken in the collection sites and then, delivered to the examination site by special vehicles. Optimal routing and timing of these vehicles is known as the vehicle routing problem (VRP). This problem has been broadly investigated in the literature even for clinical laboratories. Yücel et al. (2013) introduced the problem of specimen collection for a clinical laboratory from a dispersed number of sites, as a collection for processing problem (CFPP) with the aim of maximizing the total number of samples processed during the day as well as minimizing the daily transportation costs. Figure 1-4 summarizes the principal optimization problems of clinical laboratory design and planning and their associated decision making level.. Figure 1-4. Clinical laboratory main design and planning decision problems.. © 2018 Tous droits réservés.. lilliad.univ-lille.fr.
(23) Thèse de Sohrab Faramarzi Oghani, Université de Lille, 2018. Chapter 1: Introduction to clinical laboratory optimization. 11. Alongside the aforementioned problems, determining an efficient maintenance policy for machines and a suitable sample drawing policy in collections sites can be considered as other important clinical laboratory optimization problems.. 1.4. Application of operations research in clinical laboratory optimization: a survey Most of the research efforts concerning the application of operations research (OR) methods in improvement and optimization of clinical laboratories have been started since the advent of ‘The OpenLabs’ project (O’Moore et al., 1994). This project is concerned with the use of advanced information science and telematics for the optimization of clinical laboratory services (O’Moore et al., 1996). As part of this project, Merode et al. (1996) developed a simulation module for laboratory capacity planning. Introducing computerised validation systems within the clinical laboratories to automatically validate patient results is also one of the remarkable advances related to The OpenLabs program (Boran et al., 1996). To optimize the structure of a clinical laboratory, Merode et al. (1998) proposed a mathematical programming model to cluster workstations to minimize the maximum idle time of staff while assigning them to the clusters. Elena et al. (2006) introduced a mathematical model to help improving the laboratory organization in relation with staff assignment and specification of samples analyzing method decisions. To efficiently schedule the personnel in laboratories, Franses and Post (2003) developed an algorithm to find an acceptable matching between the workers and tasks in different periods. Concerning the planning and scheduling of patient tests in laboratories, Marinagi et al. (2000) proposed a scheduling system for hospital laboratories to support the continual and dynamic nature of the problem. Simulation modeling is the most-used tool to analyze, evaluate and improve the planning and design of clinical laboratories over the past years. Computer simulation as a powerful and versatile tool is suitable for full understanding of a complex system, bottleneck identification, change management, scenario analysis and projection. To make a wise decision on automating the central processing laboratory in Mayo clinic, Dankbar et al. (1992) developed several simulation models to evaluate the effect of different vendor proposals on system performance. Berchtold et al. (1994) endeavoured to develop a generalized flexible simulation model to assess arbitrary changes in the structure and configuration of the clinical laboratories. They expressed average turnaround time, resource utilization and average queue length as three significant performance measures in clinical laboratories studies. Lote et al. (2009) emphasized on the use of discrete-event simulation with other industrial engineering techniques to improve medical testing laboratories. As a part of the paper, optimizing courier routes and evaluating the impact of such improvement on operational performance of the laboratory as well as levelling utilization of resources to achieve optimal resource allocation were studied on a medical laboratory located in the eastern part of the United States. Luangmul et al. (2012) developed a simulation model of a hospital’s clinical laboratory in Thailand focusing only on the complete blood cell (CBC) test. © 2018 Tous droits réservés.. lilliad.univ-lille.fr.
(24) Thèse de Sohrab Faramarzi Oghani, Université de Lille, 2018. Chapter 1: Introduction to clinical laboratory optimization. 12. through using ARENA simulation software. The aim of the study was to verify the impact of potential changes like physical layout alternation by a verified and validated simulation model. Biochemistry and hormone test laboratories of a university hospital in Turkey were studied via simulation modeling by Kadi et al. (2016). The aims of the study were firstly, to achieve a full understanding of the current system and identify possible existing bottlenecks and secondly, to conduct scenario analysis in order to improve the current state of the system. Improvement scenarios were made based on process analysis solutions and resource alternation decisions. ARENA simulation software was used to develop the simulation model and to capture the average time in system of a patient as the main performance measure of this study. For more studies on the application of simulation modeling for clinical laboratories improvement and optimization see [(Vogt et al., 1994), (Groothuis et al., 2002) and (Bodtker et al., 1993)]. Investigating the literature of clinical laboratory optimization reveals the lack of coherence among the research activities in this field. There are a few studies demonstrating the application of operations research, mainly mathematical programming in medical laboratory decision making problems. In addition, simulation studies have been conducted on a specific problem for a given case. Since clinical laboratories are being merged, the advent of giant laboratories is inevitable in near future. Therefore, new generation clinical laboratories require productive decisions concerning the planning and design processes to efficiently create and manage such a complex system on one hand, and reduce the costs, on the other hand.. 1.5. Proposed framework for clinical laboratory optimization As discussed in section 1.3, due to the complexity of clinical laboratory design and planning activity, this problem is decomposed into several decision problems. According to some reasons such as problem necessity and applicability in current status of clinical laboratories, and also data availability, machine selection, facility layout, analyzer configuration and assignment are identified as optimization problems in this study, implying that a systematic approach is applied to characterize each of these problems and to search the solution space in order to find optimum or near-optimal solutions. Figure 1-5 presents the procedure applied to deal with each identified optimization problem. Solutions of these selected problems only create a part of a clinical laboratory. For the remaining part, other decision problems must be tackled. A knowledge-based policy is initially used to answer these problems. For instance, the number of full-time employees can be determined based on the opinion of a group of experts. Although a simple calculation might support the selected policies for the remaining decision problems, there is no guarantee for the efficiency of these policies.. © 2018 Tous droits réservés.. lilliad.univ-lille.fr.
(25) Thèse de Sohrab Faramarzi Oghani, Université de Lille, 2018. Chapter 1: Introduction to clinical laboratory optimization. 13. Figure 1-5. Procedure applied to tackle optimization problems.. To organize the structure of the clinical laboratory optimization problem, a systematic, top-down, stepwise methodology is proposed (Figure 1-6). In this methodology, optimization problems are sequentially tackled from the strategic to the operational level respecting the interactions between the problems. In better words, machine selection is firstly tackled then, facility layout, after that analyzer configuration and finally, assignment. The main step of this framework is to use a fine-grained, flexible and at the same time reliable simulation model which not only includes all the resulting solutions from solving the defined optimization problems but also, all the laboratory policies and decisions made by experts neglected in the previous steps of the framework to approximately imitate the behaviour of the designed system and also to evaluate critical performance measures. Hence, the number of full-time employees and their duties as well as sample drawing, aliquoting and scheduling policies are decided by the experts through either rough computation or simple policy selection. A simulation model as a virtual description of a real system plays a decisive role in the proposed framework which provides the opportunity to evaluate and check the satisfaction of key performance indicators (KPIs) and if needed, assess various scenarios made of former solutions modification. Therefore, a modification loop can be assumed whether to each optimization or decision problem to modify some parameters of the system which may improve the system performance and create more satisfaction form the designer point of view. A simulation model is able to provide a clear insight to the designed system through presenting the system bottlenecks and its components statistics which all help the decision maker recognizing target problems for making loops and performing better changes to either the problem solution or description. Furthermore, to scrutinize a decision problem in this framework, it can be defined as an optimization problem. The bi-directional arrow between optimization and decision problems in Figure 1-6 shows this possible movement.. © 2018 Tous droits réservés.. lilliad.univ-lille.fr.
(26) Thèse de Sohrab Faramarzi Oghani, Université de Lille, 2018. Chapter 1: Introduction to clinical laboratory optimization. 14. Figure 1-6. Proposed framework for efficient CL design.. 1.6. Sources of information and case study In this thesis, five main sources of information were used for different aspects of the project. In the first phase, regular weekly meetings with an expert provided useful information to understand the clinical laboratory organization, its features and characteristics. In addition, laboratory visits had a key effect on better system comprehension. These two sources, namely expert knowledge and laboratory visits, as well as literature of the complex system design played the most important roles in problem identification and consequently, problem description. In order to understand the behaviour of clinical laboratory components, mainly machines, a customized simulation tool called ‘LabSim’ which belongs to Beckman Coulter Company had the bold role; however, experts’ explanations, laboratory visits and a machines manufacturer website helped a lot for better receipt. Necessary data for both mathematical and simulation modeling were mainly extracted from a real laboratory database, ‘LabSim’ simulation tool and machines manufacturer website. Additionally, some missing data were provided by the experts. Table 1-1 presents the main sources of information used to obtain the necessary information and data in different steps of the project.. © 2018 Tous droits réservés.. lilliad.univ-lille.fr.
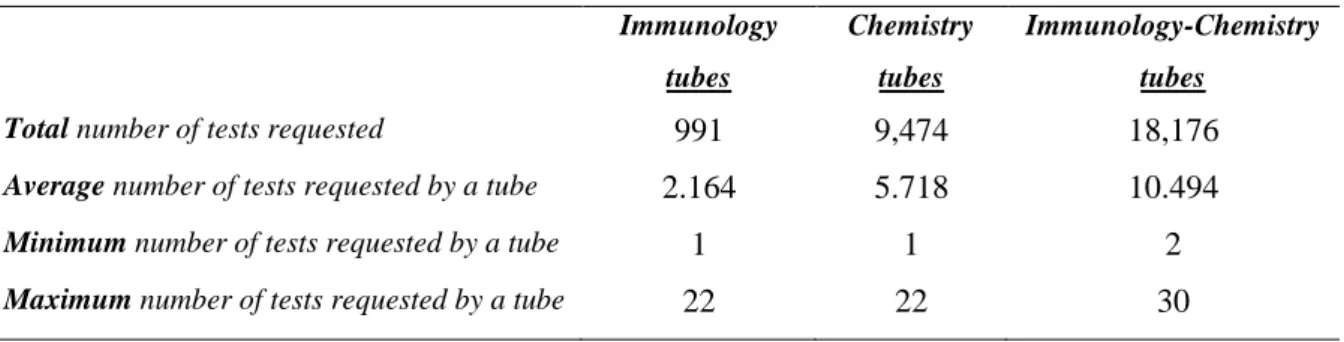
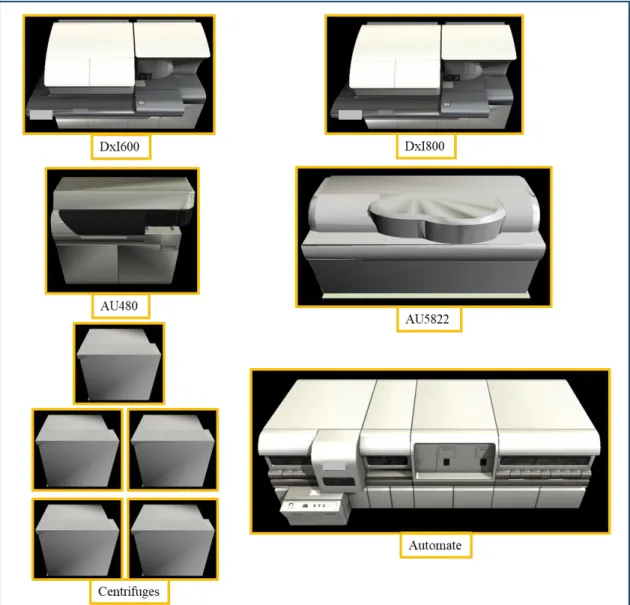
(27) Thèse de Sohrab Faramarzi Oghani, Université de Lille, 2018. Chapter 1: Introduction to clinical laboratory optimization. 15. Table 1-1. Main sources of information used for data extraction in each step of the project. Project main activities CL understanding. CL components understanding. Problem identification & description. Modeling and validation. Expert knowledge. ×. ×. ×. ×. Laboratory visit. ×. ×. ×. Sources of information. ‘LabSim’ simulation tool. ×. ×. Machine manufacturer website. ×. × ×. Laboratory database. It is worth noting that due to the confidentiality aspects, data has been unnamed and in some cases encrypted. In the next section, the case study used to validate the proposed framework is briefly described.. 1.6.1. Case study In this thesis, Database of a real-world clinical laboratory is used to extract real data for validating the proposed framework. This clinical laboratory mainly focuses on Immunology and Chemistry tests. This laboratory covers thirty-two different Immunology tests and forty different Chemistry tests. Therefore, the total number of test types treated by this laboratory is seventy-three tests. For a normal day, the total number of arriving tubes is 3,847 on average. This total is made of 458 Immunology tubes, 1,657 Chemistry tubes and 1,732 Immunology-Chemistry tubes in average. Furthermore, the total number of requested tests of the arriving tubes is 28,632 which is made of 4,591 Immunology tests and 24,041 Chemistry tests averagely. The daily average number of requested tests for each test type is given. Additionally, the requested tests of each tube are known which are demonstrated by Tube-Test matrix. Table 1-2 presents the statistical status of the tests requested by each class of tubes. In each chapter, the proposed models are validated through using these data. Other necessary data associated to each specific problem is described in the respective chapter. Table 1-2. Statistical status of the tests requested by each class of tubes in the case study. Immunology. Chemistry. Immunology-Chemistry. tubes. tubes. tubes. 991. 9,474. 18,176. 2.164. 5.718. 10.494. Minimum number of tests requested by a tube. 1. 1. 2. Maximum number of tests requested by a tube. 22. 22. 30. Total number of tests requested Average number of tests requested by a tube. © 2018 Tous droits réservés.. lilliad.univ-lille.fr.
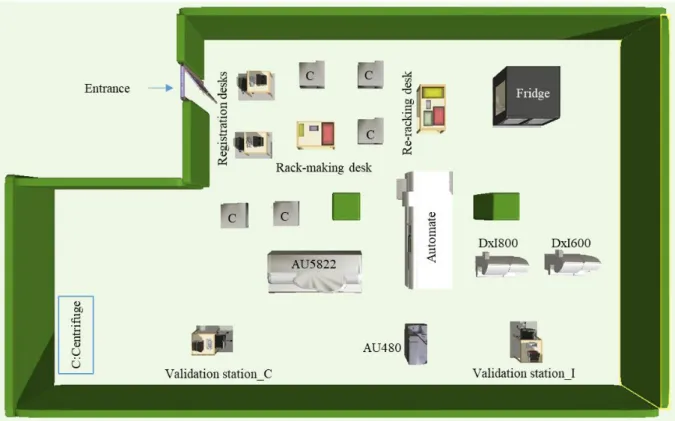
(28) Thèse de Sohrab Faramarzi Oghani, Université de Lille, 2018. Chapter 1: Introduction to clinical laboratory optimization. 16. 1.7. Data management In this thesis, many data are involved. As previously discussed in section 1.6, required data have been collected from different sources of information including a real laboratory database, website of a machine manufacturer, ‘LabSim’ simulation tool and experts’ knowledge. All these data create our database and are used as the input for the proposed optimization approaches. One the other hand, solving each proposed model provides new information that might be used as input data for other optimization problems. For instance, solving the machine selection problem leads to a set of selected machines which are used as a part of the input for the analyzer configuration problem. To simplify the management of all these data in the optimization process of clinical laboratory design and planning, an Excel-based tool has been developed. Generally, this tool is able to prepare all the required input data for each defined problem and also for the simulation model from the created database. Each time a model is solved, the output results are added to the database either keeping the same format or transforming to the proper format as they can be used afterwards by the other models. Figure 1-7 shows the control panel of the developed Excel-based tool for data management in which each colored block presents a button. After filling all the required sheets by the user which are mainly related to laboratory demand data, the developed tool automatically prepares all data required to solve the machine selection problem by pressing the ‘Generate dataset MSP’ button. To solve the machine selection problem, the only thing to do is to press the ‘Run model MSP’ button which launches GAMS software. Finally, pressing ‘MSP result retrieval’ button retrieves the output results of the machine selection problem in the required format to be used as the input of other problems. This instruction can be generalized to the other buttons embedded in this tool to manage other optimization problems and finally, prepare the input of the simulation model.. Figure 1-7. Control panel of the developed Excel-based tool for data management.. © 2018 Tous droits réservés.. lilliad.univ-lille.fr.
(29) Thèse de Sohrab Faramarzi Oghani, Université de Lille, 2018. Chapter 1: Introduction to clinical laboratory optimization. 17. 1.8. Thesis main contributions The main contributions of this research work are listed as follows: - A comprehensive study is carried out to explore the clinical laboratory organization, its characteristics, and more importantly, the most significant decision problems. - A general stepwise framework is proposed to systematically deal with the optimization of clinical laboratory design and operating decisions. The proposed framework is validated using data from a realworld case study. - The machine selection problem is specifically defined for clinical laboratory. Additionally, a novel mathematical model is developed to tackle this problem. The objective of the proposed model is to minimize the daily machine-related operating costs in the laboratory. - The facility layout problem is specifically defined for standalone clinical laboratory considering physical, technical and organizational constraints. To cope with this problem, a heuristic approach is developed which is able to propose diverse efficient solutions to decision makers. - To the best of our knowledge, the analyzer configuration problem for clinical laboratories is described for the first time in this thesis. Two new mathematical models are proposed to deal with this problem. The first proposed model has been inspired from the machine selection model and only focuses on costrelated objectives while the second proposed model is a bi-objective model which has a look to the operational issues inside the laboratory and tries to minimize tubes movements as well as analyzers configuration costs. - A mathematical model with three objectives is developed to face the assignment problem in a clinical laboratory. In this model, the first two objectives balance the load among the analyzers in terms of number of tubes and tests assigned to each analyzer and the third objective minimizes the tubes’ movements within the laboratory. - To the best of our knowledge, aliquoting problem for clinical laboratory is described for the first time in this thesis. Two general approaches are proposed to deal with this problem. - A customized, flexible and fine-grained simulation model is developed in this thesis in which nearly all the main clinical machines of a specific manufacturer have been modeled in details. - The use of simulation modeling to evaluate clinical laboratory performance measures and also, for system understanding and bottleneck identification is performed in this thesis.. 1.9. Thesis structure The rest of this thesis is organized as follows:. © 2018 Tous droits réservés.. lilliad.univ-lille.fr.
Figure
+7

Documents relatifs