DOI 10.1007/s00442-009-1426-6
C O M M U N I T Y E C O L O G Y - O R I G I N A L P A P E R
Large-scale synchrony of gap dynamics and the distribution
of understory tree species in maple–beech forests
Dominique Gravel · Marilou Beaudet · Christian Messier
Received: 13 November 2008 / Accepted: 17 July 2009 / Published online: 8 August 2009 © Springer-Verlag 2009
Abstract Large-scale synchronous variations in commu-nity dynamics are well documented for a vast array of organisms, but are considerably less understood for forest trees. Because of temporal variations in canopy gap dynam-ics, forest communities—even old-growth ones—are never at equilibrium at the stand scale. This paucity of equilib-rium may also be true at the regional scale. Our objectives were to determine (1) if nonequilibrium dynamics caused by temporal variations in the formation of canopy gaps are regionally synchronized, and (2) if spatiotemporal varia-tions in canopy gap formation aVect the relative abundance of tree species in the understory. We examined these ques-tions by analyzing variaques-tions in the suppression and release history of Acer saccharum Marsh. and Fagus grandifolia Ehrh. from 481 growth series of understory saplings taken from 34 mature stands. We observed that (1) the proportion of stems in release as a function of time exhibited a U-shaped pattern over the last 35 years, with the lowest levels occurring during 1975–1985, and that (2) the response to
this in terms of species composition was that A. saccharum became more abundant at sites that had the highest propor-tion of stems in release during 1975–1985. We concluded that the understory dynamics, typically thought of as a stand-scale process, may be regionally synchronized. Keywords Canopy gaps · Synchrony ·
Northern hardwoods · Sapling dynamics · Growth release
Introduction
Large-scale synchronous variations in the dynamics of for-est tree species are neither common nor well documented (Koenig and Knops 1998; Clark and McLachlan 2003; Liebhold et al. 2004). Understanding the factors responsi-ble for spatial covariation of species dynamics has impor-tant implications for predicting species distribution, abundance and extinction risk (Lande et al. 2003). Theory and empirical data suggest three diVerent mechanisms are behind spatially synchronized Xuctuations in population densities (Liebhold et al. 2004): (1) dispersal of individuals from a source population; (2) population dependence on an exogenous factor that is spatially synchronized (the Moran eVect), and; (3) trophic interactions with other organisms that are spatially synchronized. Since forest trees are organ-isms with relatively limited dispersal, the most likely mech-anism is the second one, although some forest communities are also aVected by interactions with other organisms such as insects and pathogens.
In many forest understories, light is the major constraint on tree growth and survival, and an important axis for diVerentiating ecophysiology, architecture, and demogra-phy among diVerent tree species. Consequently, there have been extensive eVorts in forests worldwide to document Communicated by Miguel Franco.
Electronic supplementary material The online version of this article (doi:10.1007/s00442-009-1426-6) contains supplementary material, which is available to authorized users.
D. Gravel · M. Beaudet · C. Messier
Département des Sciences Biologiques, Centre d’Étude de la Forêt (CEF), Université du Québec à Montréal, C.P. 8888,
Succ. Centre-Ville, Montréal, QC H3C 3P8, Canada
Present Address: D. Gravel (&)
Département de Biologie, Chimie et Géographie,
Université du Québec à Rimouski, 300 Allée des Ursulines, Rimouski G5L 3A1, Canada
canopy disturbance regimes and the resulting heterogeneity of understory light conditions (e.g., Runkle 1981; Brokaw
1982; Canham et al. 1990; Kneeshaw and Bergeron 1998). Most eVorts have concentrated on the characterization of natural disturbance regimes at a single location (e.g. Lorimer 1980; Glitzenstein et al. 1986) because canopy gap dynamics are thought to be largely based on tree-by-tree replacement processes. The causes of the deaths of individual or groups of trees can, however, have a much wider spatial coverage, suggesting that the synchronization of forest dynamics at a regional scale can also occur, for example, as a result of the strong spatial synchrony of insect outbreaks (e.g., Bjornstad et al. 2002). Less well known, however, is whether the aftermath of such impacts on canopy gap dynamics (Bouchard et al. 2006) is also spatially structured. For instance, extreme climatic events can impact on crown dieback (Payette et al. 1996), in some cases causing tree death (Olano and Palmer 2003). Severe storms are also direct agents of disturbance, breaking branches and trees to form new canopy gaps, as for example in the severe 1998 ice storm in eastern North America (Beaudet et al. 2007b). Such storms leave long-term legacies in terms of the struc-ture and composition of forest landscapes (Woods 2004). Widespread decline episodes are also common (e.g., Drohan et al. 2002) and have been shown to impact on canopy gap dynamics in single stands (Battles and Fahey 2000).
Because of temporal variations in canopy gap dynamics, forest communities are never at equilibrium at the scale of a single stand (Poulson and Platt 1996; Woods 2007), even in old-growth forests (Brisson et al. 1994). This pattern could also be true at the regional scale. In this study, we ask if the Xuctuating dynamics of canopy gap formation are region-ally synchronized by analyzing the suppression and release history of saplings from 34 mature northern hardwood stands in southern Quebec, Canada. More speciWcally, we test the hypothesis that the formation of canopy gaps is a regionally structured, nonstationary process at regional scales. Under nonsynchronized dynamics, release events should average across several sites, as the high proportion of stems in release at some sites balances the low propor-tion of stems in release at other sites. We also tested if a characteristic scale of synchrony exists by examining how synchrony among sites decreases with distance between them. Second, because light availability is a major inXu-ence on the distribution of tree species, we expected the history of suppression and release to aVect the relative abundance of tree species. If this is indeed the case, changes in vegetation composition should also be region-ally synchronized. We tested this hypothesis by analyzing the relative abundance of Acer saccharum Marsh. (ASA) and Fagus grandifolia Ehrh. (FGR) as a function of past suppression and release history. These two shade-tolerant species have been widely studied in attempts to understand
the mechanisms allowing their coexistence (e.g., Woods
1979; Poulson and Platt 1996; Beaudet et al. 1999, 2007a; Gravel et al. 2008), making them good candidates for this analysis. Although our focus was primarily on understory trees, we also performed this analysis on all of the under-story woody species found in our forests.
Materials and methods Study area
In 2003, we sampled 20 stands in the Eastern Townships region and 14 stands in the Portneuf region of southern Quebec (45º30⬘–47º00⬘N; 71º00⬘–72º30⬘W). These regions are, respectively, located in the Acer saccharum—Ameri-can basswood (Tilia amerisaccharum—Ameri-cana L.) and A. saccharum— yellow birch (Betula alleghaniensis Britton) bioclimatic domains (Robitaille and Saucier 1998). Overstories were a mixture of species with ASA as the dominant species, with various proportions of FGR, B. alleghaniensis, Acer rubrum L., Ostrya virgiana (Mill.) Koch, Fraxinus ameri-cana L., Tsuga ameri-canadensis (L.) Carr., Abies balsamea (L.) Mill., and Picea rubens Sarg. For consistency, we only sampled stands that met the following criteria: basal area (BA) >20 m2/ha; presence of trees >30 cm in diameter at breast height (DBH), and; relative BA of FGR (among trees >9 cm in DBH) >5%. Sampling was restricted to stands with no signs of recent disturbance, such as that caused by the 1998 ice storm or logging.
Field sampling
Sampling in the 34 stands was performed at three locations in each stand, 100 m apart along a 200 m transect. The starting locations of the transects and of the Wrst plot were predetermined randomly on the stand map. At each sam-pling location, all stems (DBH > 9 cm, all species) were recorded in a 400 m2 plot (11.28 m radius). Sapling densi-ties (height > 1.3 m–9.0 cm at DBH, all species) were measured in a 100 m2 subplot (5.64 m radius). Along each transect, ten ASA and ten FGR saplings (1.1–9.0 cm at DBH) were randomly selected among the three plots for extracting basal stem disks (»20 cm above the ground). Additional large saplings (DBH 5.1–9.0 cm) were har-vested (in some cases outside the plots, but along the transect) to ensure a minimum sample of Wve individuals per species in the large sapling class. We did not distin-guish between FGR saplings of seed origin and those of root sprout origin because the proportion of sprouts among stems of height 30 cm to 1 m was only 10.5% across our sites. The response to canopy gaps diVers between sprouts and seedlings (Beaudet and Messier 2008; Cleavitt et al.
2008), but this diVerence vanishes once they reach 1 m in
height (Beaudet et al. 1999), and all the trees we measured were larger than that critical size.
Growth measurement
All saplings were measured for annual radial growth. Stem disks were air-dried and sanded. Annual radial growth was measured to a precision of 0.001 mm under 40£ magniWca-tion with an electronic micrometer (Velmex Inc, Bloom-Weld, NY, USA) coupled to a digital meter (Acurite III, Jamestown, NY, USA). Growth measurements were taken along one radius per disk, located 30° from the longest radius. Visual examination of the disks was done prior to measurement along at least two additional radii where annual rings were clearly readable in order to identify par-tial and false rings. The growth increment of parpar-tial rings was set at 0 mm. Partial and missing rings are relatively common for maple and beech (Canham 1990; Lorimer et al. 1999). Lorimer et al. (1999) reported that the mean number of partial or missing rings of a suppressed 40-year-old maple was Wve. The series could not be cross-dated, however, because (1) they were too short, (2) no wood anomalies were apparent that could be used for the skeleton plot method, and (3) understory maple and beech saplings generally undergo multiple episodes of suppression and release (Canham 1990) that mask climatic signals and therefore prevent accurate cross-dating (Lorimer et al.
1999). Because the series were not cross-dated, we could not precisely date the occurrence of any particular event. However, this lack of Wne precision should not impact our results because of the relatively coarse time resolution of our method for detecting release events (a four-year win-dow for gap duration, as in Canham (1990)). Our analysis focuses on the shape of a temporal pattern, not on dating of events. The consequence of imprecise dating is to make the pattern more compact than it is in reality. Assuming that there is no reason to expect the occurrence of missing rings to diVer between regions, this should not aVect the
synchrony of release and suppression events. Moreover, ASA and FGR had similar suppression periods (Table1), suggesting no bias with more missing rings for any one species. We focused on the last 41 years (1963–2003) to ensure a minimal representation of three stems per species/ site (there were, on average, seven growth series per species/site with >41 years of growth). The analysis was performed on a total of 251 ASA and 230 FGR saplings. IdentiWcation of release periods
Because of the potential for growth trends to bias the inter-pretation of sudden growth events that indicate “release,” we developed a novel method to identify release events. This method was based on an iterative assessment of the suppression and release history that best Wtted the data when accounting for a growth trend using a maximum like-lihood algorithm (see Appendix I in the “Electronic
supple-mentary material”). To select the best method of release
identiWcation, we compared the data Wt for the method we developed with four other release identiWcation methods. We used the Akaike information criterion (AIC) to discrim-inate among models for a subsample of series (see details in Appendix I). According to the AIC, our iterative method performed best on the subsampled series and hence was used for the identiWcation of release events in this study. We distinguished between minor and major release epi-sodes, deWned as increases of 100 and 200%, respectively, in radial growth sustained over a minimum of four years (Canham 1990). At each site, we calculated the fraction of stems in release during each year to get a time series for the occurrence of release events. Note that, for any method, the Wrst and last three years of the series must be removed to avoid a biased evaluation of the release status (conse-quently, the series of suppression/release last 35 years).
There are two potential sources of bias in this approach. First, we followed the suppression and release histories of trees that are currently alive and part of the sapling stratum. Such a retrospective approach thus misses the trees that Table 1 Summary descriptors of release events detected in time series of radial growth
Minor and major releases correspond to 100 and 200% increases in growth, respectively, sustained for at least four years. Species are compared by ANOVA with regions included in the analysis as a random factor
Variable Species Minor release Major release
Mean § SE P-value Mean § SE P-value
Number of release events ASA 2.02 § 0.05 0.001 1.90 § 0.06 0.005
FGR 1.76 § 0.05 1.64 § 0.06
Fraction of series in release ASA 0.40 § 0.01 0.013 0.25 § 0.01 0.152
FGR 0.37 § 0.01 0.23 § 0.01
Release duration (years) ASA 9.08 § 0.25 0.593 5.28 § 0.13 0.075
were part of the sapling population 40 years ago that either died or were recruited to the canopy. One empirical study suggests this could potentially bias the evaluation of sup-pression and release history by over-representing release events (Landis and Peart 2005). These two selection mech-anisms could result in a time series for the proportion of stems in release that is not constant over time. To ensure that the pattern we observed was not an artefact of our methodological approach (inherent to such a retrospective study), we simulated the process of mortality and recruit-ment from an initial population of saplings subjected to growth release. More speciWcally, the question we addressed was: in a constant environment, does the elimina-tion of stems by growth and mortality processes create a suppression and release history that is not constant over time? This simulation and its results are described in the supplementary material (Appendix II in the “Electronic
supplementary material”). The simple simulation we
per-formed shows that the proportion of stems in release is con-stant over time despite two strong selection mechanisms (Fig. AII.1), allowing us to infer that the pattern in suppres-sion and release history we observed is robust against these two selection processes. In a constant environment, such a retrospective study is not biased if, at any given moment, each individual has the same probability of being released by a canopy gap. In the absence of records on growth out of the sapling category and mortality, this is a reasonable assumption to make.
A second source of potential bias in retrospective den-drochronological studies stems from the fact that because measured saplings have been increasing in size over time, they may have gained better access to understory light and therefore beneWted from an increased release probability over time. We tested this hypothesis by comparing the pro-portion of largest stems in release over time to the propor-tion of the smallest stems in release. The stems from the two groups had very similar trends (Fig. AII.2). If there was a strong size eVect aVecting the probability of release, the largest stems should show a pronounced increase in the proportion of release in the 1990–2000 period, which we did not observe. Moreover, radial growth in our time series was only weakly related to stem size, suggesting that the detection of release events is independent of size (Gravel et al., unpublished manuscript). Consequently, we are con-Wdent that the pattern we observed is not an artefact of our methodological approach.
Statistical analysis
To determine whether the overall time series of occurrence of release events was nonstationary, we Wtted a second-order polynomial to the time series of the fraction of stems in release, accounting for the eVects of region (random
factor) and species (including interaction terms). We tested whether there was a characteristic scale of synchrony by assessing the correlation of the time series of fraction of stems in release between all possible (561) pairs of sites. A second-order polynomial was Wtted to test the relationship between the geographic distance between pairs of sites and their correlation. Finally, we tested whether temporal varia-tion in release events aVected the composivaria-tion of tree spe-cies in the understory using redundancy analysis (RDA), a multivariate form of multiple regression (Legendre and Legendre 1998). RDA is a constrained ordination method that models the structure of several dependent variables while accounting for a multivariate set of explanatory vari-ables. It allows easy representation in a two-dimensional plot of a multivariate analysis and the partitioning of the variance. It Wrst models each dependent variable with respect to the independent variables and then performs ordination for all dependent variables with respect to the modeled relationships with the independent variables. The dependent variables were, in the Wrst analysis, the relative density and relative BA of ASA saplings (vs. ASA + FGR) per site, and, in a second analysis, the Hellinger-trans-formed abundances (Legendre and Gallagher 2001) of all the species recorded among saplings. The independent vari-ables were the proportion of stems in minor release at each site (the two species combined since there were no diVer-ences between them in the shape of the temporal pattern) at Wve-year intervals. The results were similar with major release (not shown). The signiWcance of the RDA was tested against the distribution of the F statistic based on 10,000 permutations of the residuals (Legendre and Legendre
1998).
Results
We compared the principal descriptors of release history (i.e., number of releases per series, fraction of time in release, average release duration) between species with ANOVA (Table1). There were on average 2.02 and 1.76 minor release events per series for ASA and FGR (P < 0.001), respectively, occurring throughout 40 and 37% of the lifespan of individuals (P = 0.013), for average dura-tions of 9.08 and 9.61 years (P = 0.593). The comparisons of descriptors between species were similar, with generally lower values, for major releases (Table1).
Across the 34 stands, the proportion of stems under minor and major release followed a marked nonlinear pat-tern over time (Fig.1). The proportion of stems in minor release ranged between 50 and 60% for the 1960s, decreased to 20–35% in the 1980s, and then increased to 50–60% during 1998–2003. The pattern was U-shaped for both species. The polynomial model successfully described
this pattern (P < 0.001), with much of the variation accounted for by the Wrst- and second-order terms (for year: F value = 41.64, P < 0.001; for year2: F value = 529.48, P < 0.001). There was a signiWcant diVerence between spe-cies for the intercept (F value = 14.71, P < 0.001; ASA had the highest fraction of stems in release), but this eVect accounted for little variance compared to that modeled by the second-order term. The shape of the pattern was the same between species (no signiWcant interaction of species in the Wrst- and second-order terms) and between the two regions.
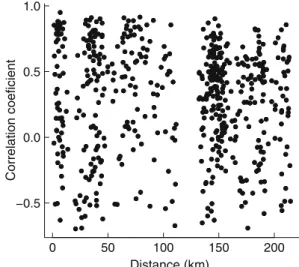
Synchrony among sites occurred at all scales of our sam-pling design (Fig.2; illustrated for minor release, but results were similar for major release). The maximum dis-tance between sampled stands was >200 km. The correla-tion between series was not related to distance (polynomial regression, P = 0.236 for the Wrst-order term and P = 0.115 for the second-order term). Relationships within regions were not statistically signiWcant for both regions.
The density of understory saplings in the 34 stands var-ied between 1,633 and 4,767 stems/ha (all species com-bined). For ASA and FGR, the density ranged from 33 to 2,833 stems/ha and from 233 to 4,767 stems/ha, respec-tively. The relative abundance of ASA ranged from 3 to 91%. The Wrst RDA performed on the abundance of ASA relative to FGR, calculated from both sapling density and BA, revealed that the proportion of stems in minor release at diVerent times during the last 35 years contributed sig-niWcantly to spatial variability in sapling composition at the time of sampling (R2= 0.404, P = 0.027 Fig.3a). The rela-tive abundance of ASA in 2003 was posirela-tively correlated to the proportion of stems in minor release during the 1975, 1980 and 1985 periods (i.e., when release events were
infrequent), but was negatively correlated to the 1990, 1995 and 2000 periods (when release events were frequent Fig.3a). The ordination of the proportion of release at
Wve-year intervals illustrates the contrast between the 1975– 1985 periods and the remaining periods. The proportion of stems during that period was not correlated to the 1970 period, was weakly correlated to the 1990–1995 periods, and was correlated to the 2000 period. The ordination also showed that the higher the proportion of stems in release during 1975–1985, the more abundant ASA was relative to FGR in 2003. In contrast, ASA was least abundant at sites with an elevated proportion of release during the 1990– 2000 periods. A RDA using all-species abundance in the sapling layer, however, showed that the pattern was less clear than in the previous analysis (Fig.3b). The overall proportion of the variance explained in the second analysis was lower (R2= 0.285, P = 0.050). The abundance of ASA was uncorrelated to that of Acer pensylvannicum L. and Viburnum alnifolium Michx. and weakly negatively corre-lated to that of FGR. Acer spicatum Lam. and B. alleghani-ensis were positively correlated to the proportion of stems in release in the 2000 period and A. pensylvannicum and V. alnifolium to those in the 1990 and 1995 periods. The abundance of ASA in 2003 was positively correlated with the proportion of stems in release during the 1975–1985 periods, while the abundance of FGR was positively corre-lated with proportion of stems in release during the 1970 and 1990 periods.
Discussion
The temporal pattern in release events we observed was consistent among all sites, with no distinction between Fig. 1 Proportion of saplings under minor (>100% increase in radial
growth) and major (>200% increase) release over time. Acer. saccha-rum (ASA) and Fagus. grandifolia (FGR) data were pooled to allow the standard error to be plotted (dotted lines)
1965 1975 1985 199 5 0. 1 0. 2 0. 3 0. 4 0. 5 0. 6 0. 7 Year
Proportion of stems in release
Minor releas e Major releas e
Fig. 2 Correlation between time series of the fractions of stems in minor release against the distance (km) between sites
0 5 0 1 00 150 200 −0.5 0. 0 0. 5 1. 0 Distance (km) Correlation coeficient
regions or species. We know of no other study that has doc-umented similar patterns at such a large spatial scale. The synchrony we observed did not decline with distance between sites at the 200 km spatial scale we studied. This would suggest that synchrony in sapling release events occurs at a scale even larger than the region we sampled.
Our study was not speciWcally designed to identify the cause(s) of this marked U-shaped pattern. Nevertheless, some possible causes can be ruled out a posteriori. First, the
stands we sampled had no recent sign of logging (neither fresh nor old decaying stumps). Given the extensive history of logging throughout the study regions, it is reasonable to assume that our sampling sites may have been partially logged in the early or mid-twentieth century (Majcen 1994; Brisson and Bouchard 2003; Boucher et al. 2006). How-ever, we found saplings older than 100 years old at most sites, which suggests that recruitment has been continuous for a long time. Second, the catastrophic ice storm that hit southern Quebec in 1998 is too recent to explain the increase in release frequency that started in the early 1990s observed in this study. Moreover, the Portneuf region was not hit by the ice storm, but still showed the same 1990s increase in release frequency. A third potential cause of the U-shaped pattern that can be ruled out is the inXuence of beech bark disease (Krasny and DiGregorio 2001); the dis-ease has not yet signiWcantly impacted Quebec’s deciduous forests (Duchesne et al. 2005). Finally, the U-shaped pat-tern of release frequency was not related to the decline epi-sode that aVected southern Quebec forests during the 1980s (Payette et al. 1996), since the 1980s correspond in our record to the period with the lowest frequency of release.
Nevertheless, a number of potential causes remain, and diVerent factors may have impacted the stands at diVerent time periods. The occurrence of extreme climatic events such as severe droughts (Payette et al. 1996; Olano and Palmer 2003) and insect outbreaks (Payette et al. 1996) are known to periodically aVect canopy opening at large scales. Further research is needed to determine if and how such factors, or other ones, may have generated such a synchro-nous temporal U-shaped pattern of release across such a large regional scale.
Even though we could not identify the underlying cause(s) of the observed pattern, our Wndings have impor-tant implications for forest dynamics and ecosystem func-tioning at large spatial scales. In the case of ASA and FGR, short- and long-term changes in their relative abundance have been reported in both managed and old-growth for-ests, some in favor of ASA (e.g., Runkle 1990; Fain et al.
1994; Poulson and Platt, 1996), and others in favor of FGR (e.g., Brisson et al. 1994; Woods 2000; Duchesne et al.
2005). These changes have been attributed to site-level and exogenous temporal variations in canopy gap dynamics (Poulson and Platt 1996; Beaudet et al. 1999). Numerous reports over the last few decades have indicated an unex-pected increase in the abundance of FGR saplings relative to sugar maple in various regions of the ranges of these spe-cies (Ostrofsky and McCormack 1986; Schwarcz et al.
2001; Forrester et al. 2003; Hane 2003; Duchesne et al.
2005). While changes in soil properties have been hypothe-sized to be responsible for changes in the recruitment dynamics of ASA and FGR at some sites (Kobe et al. 2002; Lovett and Mitchell 2004; Duchesne et al. 2005), this Fig. 3 Biplots from a redundancy analysis (RDA) of vegetation
com-position as a function of the proportion of stems in minor release (ASA and FGR combined). The angle between arrow pairs is a measure of the correlation between the variables that they represent. Arrows point-ing in the same direction are strongly positively correlated, arrows pointing in opposite directions are negatively correlated, and perpen-dicular arrows are not correlated. The length of each arrow is propor-tional to the contribution of the corresponding variable to the analysis. Points represent each of the 34 sites. a ASA and FGR relative abun-dance among saplings, calculated from stem density and basal area; b all understory woody species (with Hellinger transformation of abundance data). ABA, Abies balsamea; ASA, Acer saccharum; ASP, Acer spicatum; APE, Acer pensylvanicum; BAL, Betula alleghanien-sis; FGR, Fagus grandifolia; OSV, Ostrya virgiana; VAL, Viburnum
alnifolium. Years correspond to the endpoints of Wve-year periods
−6 −4 −2 −6 −4 −2 0 2 4 RDA 2 Density Basal.Area 197 0 197 5 198 0 198 5 199 0 199 5 200 0 (a) −4 −2 0 2 4 0 2 4 6 −4 −2 0 2 4 RDA 1 RDA 2 BAL PSE CCO PR U APE ASP AR U ASA FA M FG R UA M OV I TCA ABA TA M VA L 197 0 197 5 198 0 198 5 199 0 199 5 200 0 (b)
hypothesis was not supported by Gravel et al. (unpublished manuscript) for these same study sites. The results presented here suggest an alternative cause of this recent widespread change in the regeneration dynamics of northern hardwoods.
The response to light availability is a major niche axis diVerentiating ASA and FGR (Pacala et al. 1996). Obvi-ously, Xuctuations in light availability would result in corresponding Xuctuations in recruitment dynamics. The traditional model for the coexistence of ASA and FGR (Poulson and Platt 1996) predicts that ASA will have greater recruitment (in absolute number of individuals) than FGR under high light conditions because of its greater fecundity and ability to maintain an abundant seedling bank (Marks and Gardescu 1998). Under low light, mortality is expected to be higher for ASA than for FGR (Kobe 1996), but growth release should be more important for ASA than for FGR (Canham 1990). During periods of low light both species should decrease in density, but the decline should be slower for FGR than ASA due to its higher survival rate, leading to an increase in its relative abundance. In this study, we showed that the relative abundance of ASA was associated with the temporal pattern of release frequency, suggesting that the lower frequencies of release observed in the 1975–1985 period may have limited the current abun-dance of ASA.
Our results suggest that large-scale temporal variations in canopy gap dynamics could at least partly explain the recent increase in FGR in the understory of eastern North American temperate deciduous forests (Duchesne et al.
2005; Gravel 2007). FGR may have had a more favorable response than ASA to the rising frequency of release during 1990–2000. Increased FGR growth during this period likely allowed a rapid transition from the seedling to the sapling stage, a possible explanation for the doubling of FGR sap-ling density recorded in the last ten years in the Quebec for-est inventory data (Gravel 2007) and reported by Duchesne et al. (2005). The decreased ASA abundance at sites which had few release events during 1975–1985 is similar to the phenomenon observed in an old-growth forest in Quebec where extended periods of low light conditions resulted in a recruitment failure of ASA in the sapling layer, despite extremely high densities of ASA seedlings (Beaudet et al.
1999). At that same site, the 1998 ice storm greatly aVected
the canopy, leading to a sudden but short-lived increase in understory light, but no shift in the species hierarchy was observed (Beaudet et al. 2007b). We hypothesize that the large-scale synchrony of low light conditions during the 1980s reduced the abundance of ASA saplings by a greater degree than for FGR, therefore aVecting the ability of ASA to respond to the subsequent canopy opening that occurred in the 1990s. Conversely, FGR was relatively less aVected by the slow-growth conditions of the 1980s and therefore
managed to capitalize on the canopy opening to increase in abundance during the 1990s.
Conclusion
Regionally synchronized large-scale temporal variations in release frequency are hypothesized to have had a major inXuence on the recruitment dynamics of ASA–FGR for-ests. That variations in release frequency (likely a function of small-scale disturbance frequency) were the main factor aVecting the relative abundance of ASA and FGR among sites would probably not be particularly revealing at the local scale (Poulson and Platt 1996; Gravel et al. 2008); however, this is a surprising result when considered at the regional scale. Forest communities are never at equilib-rium at the scale of a single stand (Woods 2000); this nonequilibrium could also be true at the regional scale. Conceptual models of species coexistence in forest com-munities generally account for variation over time in the rate of canopy gap formation at the stand scale (Poulson and Platt 1996). However, links between stand-scale rates of gap formation and larger spatial-scale variation in dis-turbance regimes are less well understood. Disdis-turbance regimes are known to result from the complex interplay of allogeneic and exogenous factors, and many processes at the regional scale can potentially aVect the latter. Future research should aim to better identify such processes in order to improve our understanding of how these aVect disturbance regimes and forest dynamics at multiple spa-tial and temporal scales.
Acknowledgments We thank D. Fréchette and D. Sénécal for assis-tance in the Weld and laboratory. Access to study sites was made pos-sible by Domtar and the Unité de Gestion de Portneuf. Thanks to C. Drever, Miguel Franco and two anonymous reviewers for helpful comments on earlier versions of the manuscript. Financial support was provided by Fonds d’Action Québécois sur le Développement Dura-ble, Fonds Québecois de la Recherche sur la Nature et les Technologies (FQRNT, Programme des Actions Concertées), and the Natural Sciences and Engineering Research Council of Canada (NSERC). This work was conducted in compliance with the laws of Canada.
References
Battles JJ, Fahey TJ (2000) Gap dynamics following forest decline: a case study of red spruce forests. Ecol Appl 10:760–774 Beaudet M, Messier C (2008) Beech regeneration of seed and root
sucker origin: a comparison of morphology, growth, survival, and response to defoliation. For Ecol Manage 255:3659–3666 Beaudet M, Messier C, Paré D, Brisson J, Bergeron Y (1999) Possible
mechanisms of sugar maple regeneration failure and replacement by beech in the Boisé-des-Muir old-growth forest, Québec. Éco-science 6:264–271
Beaudet M, Brisson J, Gravel D, Messier C (2007a) EVect of a major canopy disturbance on the coexistence of Acer saccharum and
Fagus grandifolia in the understory of an old-growth forest. J Ecol 95:458–467
Beaudet M, Brisson J, Messier C, Gravel D (2007b) EVect of a major ice storm on understory light conditions in an old-growth Acer Fagus forest: pattern of recovery over seven years. For Ecol Man-age 242:553–557
Bjornstad ON, Peltonen M, Liebhold AM, Baltensweiler W (2002) Waves of larch budmoth outbreaks in the European Alps. Science 298:1020–1023
Bouchard M, Kneeshaw DD, Bergeron Y (2006) Forest landscape composition and structure after successive spruce budworm outbreaks. Ecology 87:2319–2329
Boucher Y, Arseneault D, Sirois L (2006) Logging-induced change (1930–2002) of a preindustrial landscape at the northern range limit of northern hardwoods, eastern Canada. Can J For Res 36:505–517
Brisson J, Bouchard A (2003) In the past two centuries, human activi-ties have caused major changes in the tree species composition of southern Quebec, Canada. Écoscience 10:236–246
Brisson J, Bergeron Y, Bouchard A, Leduc A (1994) Beech-maple dynamics in an old-growth forest in southern Québec, Canada. Écoscience 1:40–46
Brokaw NVL (1982) The deWnition of tree-fall gap and its eVect on measures of forest dynamics. Biotropica 14:158–160
Canham CD (1990) Suppression and release during canopy recruit-ment of Acer saccharum and Fagus grandifolia. Bull Torrey Bot Club 117:1–7
Canham CD, Denslow TS, Platt WJ, Runkle JR, Spies TA, White PS (1990) Light regimes beneath closed canopies and tree-fall gaps in temperate and tropical forests. Can J For Res 20:620–631 Clark JS, McLachlan JS (2003) Stability of forest biodiversity. Nature
423:635–638
Cleavitt NL, Fairbairn M, Fahey TJ (2008) Growth and survivorship of American beech (Fagus grandifolia Ehrh.) seedlings in a northern hardwood forest following a mast event. J Torrey Bot Soc 135:328–345
Drohan PJ, Stout SL, Petersen GW (2002) Sugar maple (Acer saccha-rum Marsh.) decline during 1979–1989 in northern Pennsylvania. For Ecol Manag 170:1–17
Duchesne L, Ouimet R, Moore JD, Paquin R (2005) Changes in struc-ture and composition of maple-beech stands following sugar maple decline in Québec, Canada. For Ecol Manage 208:223–236 Fain JJ, Volk TA, Fahey TJ (1994) Fifty years of change in an upland forest in south-central New York: general patterns. Bull Torrey Bot Club 121:130–139
Forrester JA, McGee GG, Mitchell MJ (2003) EVects of beech bark disease on above ground biomass and species composition in a mature hardwood forest, 1985–2000. J Torrey Bot Soc 130:70–78 Glitzenstein JS, Harcombe PA, Streng DR (1986) Disturbance, succes-sion, and maintenance of species diversity in an east Texas forest. Ecol Monogr 56:243–258
Gravel D (2007) Coexistence et dynamique d’espèces forestières tolé-rantes à l’ombre: le cas de l’érable à sucre et du hêtre à grandes feuilles (Ph.D. dissertation). Université du Québec à Montréal, Montréal, Canada
Gravel D, Beaudet M, Messier C (2008) Partitioning the factors of spatial variation in regeneration density of shade-tolerant tree species. Ecology 89:2879–2888
Hane EN (2003) Indirect eVects of beech bark disease on sugar maple seedling survival. Can J For Res 33:807–813
Kneeshaw DD, Bergeron Y (1998) Canopy gap characteristics and tree replacement in the southeastern boreal forest. Ecology 79:783– 794
Kobe RK (1996) IntraspeciWc variation in sapling mortality and growth predicts geographic variation in forest composition. Ecol Monogr 66:181–201
Kobe RK, Likens GE, Eagar C (2002) Tree seedling growth and mor-tality responses to manipulations of calcium and aluminum in a northern hardwood forest. Can J For Res 32:954–966
Koenig WD, Knops JMH (1998) Scale of mast-seeding and tree-ring growth. Nature 396:225–226
Krasny ME, DiGregorio LM (2001) Gap dynamics in Allegheny northern hardwood forests in the presence of beech bark disease and gypsy moth disturbances. For Ecol Manage 144:265–274
Lande R, Engen S, Saether BE (2003) Stochastic population dynamics in ecology and conservation (Oxford Series in Ecology and Evo-lution). Oxford University Press, Oxford
Landis RM, Peart D (2005) Early performance predicts canopy attain-ment across life histories in subalpine forest trees. Ecology 86:63–72
Legendre P, Gallagher ED (2001) Ecologically meaningful trans-formations for ordination of species data. Oecologia 129:271– 280
Legendre P, Legendre L (1998) Numerical ecology (Developments in Environmental Modelling, vol 20), 2nd English edn. Elsevier, Amsterdam
Liebhold A, Koening WD, Bjornstad ON (2004) Spatial synchrony in population dynamics. Annu Rev Ecol Evol Syst 35:467–490 Lorimer CG (1980) Age structure and disturbance history of a southern
Appalachian virgin forest. Ecology 61:1169–1184
Lorimer CG, Dahir SE, Singer MT (1999) Frequency of partial and missing rings in Acer saccharum in relation to canopy position and growth rate. Plant Ecol 143:189–202
Lovett GM, Mitchell MJ (2004) Sugar maple and nitrogen cycling in the forests of eastern North America. Frontiers Ecol Environ 2:81–88
Majcen Z (1994) Historique des coupes de jardinage dans les forêts inéquiennes au Québec. Revue Forestière Française 46:375– 384
Marks PL, Gardescu SA (1998) A case study of sugar maple (Acer sac-charum) as a forest seedling bank species. J Torrey Bot Club 125:287–296
Olano JM, Palmer MW (2003) Stand dynamics of an Appalachian old-growth forest during a severe drought episode. For Ecol Manage 174:139–148
Ostrofsky WD, McCormack ML (1986) Silvicultural management of beech and the beech bark disease. North J Appl For 3:89–91 Pacala SW, Canham CD, Saponara J, Silander JA, Kobe RK, Ribbens
E (1996) Forest models deWned by Weld measurements: estima-tion, error analysis and dynamics. Ecol Monogr 66:1–43 Payette S, Fortin M-J, Morneau C (1996) The recent sugar maple
de-cline in southern Quebec: probable causes deduced from tree rings. Can J For Res 26:1069–1078
Poulson TL, Platt WJ (1996) Replacement patterns of beech and sugar maple in Warren Woods, Michigan. Ecology 77:1234–1253 Robitaille A, Saucier J-P (1998) Paysages régionaux du
Québecmérid-ional. Les Publications du Québec, Ste-Foy
Rubino DL, McCarthy BC (2004) Comparative analysis of dendroeco-logical methods used to assess disturbance events. Dendrochron-ologia 21:97–115
Runkle JR (1981) Gap regeneration in some old-growth forests of the eastern United States. Ecology 62:1041–1051
Runkle JR (1990) Gap dynamics in an Ohio Acer-Fagus forest and speculations on the geography of disturbance. Can J For Res 20:632–641
Schwarcz PA, Fahey TJ, Martin CW, Siccama TG, Bailey A (2001) Structure and composition of three northern hardwood-conifer forests with diVering disturbance histories. For Ecol Manage 144:202–212
Woods KD (1979) Reciprocal replacement and the maintenance of codominance in a beech–maple forest. Oikos 33:31–39
Woods KD (2000) Long-term change and spatial pattern in a late-suc-cessional hemlock–northern hardwood forest. J Ecol 88:267–282 Woods KD (2004) Intermediate disturbance in a late-successional
northern hardwood forest. J Ecol 92:464–476
Woods KD (2007) Predictability, contingency and convergence in late succession: slow systems and complex datasets. J Veg Sci 18:543–554