Any correspondence concerning this service should be sent to the repository
administrator:
[email protected]
O
pen
A
rchive
T
OULOUSE
A
rchive
O
uverte (
OATAO
)
OATAO is an open access repository that collects the work of Toulouse researchers and
makes it freely available over the web where possible.
This is an author-deposited version published in:
http://oatao.univ-toulouse.fr/
Eprints ID: 16200
To cite this version:
Rome, Fanny and Adam, Guillaume and Condette, Johan and
Dehais, Frédéric and Causse, Mickael Go-around manoeuver: a simulation study.
(2012) In: 30EAAP 2012, 24 September 2012 - 28 September 2012 (Villasimius, Italy).
1
Go-around manoeuver: a simulation study
Fanny Rome Guillaume Adam Johan Condette Frédéric Dehais Mickaël Causse Dédale SAS, 15 place de la Nation, 75011, Paris, France [email protected]
Bureau d’Enquêtes et d’Analyses 220 rue de Paris
93352 Le Bourget Cedex, France
Université de Toulouse, ISAE, 10 avenue E. Belin, 31055 Toulouse Cedex 4, France
Abstract
Events during which a safe go-around was not achieved have been brought to the attention of the BEA (Bureau Enquête Analyse pour la Sécurité de l'Aviation civile – French Safety Board) due to their noticeable increase since the 2000s. Considering the greater risk associated with the go-around manoeuvre, currently defined as a normal phase of flight, the BEA has decided to undertake a study named ASAGA (Aircraft State Awareness during Go Around). The study aimed at identifying the weaknesses of the system during go-around manoeuvres regardless of the type of aircraft and the airline operational procedures. In this context, the analysis relied mainly on three components: (1) Safety events (incidents / accidents); (2) Large scale survey; and (3) Flight simulations. Experiments were conducted using two long-range full flight simulators with operational pilots. This paper presents the method used to conduct the experiment and some of the resulting data, as well as some initial conclusions. The data included: video camera recordings for task analysis; recordings of the ocular activity of the two pilots; and debriefings. The eye trackers were used to analyze the pilot’s scanning patterns and the distribution of their attention during this particular flight phase. The debriefings consisted of interviews, based on the confrontation technique, which enable the pilots to self-assess their actions and situational awareness. Eleven crews from three French airlines participated to the simulations. The scope was not explained to them to prevent any anticipation. Each crew performed the same scenario from take off to landing that included three go-around manoeuvres. The first results indicate some concerns related to the cooperation between controllers and aircrews in such demanding occurrences, some lack of understanding of cockpit automatisms and failures in crew resource management. Results are discussed in terms of potential improvements of the Human Machine Interface, pilots-controllers interactions and task sharing within the aircrew.
KEY WORDS: Go-around, eye tracking, situation awareness, aviation safety
Introduction,
Events during which a safe go-around was not achieved have been brought to the attention of the BEA (Bureau Enquête Analyse pour la Sécurité de l'Aviation civile – French Safety Board) due to their noticeable increase since the 2000s. Considering the greater risk associated with the go-around manoeuvre, currently defined as a normal phase of flight, the BEA has decided to undertake a study named ASAGA (Aircraft State Awareness during Go Around). The study aims at identifying the weaknesses of the system (composed by the crew, the aircraft and the controller) during go-around manoeuvres regardless of the type of aircraft and the airline operational procedures. In this context, the analysis relies mainly on three components: (1) Safety events (incidents / accidents) analysis; (2) a large scale survey and (3) a flight simulator experiment.
The objective of the simulations lied on the confirmation of the results uncovered by the event analysis and the large scale survey. The
observation of the crew during the performance of the real activity, as well as data related to their visual scan, are necessary to understand the mechanisms that lead to unstabilized go-around. Eye tracking offers a fruitful perspective to assess the pilot’s performance since visual perception is a key for pilot to control the flight (Kasarskis& al., 2001; Mumaw&al., 2001)
In addition, go-around is a rare and risky manoeuvre, the observation in the real context was obviously unrealistic. Therefore, the use of high-fidelity simulation was essential to recreate the dynamics of the situation.
This paper presents the method used to conduct the simulations, the analysis of the resulting data, and some initial conclusions. A global report of the ASAGA study will be later published by the BEA, it will detail all these elements as well as the other components of the study.
2
Method
Simulation settings
The experiments were conducted using two long-range full flight simulators (B777 and A330).
Scenario
A realistic flight scenario was built with the participating airlines from take off to landing. The flight lasted 2 hours and contained three go around manoeuvres:
- A first one at low level with a low altitude gain, initiated at the request of the ATC. The trajectory was modified by the ATC;
- A second one initiated by the crew (due to downwind);
- A third one due to a lack of visibility.
Detailed scenario
The flight was planned to depart from Bordeaux inbound to Lyon. The aircraft has several hours of autonomy and no particular meteorological conditions are expected. ATC instructs the crew to perform a go around at 200ft due to an occupied runway. Contrary to the procedure, ATC requests that the crew turn left 340 degree and climb to 2,500ft. The crew diverts to Marseille. They perform a standard ILS approach during which the simulated wind progressively turns downwind its strength increases up to 15 to 20knots. ATC only informs the crew about this change in wind direction during short final. Controllers also limit the altitude to 2,000 ft instead of 3,500ft during the go around. The crew continue their flight (LOC DME). Visibility is then nil, leading the crew to perform a third and last go around.
Data collected
Direct observations (simultaneous and video recordings)
Video (Hd) was used to record all the displays and all the communications to allow an accurate post-analysis.
Observations were carried on during the entire scenario by two human factors specialists inside the cockpit and by two investigators with the help of a remote video streaming.
Subjective assessment
The debriefings consisted of interviews, based on the self-confrontation technique, which enabled the pilots to self-assess their actions and their situational awareness.
Visual scan
The objective was to analyze the pilots’ scanning patterns and the distribution of their attention during the go-around. Two synchronised 50Hz Pertech head-mounted eye trackers were used (0.25 degree of accuracy). 12 areas of interest (AOI) on the cockpits were defined as follows: 1) primary flight display, 2) speed, 3) artificial horizon, 4) altitude, 5) heading, 6) flight mode annunciator (FMA), 7) navigation display (ND), 8)
electronic centralized aircraft monitor (ECAM), 9) left multipurpose control display unit (MCDU), 10) right MCDU, 11) visual scene, 12) flight control unit (FCU). A 13th AOI was considered in order to collect the ocular fixations out of the other twelve previous (out of zone, OZ).
Sample
Eleven crews (one captain and one first officer) were recruited from three French airlines. Each crew performed the same scenario, i.e the three go-around manoeuvres. This represents a sample of 33 go around (GA) according to the following experimental plan:
A/C GA1 GA2 GA3 Crew 1-6 (1 airline) Boeing Captain PF/ Co-pilot PNF Captain PNF/ Co-pilot PF Crew 7-11 (3 airlines) Airbus captain PF/ Co-pilot PNF Captain PNF/ Co-pilot PF
Protocol
All participants were volunteers and the objectives were not explained to them to prevent any anticipation. Each session lasted at least 4h30 and consisted of the following steps: briefing (30 min); installation in the cockpit (equipped with the data recording kits) (30min); flight (2h); debriefing (1h30).
Results
The results presented in this paper are limited to the first 11* go around (GA1) which contain the most interesting results. Temporal aspects, visual patterns and task analysis are described and then discussed. *Some results are for only 10 GA out of 11 because of a small modification of the scenario for one crew.
Temporal aspects
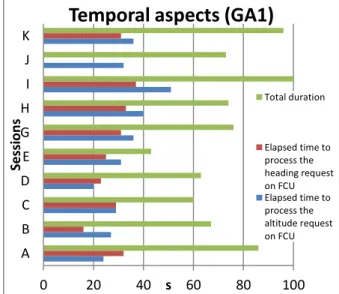
The timing of actions during GA1 was measured monitored from the beginning of the controller’s clearance to the stabilisation at heading 340° and altitude 2500 ft (Figure 1).
Figure 1 : Temporal aspects
0 20 40 60 80 100 A B C D E G H I J K s Se ssi o n s
Temporal aspects (GA1)
Total duration Elapsed time to process the heading request on FCU Elapsed time to process the altitude request on FCU
3
Regarding the 10 GA1, the total duration ranges from 1min00s to 1min40s. Figure 1 indicates the elapsed times to select the altitude and the heading modes and values corresponding to the controller’s request. They respectively range from 20 to 51s and from 16 to 37s.The duration ranges emphasise the variability of crews’ strategies and the resulting variety of situation dynamics.
Visual Scan
Figure 2 : Percentages of time spent per AOI during GA1.The error bars represent the standard deviation.
PF the PF’s attention was generally focused on the basic navigation information from the PFD
PNF the PNF’s attention was more diffused compared to the PF
Figure 3 : Representative heat maps of GA1.
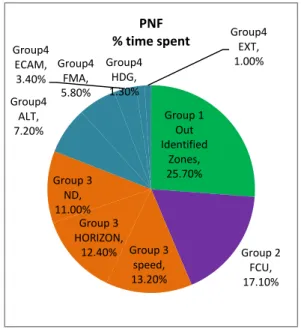
Figure 2 presents the percentages of time spent per area of interest during the first Go-around. The PF were more focused on the horizon (50% average) compared to the PNF (12.5% average). Conversely, the PNF spent more time gazing Out of Zone (23.9% vs 4.1%), on the FCU (17.1% vs 4.6%) and on the ND (11% vs 4.4%).
The distribution of the time spent on the several cockpit equipments were also analysed for both PF and PNF. Distinct homogeneous groups, based on one or several areas of interest (some AOI cannot be dissociated), have been identified. The figures below (Figure 4 and Figure 5) present the hierarchical classification of these groups based on the percentage of time spent on them. Regarding the PF (Figure 4), the artificial horizon elicits the higher fixation times (Group 1). The second mostly fixated group (Group 2) is composed by SPEED and ALT/VARIO.
Regarding the PNF, the OZ elicits the higher fixation times (Group 1), followed by the FCU
(Group 2) and the AOI group composed of speed/ND / artificial horizon.
Figure 4 : percentage of fixation time on the various instruments of the cockpit for the PF
Figure 5 : percentage of fixation time on the various instruments of the cockpit for the PNF
The statistical analysis indicates that the PF’s and PNF’s eye movements were significantly different. Although they did not pay the same attention in all AOIs, all PF constitute a homogeneous group in terms of eye movements as well as all PNF. This means that PF tended to spend the same percentage of time on the various AOI during GA1. This applies to PNF as well. However, the trajectories/paths of the eye movement for PNF are not homogeneous. PNF did not watch the AOIs in the same way, nor according to the same sequence. 0.0 10.0 20.0 30.0 40.0 50.0 60.0 70.0 PF PNF
GA1
Group 1 HORIZON 52% Group2 Speed 12% Group2 ALT 11% Group3 FMA 6% Group3 FCU 5% Group3 ND 4% Group3 Hors Zones 6% Group3 ECAM 2% Group3 HDG 2% Group3 EXT 1%PF
% time spent
Group 1 Out Identified Zones, 25.70% Group 2 FCU, 17.10% Group 3 speed, 13.20% Group 3 HORIZON, 12.40% Group 3 ND, 11.00% Group4 ALT, 7.20% Group4 FMA, 5.80% Group4 ECAM, 3.40% Group4 HDG, 1.30% Group4 EXT, 1.00% PNF % time spent4
Task analysis
The go-around manoeuvre consists in rapidly bringing the aircraft in an ascending profile according to an assigned trajectory. To manage this trajectory, once the go-around is initiated, crews had to take into account the vertical and heading constraints given by the controller while managing automatisms. The results of the task analysis corresponding to these different actions are presented in the following paragraphs. Their complete description falls beyond the scope of this paper; hence, the results are limited to the noticeable deviations or adaptations that are safety-relevant.
Initialisation
The Go-around initialisation consists in applying TOGA mode, in setting the adequate thrust and in retracting the flaps one step.
For the eleven sessions, this initialisation was performed without major difficulties or failures by the crews: all of them initiated the go-around at the request of the ATC, all applied the adequate thrust, the TOGA mode, and retracted flaps one step. A normal variability can be observed: absence of the go-around announcement, error of step in the flaps retracting request etc... All these approximations were nevertheless compensated within the crew.
Positive climb callout and Gear up
The expected sequence of actions is as follows: the PNF tells the PF when the variometer becomes positive, the PF orders “gear up”, and the action is executed by the PNF.
The eleven crews moved the gear up; seven of them followed exactly the expected sequence. For the others, small adaptations can be noticed : in two cases the PF (instead of PNF) announced the positive climb, one PF ordered the gear up not by an announcements but just by pointing it with the finger and one PF moved the gear up without any announcement.
Management of ATC clearances (heading and altitude)
Ten GA1 out of the eleven were requested by ATC with the following communication: “XXX go-around, runway occupied , turn left heading 340 and climb 2500ft”. The expected response consisted of: (1) `read back by the PNF; (2) selection of 340 and of the heading mode, selection of 2500 and altitude mode.
The ten crews reacted in different ways; most of them broke their reaction in two steps. Indeed more than half of the crews re-contacted the ATC to obtain clarifications either at the PNF’s (two cases) or at the PF’s (four cases) initiative. For them, the heading and altitude selection was performed within 30-40s. One crew read back the
go-around adding “standby” and contacted the ATC 30s after.
For the three others who took into account the clearances in one step, some deviations and approximations can be noticed: An error in the altitude read back and an error in the altitude mode selection (directly detected by the PF); An an error of the lateral mode selection; An immediate selection of the clearances provided by the PF but the read back by the PNF only one minute later.
Modes management
Initial modes announcement
In case of a mode change, the expected behaviour is the announcement by the PF and the check by the PNF. This expected behaviour, depending on the airline, is either described in the Go-around procedure or in the general operation procedures.
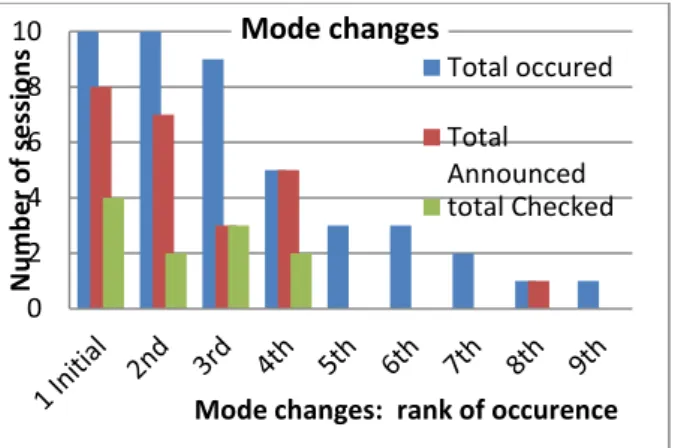
The figure 6 presents for each rank of change (1st mode change, 2nd mode change...), the number of sessions concerned by this rank. It also presents, for these sessions, the number of announcements and checks performed by the crew. For example, 9 sessions had at least 3 mode changes, the third change was announced by 5 PF out of the 9 and checked by 5 PNF.
The initial modes were announced by seven PF (out of ten) and were checked (with an announcement) by five PNF. One PNF announced the initial modes. Thus, two crews did not announce at all the initial modes.
Figure 6 : Mode changes and announcements Announcement of the following modes
The expected sequences of modes for the go around were disrupted by the ATC request and the adaptations performed by pilots to adhere to this request. These disturbances induced in certain cases a consequent number of mode changes in a rapid sequence.
For example, in one GA situation, up to nine successive mode changes can be observed
0 2 4 6 8 10 N u m b e r o f sessi o n s
Mode changes: rank of occurence
Mode changes
Total occured Total
Announced total Checked
5
(considering the active modes only). These changes (especially the fifth and the followings) were only succinctly announced by crews (figure 6).
Mode selection
In order to modify the go around trajectory as required by the ATC, the crews had to select the “heading” and “altitude” modes. Some crews had difficulties in the selection of these modes.
Twice, the HDG mode was not selected by the PNF, the two PF detected the error of selection: “heading sel”, “please activate the hdg”,
For one crew, the heading mode was selected during a short time, but the PF (unaware of this activation) ordered the PNF to “pull” the button (to activate the mode), the PNF pushed the button and the navigation mode was thus engaged. The error mode selection remained undetected. Trajectory management
The following of the requested trajectory is subjected to variability inherent to the high constraints imposed on the crew. Small altitude deviations occurred due to the aircraft inertia or due to the more or less accurate following of the Flight Director. Approximations of the heading also occurred. For example, some crews immediately acknowledged the ATC request to turn left and anticipated the selection of a precise heading.
Besides this small variability, more considerable horizontal and vertical trajectory deviations occurred.
In the horizontal plan, there were 3 major deviations from the requested 340°:
Until 300° for a first crew
The PNF read back 340 and input 240 in the FCU. The PF checks the heading mode selection and follows the FD. The error in the value is not detected. The deviation is detected by ATC who informs the crew.
Until 320° a the second crew
The 340 heading is correctly selected by the PNF. The PF repeats the modification requests “left turn, 2500ft”. He
initially executes a left turn, without following the Flight director He said during the debriefing “I had adequately understood the altitude but I was not sure about the heading. I could see the FD on the right while we had to go on the left, so I overshot”. The PNF says during the debriefing that he monitored the speed and the altitude: “I didn’t see the .FD.”.
From 325° to 030°fo a third crew
Heading 340 was adequately displayed but the heading
mode was not selected. The PF initiates a left turn until 325
without any FD following, detects the first lateral deviation (“heading 340, I overshot”), follows the FD, which indicates the steps to follow the FMS GA procedure (NAV mode). The aircraft heading reaches 030. The PF realises that the A/P is re-engaged and that the aircraft starts a right turn as expected in the initial trajectory.
Large deviations from the requested 2500ft also occurred in the vertical dimension:
until 3000ft for two crews
The crews acknowledge the 2500ft limit while the aircraft is at 3500. They chose two different strategies: i) altitude 3000 selected in the FCU and ask 3000 to the ATC ii) 2500 selected and execution of an open descent.
until 3900ft for a third crew
An overshooting of 1400ft that can be decomposed in three phases:
+400ft before the confirmation of the altitude with ATC +600ft with Vertical Speed +3800
+400ft due to the “aircraft inertia” Vzmax >3800ft/min, C-Chord alarm (40 secondes)
Subjective assessment
During the debriefings, crews were systematically interviewed about their priorities and difficulties encountered during the first go around. Their testimonies are not transcribed in this paper but parts of them are used in the following discussion.
Discussion
Results show that all crews performed the go-around manoeuvre at the request of the controller. The initialisation and the move of the gear up were executed in a homogeneous manner within the crews. On the other side, the execution of the manoeuvre differed depending on the strategy chosen by the crew and on their execution of the expected tasks.
Interesting measures of the pilot’s activity were extracted from eye tracker data. They reveal that the PF was mainly focused on the trajectory execution since he assimilated mostly information related to artificial horizon, speed, altitude/variometer. The assimilation of such information was achieved within a reduced space (i.e. on the PFD) and required up to 70% of the visual attention. This indicates that the task of flying the trajectory was quite exclusive for the PF. On the contrary, the PNF’s visual attention was more dispersed. The PNF mostly captured the necessary information within the out of zone, which roughly corresponds to the aircraft configuration management (gears, flaps, radio panel or overhead panel). This is coherent with the different tasks affected to the PNF: « positive climb » announcement, gear up; read back of ATC request and consideration of the constraints (selection of the heading, of the altitude values, and of the corresponding modes); monitoring the initialization of the GA; monitoring the PF actions and the FMA modes.
During debriefing, almost all PNF reported difficulties related to the management of all these actions:
6
- related to the ATC request : « I didn’t retain all
information hopefully you did» ; « a heading left but I don’t remember» ; « I couldn’t answer him»
- related to the (auditory) overload and the actions’ prioritization : "the info of colleague, at
the same time, ATC request heavy, painful". "capt requests added to the ATC demands, so much." "the management of priorities between thrust, trajectory, FMA and "ear".
- related to the impacts of overload on actions or announces to be performed : « I took time, I
delay, I did not announce the vario for the gear up » ; « I mix everything »
To cope with the peak of workload, crews reduced the demand, and/or adapted their response. Some of them chose for example to differ their consideration of the ATC modification. This led, in certain cases, to large vertical deviations.
The adaptations consisted mainly in simplifying some tasks and prioritising actions. For example, the announcement of the FMA modes was frequently omitted by pilots, whereas they previously announced them. This is a typical situation where an increase of workload can divert resources from maintaining the situation awareness. One crew, for example, erroneously believed that the heading mode was engaged whereas they were in navigation mode. A subsequent deviation occurred in their management of the horizontal trajectory (from 325° to 030° compared to the 340° requested). This kind of issues have already been largely discussed in the literature, especially by Sarter et al. (2007): “A loss of mode awareness can lead to mode errors, which occurs when a pilot performs an action appropriate for the assumed, but not the actual system state”.
Besides, the observed horizontal deviations highlight the multiplicity of information sources related to the management of the lateral trajectory:
- “to the left” requested by ATC - “340” requested by ATC - The Flight Director
- The heading information under the horizon - The trajectory monitoring indicated on the ND Under nominal situations, all these information are coherent and some are even redundant. Under critical situations, the precision and validity of these data may differ. The PF might not have the necessary resources to apprehend the various sources and the PNF’s (or even ATC’s) monitoring role is therefore crucial.
The diversity in PNF visual scan patterns and the fact that some deviations were undetected, as well as the difficulties expressed by PNF during
the debriefing confirmed that the monitoring task was not easily performed during go-around. Considerable mental effort is required to keep attention moving between the tasks. As expressed by Dismukes & al. (2001), “the most commonly [reported] category of neglected tasks is monitoring (of aircraft position or status or of actions of the pilot flying/taxiing)”.
PNF had difficulties to prioritise their attention focuses. When PF were asked about their priorities in debriefing, they are quite unanimous: « pitch, thrust, trajectory management ». PNF answers were more complex and differed as they reported: « aircraft climbing, trajectory, pitch, monitoring, thrust, announcements… ».
The CRM (Cockpit Resource Management) plays a crucial role during go around as a barrier against accidents. Firstly, the procedure relies on an effective teamwork, and particularly on the monitoring of deviations by the PNF. Secondly, previous events have shown the existence of potential attention tunneling during Go around maneuver; CRM is one of the current countermeasures against this phenomenon. However as explained in previous paragraphs, PF and PNF might have different priorities especially during the initialization. If the go around becomes not nominal, it might be difficult for them to exchange within the crew and share the same situation awareness. The CRM can fail in such demanding situations.
Conclusion
The survey emphasized potential issues when the ATC changes the published missed-approach track during the go-around manoeuvre. With the experiment, we confirm that in this case crews can be destabilised by the difference with the briefing during the approach. The consequences of these changes can be significant, particularly when they prevent the use of certain automated systems and increase the temporal pressure. In a flight phase where the workload is already high, additional actions further disrupt teamwork, and monitoring by the PNF in particular.
The results of the simulations highlight the importance of monitoring by the PNF during the go around. They also show that PNF have considerable difficulties to monitor all the parameters requested for the procedure.
The simulations show that, because of the great diversity of go-around situations, the number of changes in FMA modes during the go-around can be unexpectedly high. This makes it difficult for crew members to detect and follow all the mode changes. Thus, the robustness of go-around
7
procedures cannot be assessed based solely on the assumption that FMA mode changes have been comprehensively read and understood. The analysis of accidents or serious incidents performed in the ASAGA study showed that crews are often no longer aware of the basic parameters –pitch, thrust – and their correlation with changes in calibrated airspeed and vertical speed. Results of the simulations confirm, if need was, that performing the go-around requires a high number of actions. Crews may have difficulty in prioritizing their actions and may omit to continuously monitor these parameters.
In summary, the experiment in simulator confirms and expands on earlier findings providing from the events analysis and the safety survey.
Besides, it emphasized the potential gain obtained by using combined approaches (eye tracking data, task analysis and debriefing) and raises the question of the use of such a method for training purposes.
Acknowledgement.
The authors would like to thank the participating airlines, the pilots an d the manufacturers. The authors would like to thank the BEA for its authorization of publishing this paper. All views
and opinions in this paper are the
responsibility of the authors alone.
References
Dismukes, R. K., Young, G., & Sumwalt, R. (1998) Cockpit interruptions and distractions: Effective management requires a careful balancing act. ASRS Directline, 10. Available:
http://asrs.arc.nasa.gov/directline_issues/dl10_dis tract.htm
Kasarskis, P., Stehwien, J., Hickox, J., Aretz, A., & Wickens, C. (2001). Comparison of expert and
novice scan behaviors during VFR flight. Paper
presented at the 11th biennial meeting of the International Symposium on Aviation Psychology, Columbus, OH, USA.
Mumaw, R. J., Sarter, N. B., & Wickens, C. D. (2001). Analysis of pilots’ monitoring and
performance on an automated flight deck. Paper
presented at the 11th biennial meeting of the International Symposium on Aviation Psychology, Columbus, OH, USA.
Sarter, N., Mumaw, R., & Wickens, C. (2007). Pilot’s Monitoring Strategies and Performance on Automated Flight Decks: An Empirical Study Combining Behavioral and Eye-Tracking Data.Human Factors, 49 (3), 347-357.