To cite this document: Budinger, Valerie and Cherrier, Olivier and Morlier, Joseph and Lachaud, Frédéric Damage location method for thin composites structures - application to an aircraft door. (2013) In: AST 2013 4th International Workshop on Aircraft System Technologies, 23-24 Apr 2013, Hamburg, Germany.
Open Archive Toulouse Archive Ouverte (OATAO)
OATAO is an open access repository that collects the work of Toulouse researchers and makes it freely available over the web where possible.
This is an author-deposited version published in: http://oatao.univ-toulouse.fr/ Eprints ID: 9073
DAMAGE LOCALIZATION METHOD FOR THIN
COMPOSITE STRUCTURES
APPLICATION TO AN AIRCRAFT DOOR
V.Pommier-Budinger *1, O.Cherrier 2, J. Morlier 2, F. Lachaud 21
Université de Toulouse, ISAE DMIA
10 Avenue Edouard Belin - France 2
Université de Toulouse, ICA, ISAE DMSM
10 Avenue Edouard Belin - France
Abstract
Piezoelectric sensors are widely used for Structure Health Monitoring (SHM) technique due to their high-frequency capability. In particular, electromechanical impedance (EMI) techniques give simple and low cost solutions for detecting damage in composite structures. For example, damage indicators computed from EMI deviations between the undamaged and damaged structure can be compared to a threshold in order to provide information about damage presence.
When it is question of damage localization, the simple analysis of the EMIs fails to furnish enough information. We propose a method based both on EMI damage indicators and on the acoustic attenuation level to localize damage. One of the main advantages of our method, so called data driven method, is that only experimental data are used as inputs for our algorithms. It does not rely on any model.
1
INTRODUCTION
Structural Health Monitoring (SHM) is an emerging technology, dealing with the development and implementation of techniques and systems where monitoring, inspection and damage detection become an integral part of structures. It further merges with a variety of techniques that will provide information about the condition of a structure in terms of reliability and safety before the damage threatens the integrity of the structure [1,2]. The major advantage of SHM techniques is their online implementation and their mixed global/local approach.
Classical SHM methods use model driven data that require a high quality FE model and a damage model (delamination, crack etc…). Then the damage is identified from a metric corresponding to the distance between experimental and baseline numerical
data (FRF, natural frequencies, modeshapes etc.) [3-5]. The localization problem can then be viewed as an inverse problem often solved using optimization and model updating process [6-9] for minimizing the error between experimental and numerical data.
Our work is based on industrial needs:
• low cost instrumentation and easy connection,
• simple processing of data and reliable visualization of damage localization. To achieve the first point, smart materials are commonly used. In particular, the electromechanical impedance (EMI) based SHM techniques have several advantages such as the use of non-intrusive piezoelectric transducers, simple measurements (only voltages and currents) and potentially low-cost implementations [10-15]. For the second point, damage indicators derived from the measured EMIs provide information about damage presence [16]. However, they fail to furnish enough information for damage localization. The originality of our approach is to propose a method based both on EMI damage indicators and on the acoustic attenuation level to localize damage.
2
ELETROMECHANICAL IMPEDANCE AND ACOUSTIC ATTENUATION FOR DAMAGE DETECTION AND LOCALIZATION2.1 Principle of the method
The changes in local dynamics due to incipient structural damage affect the structure at ultrasonic frequencies. In a complex aeronautical structure like an aircraft door for example, such changes are too small to affect the global dynamics and hence cannot be readily detected by conventional low-frequency vibration methods. Experimental demonstrations have shown that the real part of the high frequency impedance spectrum is directly affected by the presence of damage in the structure [17]. The structure impedance spectrum can be measured indirectly by using piezoelectric transducers bonded on the mechanical structure under study. Indeed, piezoelectric transducers allow measuring high frequency electromechanical impedances resulting of the coupling between the transducers and the structure.
Once the impedance spectrum is measured, the issue is to analyze this spectrum to detect and localize damage. For detection, the usual method is to compute electromechanical variation indexes and to compare them to thresholds whose levels are significant of damage existence. These thresholds have to be determined experimentally for each structure under study. To detect an impact that causes locally an increase of damping and a decrease of stiffness and thus a shift of the electromechanical impedance, usual variation indexes are:
- the root mean square deviation RMSD:
(1) where is the number of samples, the real part of impedance for the undamaged structure and the real part of impedance for the damaged structure
3
- the mean frequency shift of modal peaks mean: ! "#$% &'() '(
*)& '+ (*) ,
(-.
/012 344 (2)
where 5 is the modal frequency of the undamaged structure for mode n, 5 6 the modal frequency of the damaged structure for mode n and Npksthe number of modal peaks in the studied frequency band.
For damage localization, analysing the index level is not sufficient. We propose to use, in addition to variation indexes, the acoustic wave attenuation level in materials. Acoustic attenuation is a measure of the energy loss of sound propagation in media and depends on several phenomena (diffraction, reflection, diffusion and absorption). For laminated materials and unidirectional composite materials, acoustic waves propagation is strongly dependent of fibers spacing and orientation. The technique for measuring the acoustic attenuation coefficient is to evaluate the ratio between incident and transmitted wave level with an exponential decrease of wave energy:
7+ 8 9 : (3)
so
8 9 ; <= :7+ > (4)
where m( ) is the acoustic attenuation coefficient function of the considered frequency, ? the initial level of generated signal (incident wave) and @ the received signal after propagation at distance6A (transmitted wave).
The proposed method relies on the hypothesis that the electromechanical impedance variation is all the more important as the sensor is close to the damaged zone. So the method is based on an enhanced triangulation based on EMI spectrums and variation indexes weighted by inverse distance weighting (IDW) interpolation. The method is inspired from classical IDW (Inverse Distance Weighting) interpolation for 2D Reconstruction of scatter points. IDW methods are based on the assumption that the interpolating surface should be influenced most by the nearby points and less by the more distant points.
2.2 Description of the method
The proposed method for the construction of damage localization maps can be divided in 4 steps. Steps 1 and 2 are preliminary steps that are performed once before the monitoring. Step 3 is performed continuously. Step 4 is performed only if damage is detected in step 3.
Step 1: Instrumentation
Depending on the size of structures, PZT transducers must be chosen large enough in order to give “good” EMI spectrums, that is to say with several modal peaks. They must be bonded with a rigid glue to get a good electromechanical coupling between the transducers and the structure. At least, they must also be bonded onto optimal placements that results from a trade-off between requirements for triangulation and EMI measurements.
Step 2: Map construction (meshing) using IDW for each piezoelectric transducer The structure under study is meshed. Obviously the precision of localization is directly dependent on the mesh size. Each mesh has at least the piezoelectric transducers size.
Then, for each transducer noted i, every mesh j is weighted by acoustic attenuation Aij defined by:
BCD E F GHI (5)
where xij the distance between the transducer i and the center of each mesh j. Like in IDW methods, the acoustic attenuation is such that it decreases as the distance between the transducer and each scatter point increases.
This method enables to generate weighted maps with a “physical” sense. There are as many weighted maps as transducers.
Step 3: EMI measurements and damage metrics
EMI measurements must be performed regularly for monitoring. In this paper, 2 EMI spectrums are measured for pre and post impact. Then we can obtain RMSD and ∆fmean indexes for each transducer using Equation 3 and 4. These indexes are then compared to thresholds to determine if damage occurred. If yes, a damage localization map is built using step 4 of the method.
Step 4: Damage localization map computing
The damage indicators DI are computed using IDW interpolation and by taking the inverse in order to get a high value of the indicator in the damaged zone. For each mesh j, the damage indicator based on RMSD index is computed by:
JKL MNOP Q UVWXRMNOSHI HTY X
(6)
and the damage indicator based on mean index is computed by: JKL Z'[\]( Q RZ'[\](^H SHI T U VWX Y X (7) where a is the number of transducers. For 1D structures, the number of transducers is at least two and, for 2D structures, it is at least three.
Plotting the values of a damage indicator for each mesh then gives one damage location map that enables to evaluate the damage position on the structure.
3
EXPERIMENTAL VALIDATION ON AN AIRCRAFT DOOR
STIFFENER
3.1 Structure under study
The structure under study is a composite stiffener of an aircraft door. It has the shape of an I-beam of mean dimensions 66*89*1045mm. The beam web is composed of 16 plies of carbon/epoxy plus a peel ply of tissue (it is considered that it has an isotropic behaviour). The aircraft stiffener is a part of the door that is particularly monitored during the life cycle of the aircraft. Consequently, it is of high interest to find a method for real time SHM. The proposal method has been tested in two
5
configurations: the stiffener is in laboratory conditions, alone and disassembled from the door, and in real conditions, fixed on the door.
3.2 Stiffener tested in laboratory conditions
Step 1: Instrumentation
The stiffener is instrumented for damage localization: 2 PZT piezoelectric patches type DuraAct® (PI ceramics® PIC255) of dimensions 50*30*0.5mm are glued on to the beam web near each extremity of the beam with a structural glue type 3M DP460® (Figure 1).
Figure 1 – Instrumented composite stiffener in clamped configuration in the laboratory
To test the proposed method of impact location, two positions of damage between the two transducers are investigated one after the other. Impacts (D1 and D2) are located on the flange of the beam (Figure 2a) and an example of damage is shown in Figure (2b).
(a) (b)
Figure 2: (a) positions of the impacts on the composite stiffener (b) example of typical damage
Step 2: Map construction (meshing) using IDW for each piezoelectric transducer The stiffener web is meshed in equal parts (11 meshes of 95mm length and 89mm height). Preliminary tests demonstrate that the best EMI response (i.e. with detectable peaks) is between 8 and 16 kHz for the stiffener. In the beam web, the acoustic attenuation is measured in this frequency band and the mean value of the acoustic attenuation coefficient is 40e-3 [m-1]. Then, 2 maps, one for each transducer, can be computed with IDW interpolation and plotted (Figure 3).
(a) (b)
Figure 3: Mesh of the stiffener with IDW interpolation computed by the exponential attenuation law for m=40e-3[m-1] (a) for transducer n°1 (b) for transducer n°2
Step 3: EMI measurements and variation indexes
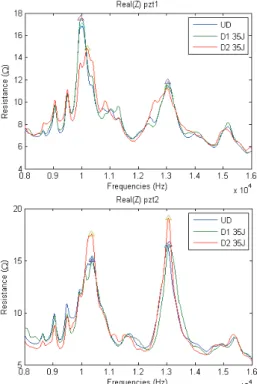
Before and after damage generation, the real parts of the electromechanical impedances are measured (Figure 4). From EMI signatures, mean and RMSD indexes are computed. The variation indexes are presented in Table 1. Classically, indexes for damage n°2 are computed while considering the state with the first damage as the undamaged state (D1 replace UD as reference in equations 1 and 2).
RMSDpzt1 (%) RMSDpzt2 (%) mean pzt1 (%) mean pzt2 (%)
Damage n°1 3.600 8.800 0.180 0.250 Damage n°2 11.100 11.200 1.210 0.190
Table 1: RMSD and mean indexes for the composite stiffener and for the two
transducers (pzt1 and pzt2)
Figure 4: Experimental EMI signatures (between 8 and 16 kHz) for the two transducers on the stiffener, for undamaged case (UD) and damaged cases after a first impact energy of 35J (D1 35J) and after a second impact energy of 35J (D2 35J)
Step 4: Damage localization map computing
Figure 5 gives the damage localization maps plotted from RMSD and fmean variation indexes by using the method proposed in section 2.
In Figures 5(a) and 5(b), the probability of damage is plotted for mean variation index. In Figures 5(c) and 5(d), the results for RMSD variation index are highlighted. For the first damage, the localization predicted by RMSD index is precise since the high probability zone indicates the real zone of impact. For the second damage, the predicted localization is less accurate. In comparison, the localization predicted by
7
(a) (b)
(c) (d)
Figure 5: Damage localization maps for the two successive impacts (real in blue circle) for mean index (a,b) for RMSD index (c,d)
3.3 Stiffener tested in real conditions
Step 1: Instrumentation
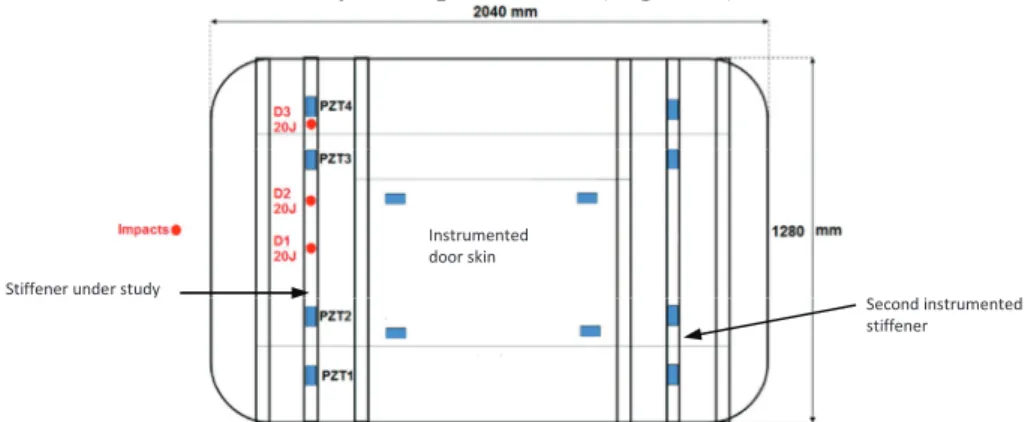
The aircraft door comprises 6 stiffeners. As the number of impact tests is limited, tests will be performed for a single stiffener but 2 stiffeners and the inside of the door skin have been instrumented, each with 4 PZT piezoelectric patches type DuraAct® of dimensions 50*30*0.5mm, in order to study the problem of false detection (Figure 6). 4 PZT piezoelectric have been bonded onto the stiffeners and not only 2 as in the previous tests because of the door ribs. Figure 6 also shows the positions of the impacts that have been realised by a drop machine (Figure 7).
Figure 6: Schema of the door with the piezoelectric patches and the positions of the impacts
Figure 7: Impact test of the door
Low probability High probability Low probability High probability
Low probability High probability Low probability High probability
Impact 1 Impact 2 Impact 1 Impact 2
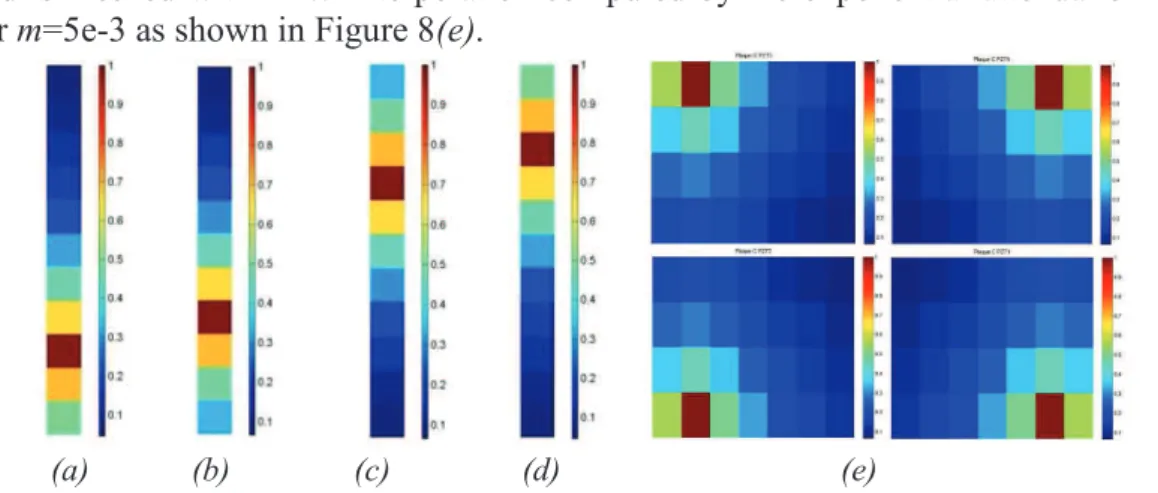
Step 2: Map construction (meshing) using IDW for each piezoelectric transducer As previously, the stiffener web is meshed in equal parts (11 meshes of 95mm length and 89mm height) and the mesh of the stiffener with IDW interpolation computed by the exponential attenuation law for m=40e-3 is given in Figure 8 for each piezoelectric transducer. For the inside of the door, the skin is considered as a plate and is meshed with IDW interpolation computed by the exponential attenuation law for m=5e-3 as shown in Figure 8(e).
(a) (b) (c) (d) (e)
Figure 8: Mesh of the stiffener with IDW interpolation
(a) for transducer n°1 (b) for transducer n°2 (c) for transducer n°3 (d) for transducer n°4 and mesh of the inside of the door with IDW interpolation for the 4 transducers (e)
Step 3: EMI measurements and variation indexes
Before and after the damage, the real part of the electromechanical impedance is measured in the bandwidth 8-16KHz. The EMI spectrums are not given here since they are quite numerous. Tables 2 and 3 give only mean and RMSD variation indexes for every piezoelectric transducer of the stiffener under study. Figure 9 summarize all the values for all transducers of the aircraft door.
RMSDpzt1 (%) RMSDpzt2 (%) RMSDpzt3 (%) RMSDpzt4 (%)
Damage n°1 3.64 3.3 2.87 7.08 Damage n°2 0.74 0.70 0.84 1.01 Damage n°3 3.55 3.13 2.79 2.72 Table 2: RMSD indexes for the composite stiffener and the four transducers
mean pzt1 (%) mean pzt2 (%) mean pzt3 (%) mean pzt4 (%)
Damage n°1 0.5109 0.2252 0.3055 0.2183 Damage n°2 0.1097 0.1219 0.0862 0.2569 Damage n°3 0.054 0.1953 0.1141 0.3006 Table 3: mean indexes for the composite stiffener and the four transducers
Step 4: Damage localization map computing
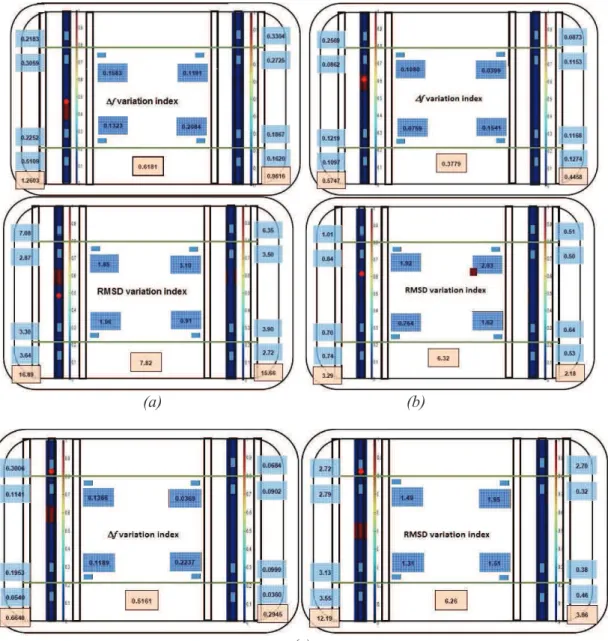
Figure 9 gives the variations indexes computed for every piezoelectric transducer of both instrumented stiffeners and of the skin. Then, for every index, the four values obtained for the transducers have been summed for every stiffener and the skin. It is assumed that the impact is more likely to have occurred on the device for which the sum of the variation indexes is the highest. With this assumption, Figure 9 gives the damage localization maps for damage D1, D2 and D3 plotted from fmean and RMSD
9
variation indexes by using the method proposed in section 2. Then, results show that both variation indexes localize the impact on the good stiffener for damage D1 and D3 and that only fmean variation index indicates the good stiffener for damage D2. Moreover, it can be observed that fmean variation index gives the position of the impact with a good precision for the first two impacts. For the third impact, the localization is not so accurate. It must be due to the presence of the rib. This result shows that, for complex structures, it may be necessary to increase the number of transducers.
(a) (b)
(c)
Figure 9: Damage localization maps for damage D1 (a), D2 (b) and D3 (c) plotted from fmean and RMSD variation indexes
4
CONCLUSIONS
The proposed method permits to detect and localize a single isolated damage in composite structures. The originality of the method is to generate a damage
localization map based on both inverse distance weighting (IDW) interpolation and indicators computed from EMI spectrums measured by piezoelectric transducers bonded onto the structures. The weights for the interpolation have a physical sense and are computed according to an exponential law of the measured attenuation of acoustic waves. One of the main advantages of our method, so called data driven method, is that only experimental data are used as inputs for our algorithms. It does not rely on any model.
5
REFERENCES
[1] Farrar C.R. and Worden K. (2007). An introduction to structural health monitoring, Philosophical Transactions of the Royal Society A, 365:303-315
[2] Doebling S.W., Farrar C.R. and Prime M.B. (1998). A Summary Review of Vibration-Based Damage Identification Methods: Identification Methods, Shock and Vibration Digest, 30:91-105 [3] Farrar C.R. and Lieven A.J. (2007). Damage prognosis: the future of structural health monitoring. Philosophical Transactions of the Royal Society A, 365:623-632
[4] Schubel P.M., Luo J.J. and Daniel I.M. (2007). Impact and post impact behaviour of composite sandwich panels, Composites Part A, 38:1051-1057
[5] Abrate S (1998). Impact on composite structures, Cambridge: Cambridge University Press
[6] Petit S., Bouvet C., Bergerot A. and Barrau J.J. (2007). Impact and compression after impact experimental study of a composite laminate with a cork thermal shield, Composites Science and Technology, 67:3286-3299
[7] Cawley P. and Adams R.D. (1979). The location of defects in structures from measurements of natural frequencies, Journal of Strain Analysis, 14(2): 49-57.
[8] Montalvão D., Maia N.M.M. and Ribeiro A.M.R. (2006). A Review of Vibration-based Structural Health Monitoring with Special Emphasis on Composite Materials, The Shock and Vibration Digest, 38(4): 295-324
[9]Shahdin A., Morlier J. and Gourinat Y. (2010). Damage monitoring in sandwich beams by modal parameter shifts: a comparative study of burst random and sine dwell vibration testing, Journal of Sound and Vibration, 3(5): 566-584.
[10] Frieden J., Cugnoni J., Botsis J. and Gmür T. (2011). Vibration-based characterization of impact induced delamination in composite plates using embedded FBG sensors and numerical modelling, Composites Part B: Engineering, 42(4): 607-613
[11] Montalvao D., Ribeiro A.M. and Duarte-Silva J. (2008). A method for the localization of damage in a CFRP plate using damping. Mechanical Systems and signal Processing, 23(6):1846-1854
[12] Morlier J., Bos F. and Castera P. (2006). Diagnosis of a portal frame using advanced signal processing of laser vibrometer data, Journal of Sound and Vibration, 297(1-2): 420–431
[13] Rucka M. and Wilde K. (2006). Application of continuous wavelet transform in vibration based damage detection method for beams and plates, Journal of Sound and Vibration, 297(3-5): 536–550 [14] Kim B.H., Kim H and Park T. (2006). Nondestructive damage evaluation of plates using the multiresolution analysis of two-dimensional Haar wavelet, Journal of Sound and Vibration, 292(1-2): 82-104
[15] Huang Y., Meyer D. and Nemat-Nesser S. (2009). Damage detection with spatially distributed 2D continuous wavelet transform, Mechanics of Materials, 41(10): 1096-1107
[16] Giurgiutiu V. and Zagrai, A. (2005). Damage detection in thin plates and aerospace structures with the electro-mechanical impedance method, Structural Health Monitoring – an International Journal, 4(9): 1025-1036
[17] Giurgiutiu V. (2008), Structural health monitoring with piezoelectric wafer active sensors, Academic Press
ACKNOWLEDGMENTS
The authors would like to acknowledge the Région Midi-Pyrénées, the DIRRECTE as well as the FEDER for the funding of this study through EPICEA 2009 program related to the project titled “SAPES COMPOSITES”. We also thank N. Boudjemaa, LATECOERE, for his insightful comments.
![Figure 3: Mesh of the stiffener with IDW interpolation computed by the exponential attenuation law for m=40e-3[m-1] (a) for transducer n°1 (b) for transducer n°2](https://thumb-eu.123doks.com/thumbv2/123doknet/3535187.103504/6.892.178.742.607.722/figure-stiffener-interpolation-computed-exponential-attenuation-transducer-transducer.webp)