To link to this article : DOI:10.1016/j.ces.2013.08.051
URL :
http://dx.doi.org/10.1016/j.ces.2013.08.051
This is an author-deposited version published in:
http://oatao.univ-toulouse.fr/
Eprints ID: 9744
To cite this version:
Flamant, Gilles and Gauthier, Daniel and Benoit, Hadrien and Sans, Jean-Louis
and Garcia, Roger and Boissière, Benjamin and Ansart, Renaud and Hemati,
Mehrdji Dense suspension of solid particles as a new heat transfer fluid for
concentrated solar thermal plants: on-sun proof of concept. (2013) Chemical
Engineering Science, vol. 102. pp. 567-576. ISSN 0009-2509
O
pen
A
rchive
T
oulouse
A
rchive
O
uverte (
OATAO
)
OATAO is an open access repository that collects the work of Toulouse researchers
and makes it freely available over the web where possible.
Any correspondence concerning this service should be sent to the repository
administrator:
[email protected]
!
Dense suspension of solid particles as a new heat transfer fluid for
concentrated solar thermal plants: On-sun proof of concept
Gilles Flamant
a,n, Daniel Gauthier
a,1, Hadrien Benoit
a,1, Jean-Louis Sans
a,1,
Roger Garcia
a,1, Benjamin Boissière
b,2, Renaud Ansart
b,2, Mehrdji Hemati
b,2aProcesses, Materials and Solar Energy laboratory, PROMES-CNRS, 7 rue du Four Solaire, 66120 Font Romeu, France bUniversité de Toulouse; INPT, UPS; LGC (UMR-CNRS 5503), 4 Allée Émile Monso BP 84234 31432 Toulouse Cedex 4, France
H I G H L I G H T S
! A new concept of solar receiver using dense particle suspensions (DPS-SR) is developed. ! The concept opens new applications for concentrated solar energy.
! DPS-SR is tested successfully at the focus of the CNRS solar furnace. ! Particle flow rate and volume fraction are controlled.
! Wall-to-particles heat transfer coefficients up to 500 W/m² K are obtained.
Keywords: Heat transfer Solar energy Fluidization Powder technology
Dense suspension of solid particles
a b s t r a c t
This paper demonstrates the capacity of dense suspensions of solid particles to transfer concentrated solar power from a tubular receiver to an energy conversion process by acting as a heat transfer fluid. Contrary to a circulating fluidized bed, the dense suspension of particles’ flows operates at low gas velocity and large solid fraction. A single-tube solar receiver was tested with 64 mm mean diameter silicon carbide particles for solar flux densities in the range 200–250 kW/m2, resulting in a solid particle
temperature increase ranging between 50 1C and 150 1C. The mean wall-to-suspension heat transfer coefficient was calculated from experimental data. It is very sensitive to the particle volume fraction of the suspension, which was varied from 26 to 35%, and to the mean particle velocity. Heat transfer coefficients ranging from 140 W/m2K to 500 W/m2K have been obtained, thus corresponding to a
400 W/m2K mean value for standard operating conditions (high solid fraction) at low temperature.
A higher heat transfer coefficient may be expected at high temperatures because the wall-to-suspension heat transfer coefficient increases drastically with temperature. The suspension has a heat capacity similar to a liquid heat transfer fluid, with no temperature limitation but the working temperature limit of the receiver tube. Suspension temperatures of up to 750 1C are expected for metallic tubes, thus opening new opportunities for high efficiency thermodynamic cycles such as supercritical steam and supercritical carbon dioxide.
1. Introduction
Concentrated solar systems may produce high temperature heat and power efficiently and firmly thanks to heat storage and hybridization. Among available technologies, solar towers, or central receiver systems, offer numerous options for producing
heat at temperatures higher than 500 1C, temperatures that are needed to power efficient Rankine thermodynamic cycles. In solar towers, sun-tracking heliostats reflect solar radiation to the top of a tower where the receiver, or solar absorber, is located. In the receiver, solar heat is transferred to a heat transfer fluid (HTF). The HTF transports the heat to the energy conversion sub-system that includes heat storage, heat exchangers, an optional burner for fuel back-up and a power block. Industrially, current HTF are steam and nitrate salts, air at atmospheric pressure and pressurized is under development. These existing HTF have drawbacks, in particular a limited working temperature domain for salt (typically 240–565 1C for binary sodium-potassium nitrate salt), very high pressure for
http://dx.doi.org/10.1016/j.ces.2013.08.051 n
Corresponding author. Tel.: þ33 468 30 77 00, þ33 468 30 77 58; fax: þ33 468 30 77 99.
E-mail address:gilles.fl[email protected] (G. Flamant). 1Tel.: þ33 468 30 77 00; fax: þ33 468 30 77 99. 2
steam and poor heat transfer capacity for air. Other prospective options, such as liquid metals, offer high flux limit on the receiver and extend operation to temperatures higher than 565 1C, as described byPacio, Wetzel (2013). But this kind of HTF is highly corrosive. Moreover, it involves safety risks which explain why there is currently no industrial application. A solution to overcome these drawbacks is using solid particles as HTF. A general diagram of the complete setup using a solid particle receiver is given in
Fig. 1. The loop is composed of a hot storage tank connected to the exit of the solar receiver, which feeds a fluid bed heat exchanger (FBHE), where the particles transmit their energy to submerged tubes inside whose working fluid (for example steam) is gener-ated, the latter is then expanded in a turbine. FBHE is indeed a classical device in the electrical power industry (mostly imple-mented for coal combustion in fluidized bed). The cooled particles exit the exchanger (continuous circulation) and are sent towards the cold storage tank; this can be done either by mechanical or pneumatic conveying or by gravity depending on the available space or on the facility geometry (tower configuration is particu-larly favourable for gravity for instance). Finally, connecting the cold bin to the solar receiver inlet by a conveying system raising the particles completes the loop. Consequently, solid particles are used as heat transfer fluid and heat storage medium. Actually, it should be noted that the proposed solar power plant is combined with a vapour cycle and steam turbine, but the system is very similar to the case of a gas turbine, the main difference being the heat exchanger, which is changed to adapt to the chosen type of turbine. In this concept the particle solar receiver is the key component. The next paragraph summarizes the state-of-the-art in the field of solar receivers using particles as HTF.
Solid particles may be used as a heat transfer fluid in solar thermal concentrating systems in direct heating and indirect heating receivers. In the former case solid particles absorb directly the concentrated solar radiation, and in the latter case a heat transfer wall is used, the wall absorbs solar radiation and transfers the heat to a flowing heat transfer medium. In particular tubular absorbers are mainly used in current solar thermal power plants. Solid particle solar receivers associated with solar tower concen-trating systems offer very interesting options for high temperature and high efficiency power cycles, thermal storage integration (using the same particles as HTF and storage medium) and chemical applications of concentrated solar energy (thermo-che-mical water splitting process to produce hydrogen, cement pro-cessing, for example).
The first studies on direct absorption solar receivers started in the early 1980s with three concepts, the fluidized bed receiver
(Flamant, 1982), the free falling particles receiver (Martin and Vitko, 1982) and the rotary kiln receiver (Bataille et al. 1989). In the first concept the solid particles are fluidized in a transparent tube but do not flow outside, there is no solid circulation. Consequently the system was used to heat air or to process reactive particles in batch operation, as indicated byFlamant et al. (1980). In the free falling particles curtain concept, the solid is dropped directly into the concentrated solar beam from the top of the receiver and is heated during the time of its pass through the concentrated radiation. Particle selection and radiative heat transfer modeling have been proposed byFalcone et al. (1985)as well asEvans et al. (1987). CNRS developed a “Sand heater loop” using sand particles as HTF (Bataille et al., 1989). It combined a solar rotary kiln that delivered hot sand to a heat storage / heat recovery sub-system consisting of a hot and a cold heat storage bin and of a multistage fluidized heat exchanger.
After about twenty years without new development, this con-cept was again proposed as a promising option for a new genera-tion of high temperature solar thermal concentrating plants. Improved models have been developed (Chen et al., 2007) and validated by on-sun experiments at pilot scale (Siegel et al., 2010). The receiver prototype was tested at the National Solar Thermal Test Facility (NSTTF) in Albuquerque NM, USA. The cavity receiver was 6.3 m in height by 1.85 m in width and 1.5 m in depth with a 3 m high and 1.5 m wide aperture. Selected particles were alumi-nosilicate containing 7% of Fe2O3(marketed as CARBO HSP 20/40)
with 697 mm mean diameter. Batch runs were performed from 3 min to about 7 min (for a total particle inventory of about 1800 kg). Measured temperature increase (from ambient tempera-ture) during experiments was ranged from 100 1C to about 250 1C for a single pass and solar power in the range 1.58–2.5 MWth. The receiver efficiency increased generally with the particle flow rate and varied from about 35% to 52%, thus in good agreement with simulated data. A review of the falling particle receiver was proposed byTan and Chen (2010) with emphasize on the effect of wind speed on receiver performances. Particle aerodynamics in this type of receiver is affected by the wind and various parasitic air flows inside the cavity induced by the particles’ falling and convection due to temperature difference, as well as by air jet flow if an aerowindow (Tan et al., 2008) is used. These effects may be partially avoided by using the face-down solid particle receiver concept ofRöger et al. (2011)in which the particle curtain lines the inner wall of a cylinder closed at its top; the bottom part facing the concentrated solar beam. In this study, a circa 350 MWth receiver placed at the top of a 309 m high tower surrounded by a heliostat field was modeled. It was shown that solid recirculation improves drastically the receiver efficiency from 79% to 90% at full load and from 45% to 86% at 50% load. Concerning the comparison of a solid particle solar power plant with other more standard options, the study ofGiuliano et al. (2011)gives interesting conclusions for solar-hybrid operation. It is clearly shown that none of the analysed solar-hybrid plants can meet low CO2emission and low
LEC (Levelized Electricity Cost). For example a particle-receiver tower with a combined cycle has the lowest solar LEC (about 10 c €/kWh) but high specific CO2emission (high fossil fuel consump-tion). Moreover, one of the main conclusions is that solar-hybrid plants have a high potential to reduce CO2emission with high storage
capacities (large solar fields). In solar power plants using solid particle receiver, storage may be achieved using the same particles as the HTF (similarly to molten salt solar plants). Heat recovery from the hot storage is then possible using fluidized bed heat exchangers as described byWarerkar et al. (2011), or particle-air heat exchangers tested byAl-Ansary et al. (2012)in which particles flow through. In this last study storage bins are integrated at the top of the tower.
Direct absorption systems using particles are very attractive because no window is necessary and they accept very high solar
Fig. 1. Schematic view of a thermal CSP plant with a receiver using particles as HTF.
flux density (of the order of 1 MW/m2), but from the engineering point of view, particle flow stability is difficult to control and convection losses may be high. Indirect absorption solid particle receivers tolerate lower flux density (in the range 200–400 kW/m2)
but they offer a better control of particle circulation within the receiver and a possible management of operating pressure and atmosphere composition. Various options are possible, for example,
Badie et al. (1980)studied an annular fluidized bed reactor,Lédé et al. (1986)considered a cyclone reactor for biomass conversion.
One of the main issues for high power solar concentrating system using particles as HTF is the particle mass flow rate that may be flowed inside the solar receiver. In industry, circulating fluidized bed is well-developed at large scale in oil refineries and in combustion plants. For example, in FCC (Fluid Catalytic Crack-ing) process in petroleum refineries, solid catalytic flow rate as high as 2000 t/h is typical in a single reactor. Generally, the reactor (riser) operates at high gas velocity (several m/s) and dilute solid-gas flows (solid fraction less than 5%) in such systems. Conse-quently, circulating fluidized bed requires high mechanical energy consumption for compression while the high velocity and low solid fraction lead to a poor wall-to-particles heat transfer coeffi-cient. Moreover, the particles’ high velocities provoke tube erosion and solid particle attrition. Plug-flow pneumatic conveying over-comes these two latter inconveniences, since it allows transporting solid at lower velocities but higher average volume fraction, as shown byWatson et al. (2012). However, this regime is mainly characterized by the alternation between solid plugs with a voidage close to that of a settled bed and voids with almost no solid, which is not an appropriate configuration for efficient heat transfer. The dense phase fluidized bed can be used in FCC standpipes to provide an important and steady downward flow of solid as shown byBodin et al. (2002). In this regime, the suspension is uniform, it has a low voidage that induces high wall-to-particles heat transfer coefficient, and it
circulates slowly (a few cm/s), thus limiting the energy consumption and permits its use as HTF.
We have proposed a new concept; it uses a dense suspension of small size solid particles and was patented byFlamant and Hemati (2010)This innovation is currently developed in the frame of both a National and a European project (FP7 EC project CSP2,http://www. csp2-project.eu). The dense suspension of particles receiver (DSPR) consists in creating the upward circulation of a dense suspension of particles (solid fraction in the range 30–40%) in vertical absorbing tubes submitted to concentrated solar energy. The suspension acts as a heat transfer fluid with a heat capacity similar to a liquid HTF but with no temperature limitation but the working temperature limit of the receiver tube. Suspension temperatures up to 750 1C are expected for metallic tubes, thus opening new opportunities for high efficiency thermodynamic cycles such as supercritical steam and carbon dioxide on whichPitz-Paal et al. (2012)worked.
This paper presents experimental results that were obtained during on-sun testing with CNRS solar facility of a single tube DSPR at low temperature (outlet temperature less than 300 1C). After explaining the system principle, the experimental setup and operating conditions are presented. Experimental test results dealing with temperature distribution and elevation during experiments are presented, and then wall-to-suspension heat transfer coefficients are derived and analysed as a function of the system pertinent parameters. Finally, a comparison with existing technology and future applications are discussed.
2. Experimental setup and procedure 2.1. Description of the experimental pilot plant
The general principle of the solar rig using a DSP as the heat transfer fluid and that was set at the focus of the CNRS 1 MW solar
Solid flow S o lid f lo w S o lid flo w Aeration
42.4 mm
139.7mm
4
mm
Fig. 2. (a) Schematic view of the solar loop: ①solar absorber metallic tube, ② particle suspension dispenser, ③ receiving fluidized bed, ④ suspension return; (b) view of the particle suspension dispenser.
furnace is schemed inFig. 2a. In this lab-scale experimental setup, the solar absorber is a single opaque metallic tube ① that is located inside a cylindrical cavity dug in a receiver made of alkaline-earth silicate (Insulfraxs), and submitted to the
concen-trated solar radiation. The receiver average wall thickness is 0.28 m, the cavity is 0.20 m in diameter, and it is irradiated through a 0.10 m # 0.50 m slot set at the focus plane, with aperture angle 1261. The whole experimental setup is set behind a water-cooled aluminum shield that protects both personnel and equip-ment from high solar flux when running solar experiequip-ments.
The DSP is composed of about 30–40% of particles and 70–60% of air, it moves upward vertically in the tube constituting the solar absorber by the pressure difference imposed between the particle suspension dispenser (② at the tube bottom, shown inFig. 2b) and the receiving fluidized bed (③ at the tube top). This 42.4 mm o.d. AISI 310S stainless steel tube (wall thickness 3.2 mm) is submitted to the concentrated solar radiation.
The absorbing tube is connected to the rest of the setup by steel expansion joints set at its two ends, for absorbing both thermal expansion and possible vibrations induced by fluidization. The radiation absorbed by the 1 m-long tube is transmitted to the suspension whose temperature increases through contact with the tube walls.
The AISI 304L stainless steel complete facility involves in total 3 fluidized beds (o.d. 139.7 mm, thickness 2 mm) that permit the system to be homogeneous and ensure the suspension upward flow in the irradiated tube and its recirculation, while avoiding any gas bypass or counter-current circulation. All 3 fluidized beds include a fluidization distributor made of sintered stainless steel thus allowing both mechanical strength and good pressure drop whilst withstanding high temperature. The height of the bottom fluidized bed, working as the solar absorber feeder (particle suspension dispenser), is controlled by the distance between the lower part of the tube and the distributor (0.20 m), and the 0.105 m height of the upper fluidized bed (receiving fluidized bed) is controlled by the height of the tube for solid outlet. The level of the suspension return ④ is controlled by the gas pressure equilibrium related to the levels of the two other fluidized beds and the solid inventory circulating inside the loop. The heights of the upper fluidized bed and of the suspension return are such that they can be suspended on a horizontal metallic frame for thermal expansion of the absorber tube.
2.2. Powder characteristics
The solid circulating in the suspension is silicon carbide, used mainly because of its thermal properties (high sintering tempera-ture, high heat capacity), availability and rather low cost. The chosen particles’ mean diameter (Sauter mean diameter: d32¼63.9 mm) permits a good fluidization quality with almost no
bubbles, for very low air fluidization velocities (Umf¼5 mm/s at 20 1C) since they belong to Group A of particles as defined by
Geldart (1973).Table 1lists the physical properties of the solid.
ρ
is the density, T the temperature,ε
the suspension voidage, U the velocity, the subscript ‘p’refers to particles or solid, ‘mf’ to mini-mum fluidization and ‘mb’ to minimini-mum bubbling.2.3. Temperature and pressure sensors
The air and solid temperatures are measured at a selection of places along the suspension path in the rig by twelve sheathed K thermocouples, including 2 at the inlet and 2 at the outlet (distance 0. 5 m) of the high flux exposed part of the absorber tube. The gas and particles in the suspension are assumed to be at the same temperature by similarity with the behaviour of fluid beds. The wall temperature of the absorber tube is measured at the lower part of the receiver cavity, at the tube centre, and at the upper part of the cavity, by 2–3 K thermocouples in each location. These thermocouples are made by welding directly on the tube both Chromels and Alumels bare wires; that is to say the hot junction is identical to the tube metal thus guaranteeing a very good wall temperature measurement. Two more K thermocouples measure the suspension temperature downstream, outside the insulation. Finally, several other K thermocouples are set inside the solar receiver insulation, for developing thermal balances and for controlling the solar absorber behaviour. A mass flow-meter measures the air mass-flow rate entering each fluidized bed, and another one measures the air flow rate possibly injected at the bottom of the absorber tube, to help the DSP upward flow in some cases. The facility is also equipped with 6 piezo-resistive pressure sensors and 4 differential pressure sensors, to measure continu-ously the pressure drops of all three fluidized beds and the pressures before their distributors and in their disengaging heights, and the pressure drop of the DSP inside the absorber tube. In the first series of experiments, the rig was operated in batch, and the solid flow rate was then measured by weighing continuously the mass of the solid collected at the outlet of the receiving fluidized bed.
2.4. Solid flow control
The SiC powder is fluidized in a bubbling regime. The bubbles create agitation which is favourable to the heat transfer. The method to make the DSP circulate is detailed here.
The freeboard pressure of the particle suspension dispenser Pchamber is regulated by a valve located at the gas outlet. The
pressure at the base of the tube Pbase is equal to the sum of
the freeboard pressure and the hydrostatic pressure of the bed between the freeboard and the tube base
Δ
Pbed.Pbase¼ Pchamberþ
Δ
Pbed ð1ÞThe vertical tube outlet is at atmospheric pressure Patm. The
flow driving pressure
Δ
Pmotor is the difference between thepressure at the inlet and outlet of the tube.
Δ
Pmotor¼ Pbase'Patm ð2ÞThe pressure drop through the tube
Δ
Ptubeis considered equalto the hydrostatic pressure of the suspension. It supposes that there is no pressure loss due to friction with the wall. With
ρ
gthegas density,
ρ
pthe solid density, g the gravitational acceleration,htubethe suspension level in the tube, hbasethe height of the tube
base,
ε
the suspension voidage andα
p¼1'ε
the particle volumefraction,
Δ
Ptubeis given by the formula:Δ
Ptube¼ ðα
pρ
pþερ
gÞgðhtube'hbaseÞ ð3ÞTable 1
Physical properties of SiC particles.
ρp[kg/m3] ρpCp,p(250 1C) [kJ/m3K] Tsintering[1C] λ[W/m K] εmb εmf Umf[10' 3m s' 1] Umb[10' 3m s' 1] d32[μm]
To maintain the pressure equilibrium between
Δ
Pmotor andΔ
Ptube, htube increases when Pchamber increases. WhenΔ
Ptubebecomes equal to
Δ
Pmotor, the level stabilizes. A continuous flowis established by setting the regulation valve so that
Δ
Pmotorishigher than the
Δ
Ptube obtained when the suspension levelreaches the tube outlet. The flow rate increases with the pressure difference
Δ
Pmotor–Δ
Ptube.It is necessary to inject a secondary gas flow into the tube, the aeration, at a short distance from its bottom. It helps stabilize the solid flow that would otherwise be blocked by the suspension subsidence. Moreover it allows controlling of the suspension voidage inside the tube. By injecting a gas flow rate higher than the minimum required for stabilization, the suspension voidage is increased since more gas means more space needed for its circulation. Increasing the voidage has the consequence of low-ering the suspension density which will bring, if the freeboard pressure is kept constant, an increase of the solid mass-flow rate. In a practical way, the solid flow is controlled by two para-meters: the freeboard pressure of the particle suspension dispen-ser Pchamberand the aeration flow rate. A pressure increase induces
a solid mass-flow rate increase, while the suspension voidage remains unchanged, and increasing the aeration flow rate decreases the suspension density while increasing the solid mass-flow rate.
3. Analysis
3.1. Heat transfer coefficient calculation
The determination of the heat transfer coefficient h is detailed below. It includes the calculation of the various parameters affecting h.
As mentioned inSection 2, the solid mass-flow rate was known by continuously weighing the mass of solid exiting the system. The time t was noted every time a new
Δ
m¼0.5 kg of solid had exited the system. Depending on the mass-flow rate imposed on the system, the time intervalΔ
t between two measures varied from 20 to 66 s. For each time interval, the mean solid mass-flow rate Fpwas calculated:
Fp¼
Δ
Δ
mt ð4ÞThe time period between two data point for the thermocouples was first set to 0.5 s, but the acquisition was disturbed by parasitic signals, so it was changed to 5 s. The mass-flow rate was inter-polated linearly to match the greater number of temperature data points.
In the field of fluidized beds, the flow rates are usually expressed as superficial flow rates, defined as the mass-flow rate divided by the bed cross-section area. In our case, with S the tube cross-section area, the solid superficial mass-flow rate Gp
going up the tube is:
Gp¼FSp ð5Þ
The air heat capacity is negligible in comparison to that of the solid Cp,p. The Cp,pvalues we used are those indicated byMunro
(1997) in the NIST database, interpolated in the form of a third degree polynomial equation depending on Tpthe solid
tempera-ture: Cp,p(Tp)¼a.Tp3þb.Tp2þc.Tpþd, with Tp in K and a¼2.25 #
10' 7J/kg K4, b¼ '9.88 # 10'3J/kg K3, c¼1.62 # 10'7J/kg K2,
d¼320 J/kg K, in the temperature range 293–1773 K. The mean Cp,pwas approximated as the Cp,pat the mean solid temperature. In
the explored temperature range, this approximation is verified with a 0.1% difference. Therefore, with Tp,i/othe solid temperature
at the inlet/outlet and Fp the solid mass-flow rate, the power
transmitted to the suspension inside the receiver tube is:
Φ
¼ Fp Z Tp;o Tp;i Cp;pdT ( Fp:Cp;p Tp;iþT2 p;o " # ðTp;o'Tp;iÞs ð6Þ The wall internal temperature Twint was calculated from thewall external temperature Twext, the steel conductivity
λ
, the heatflux
Φ
and the geometric characteristics of the tube (Dint/ext theinternal/external diameter, Lexposed the length exposed to solar
radiation). Without data on the distribution of the heat flux passing through the tube wall, it was considered to be uniform on all the tube. The resulting formula is:
Tint w ¼ Textw '2
Π
:λ
Φ
:L exposedln Dext Dint " # ð7Þ The typical temperature profiles along the tube for the external wall and the solid are shown in Fig. 3. They resemble the temperature profiles of a heat exchanger, with the suspension temperature monotonically increasing from bottom to top, and the tube wall temperature monotonically decreasing from top to bottom. For this reason, we thought it would be more appropriate for the determination of the heat transfer coefficient, to consider a logarithmic-mean temperature difference (Δ
Tlm) rather than adifference between the mean temperatures of the wall and the solid. However, the calculations with the two methods were made. It gave similar tendencies with values 8% lower in average for the method using mean temperatures. The
Δ
Tlm is calculated fromthe solid temperature Tpand the internal wall temperature Twintat
the inlet/outlet of the receiver cavity (subscript i/o):
Δ
Tlm¼Tint
w;i'Tp;i
$ %
' Tintw;o'Tp;o
$ %
ln Tintw;i'Tp;i
Tint
w;o'Tp;o
" # ð8Þ
With A the internal surface area of the tube receiver, the heat transfer coefficient h is then deduced from the formula
Φ
¼ h:A:Δ
Tlm ð9ÞA parameter that is essential in the study of fluidized beds is the particle volume fraction
α
p. It represents the fraction of spaceoccupied by the solid particles, while the suspension voidage
ε
represents the fraction of space occupied by the gas. These two parameters set the suspension density. As was said inSection 2.4, the pressure drop through the bed is considered equal to the suspension hydrostatic pressure. Therefore the pressure drop mea-surement will allow the calculation of the suspension density,0 25 50 150 200 250 300 350
Height(cm)
T(°C)
T
w extT
pFig. 3. Temperature profile of the external wall and solid along the tube (operating conditions: average solid superficial mass-flow rate¼16.65 kg/m² s; aeration¼ 0.065 sm3
from which will be deduced
α
p andε
. A differential pressuresensor is set on the tube with one pressure plug placed just above the particle suspension dispenser, and the second one placed above the receiver cavity. Both plugs are immersed in the suspen-sion.
Δ
P is the pressure difference measured and L the distance between the pressure plugs. By neglecting the density of the air with respect to that of the silicon carbide,α
p andε
canbe determined from the following equation, which comes from Eq.(3)with
Δ
P and L replacingΔ
Ptubeand (htube–hbase):α
p¼ 1'ε
¼ρ
Δ
Pp:g:L ð10Þ
3.2. Measurement uncertainty
The measurement uncertainties were calculated from the measuring instruments’ precision.
In the determination of the solid mass-flow rate, see formula (4), an uncertainty of 7 1 s was considered on the value of the time t, giving a 72 s uncertainty on the time interval
Δ
t taken by the massΔ
m to exit the system. With no uncertainty onΔ
m, the relative error on Fp, which is the same as the relative error on Gp, isgiven by the relation
Δ
Fp Fp ¼Δ
Gp Gp ¼Δ
ðΔ
tÞΔ
t ð11ÞThe heat flux
Φ
transmitted to the suspension is calculated with the formula (6). Therefore, the error onΦ
depends on the error on Fp, the errors on Tpat the inlet/outlet (subscript i/o) of thereceiver tube and the errors on Cp,p. The thermocouples used for
measuring Tp have an uncertainty of 71.5 K in the explored
temperature range. The relative error on the value of Cp,p taken
from the NIST database is 5%. By the transmission of errors, the following formula giving the relative error on
Φ
was deduced:ΔΦ
Φ
¼Δ
Fp Fp þΔ
Cp;p Cp;p þΔ
Tp Tp;i þΔ
Tp Tp;o ð12ÞThe
Δ
Tlmis calculated with the formula (8), therefore its errordepends on the error on Tp and Twint. The latter, as shown in
formula (7), was calculated from Twextand
Φ
. The thermocouplesused for measuring Twext have an uncertainty of 75 K in the
explored temperature range. In comparison to this value, the error on
Φ
transmitted by the calculation was neglected so the error considered on Twint is also 75 K. With Xi/o¼Tintw,i/o – Tp,i/o, therelative error on the
Δ
Tlmis given by the formulaΔ
ðΔ
TlmÞΔ
Tlm ¼ ðΔ
Tintw;iþ
Δ
Tp;iÞ lnðX&& i=XoÞ'ðXi'Xo=XiÞ & & lnðXi=XoÞðXi'XoÞþð
Δ
T intw;oþ
Δ
Tp;oÞ lnðX& i=XoÞ'ðXi'Xo=XoÞ && &
lnðXi=XoÞðXi'XoÞ ð13Þ From the formula (9) and the fact that A is known without uncertainty, the relative error on h is deduced. Its values are comprised between 17 and 25%.
Δ
h h ¼ΔΦ
Φ
þΔ
ðΔ
TlmÞΔ
Tlm ð14ÞThe particle volume fraction
α
pis calculated with the formula(10), therefore its error depends on the error on the pressure difference
Δ
P. The differential pressure sensor used has an uncertainty of 7200 Pa in the explored pressure range. The relative error onα
pis given by the formulaΔα
pα
p ¼Δ
ðΔ
PÞΔ
P ð15Þ3.3. Time averages, standard deviation and confidence intervals During the experiments, the solid mass-flow rate was not perfectly regular but presented periods of stable flow interrupted by transition periods when the regulation settings were changed. The data was averaged over the stable time periods whose durations ranged from 35 s to 400 s. For each averaged data X, the resulting standard deviation sX was calculated. With n the
number of data points comprised in the time period and X the averaged value, the formula giving sXis
sX¼ ffiffiffiffiffiffiffiffiffiffiffiffiffiffiffiffiffiffiffiffiffiffiffiffiffiffiffiffiffiffiffiffi 1 n'1∑ n 1ðXi'XÞ 2 s ð16Þ The smallest number of points for one time period is 8 and the largest is 425. By applying Student’s t-distribution, the confidence interval with a 95% confidence level was determined. It is the interval having a 95% probability of containing X and whose endpoints are X 7 t0:025;n'1ðsx=pffiffiffin
Þ, where t0.025, n '1is determined
using a t-distribution table. The resulting confidence interval on the heat transfer coefficient has a maximum half-width that corresponds to 9.4% of the value of h.
4. Results
4.1. Time-dependant values
The system testing was carried out under various ranges of the operating parameters, which are the solid superficial mass-flow rate Gp, the aeration at the base of the tube, and the solar flux
density at the receiver entrance. Since the system is operated in batch, the solid mass-flow rate determines the duration of each experiment, which ranged between 20 and 40 min. The slip velocity between the gas and solid at the tube inlet is close to the minimum fluidization velocity, regardless of the operating conditions. This was put into evidence by a helium tracking technique set on a cold mock-up (Boissière et al., 2012). Since the solid mass-flow rate is known, the gas superficial velocity at the tube inlet can be obtained. The solar flux density was measured at the receiver entrance and not on the absorbing tube. Actually its variations were not sufficient to change significantly the results.Table 2summarizes the considered ranges of operating parameters. The homogeneity of solar flux density along the tube was checked experimentally, the variations were in the range 715%.
Logically, the various operating parameters’ values influenced the solid temperature at the inlet and at the outlet of the irradiated cavity (Tp,iand Tp,o), the wall temperature at the inlet,
in the middle and at the outlet of the irradiated cavity (Tw,i, Tw,m
and Tw,o), the pressure drop along the tube (
Δ
P/L), the particlevolume fraction
α
pand the power transmitted to the suspension(
Φ
).Table 3lists the ranges of experimental results.Let us now focus on the temperatures measured at different locations on the absorber tube. As detailed earlier, the tube wall outside temperature was measured by several K thermocouples soldered onto the rear of the tube.Fig. 4displays the values given by the 3 thermocouples set at the middle height of the tube
Table 2
Ranges of operating parameters.
Gp[kg m' 2s' 1] Ugtube inlet [10' 3m s' 1]
Aeration
[sm3s' 1m' 2] Solar flux density[kW m' 2] 7.4–24.6 8.8–13.2 0.011–0.109 200–245
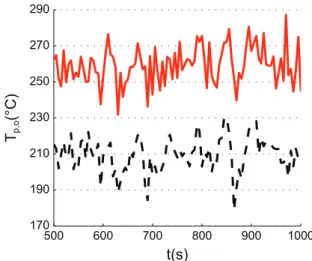
(both sides and the rear). There exists a significant temperature difference between their indications, similarly to the differences measured at the lower and upper parts of the tube inside the cavity. In Fig. 5, two sheathed thermocouples set downstream from the receiver cavity, one placed at 5 mm from the wall, the other at the centre of the tube, also show differences in the solid outlet temperatures. The same phenomenon was noticed at the cavity inlet. However, this suspension heterogeneity disappeared after exiting the sun-irradiated cavity. For the determination of the heat transfer coefficient, the temperature values used were the averages of all the measurements made at one position.
Fig. 6displays the temporal profile of the solid temperature at the inlet and outlet of the irradiated cavity, and their difference. This plot is interesting because it gives an idea of the system response time to changes in irradiation or circulation conditions. First, there is no solid circulation. The suspension level in the tube is stabilized. The initial time t¼0 s is the moment when the receiver cavity irradiation starts. During the first 4 min, the system heats up. Then at t¼240 s, the valve pressure setting is increased and
the solid begins to circulate. Therefore, a temperature difference is established between the inlet and the outlet. It takes approximately 3 min to stabilize the temperature difference around 65 1C. In our experiments, the system was able to pass from the cold static state (no solid circulation, no solar irradiation) to a stable operating state in about 6 min. While in operation, it takes less than 30 s to go from a stable state to another one when changing the settings. It can be said that this system has a short reaction time. This will prove very useful when operating a solar power plant using this concept because a constant outlet temperature is needed, which implies that the flow-rate has to be adapted to the solar irradiation variations.
Fig. 7plots the heat transfer coefficient h as a function of the solid superficial mass-flow rate Gp, for a typical experimental
run. The error bars associated with experimental data are also shown. The areas with more points are located around the solid superficial mass-flow rates we aimed to obtain. The plot shows that increasing the solid superficial velocity, while keeping the aeration constant, has a beneficial effect on the heat transfer coefficient. The linear interpolation of the heat transfer coefficient, for a solid superficial mass-flow rate comprised between 10 and 25 kg/m² s, gives the relation h ¼a. Gp- b, with a¼22.1 J/kg K and
b¼32.4 W/m² K.
4.2. Time-averaged values
As explained inSection 3.3, the data were averaged over time. The resulting average heat transfer coefficient values and their associated confidence intervals with a 95% confidence level are shown inFig. 9as a function of the average solid superficial mass-flow rate. This figure displays the whole set of experimental results for the operating parameters listed inTable 2.
As explained in 2.4 the solid mass-flow rate is affected by two parameters. Whereas the freeboard pressure impacts the solid mass-flow rate only, the aeration also changes the suspension voidage. Since a range of aeration flow rates was browsed during the experiments, the points represented inFig. 8 correspond to various voidage values. Therefore, for a given solid mass-flow rate, different heat transfer coefficient values can be obtained, since it is influenced by the voidage. The influence of the aeration on the average particle volume fraction is shown in Fig. 9. The same
Table 3
Ranges of experimental results.
Tp,i[1C] Tp,o[1C] Tw,i[1C] Tw,m[1C] Tw,o[1C] ΔP/L [Pa/m] αp Φ [W]
41–248 164–317 144–344 204–378 229–379 8500–11200 0.26–0.34 443–2724 500 600 700 800 900 1000 280 300 320 340 360
t(s)
T
w,m ext(°C)
Fig. 4. Wall external temperatures in the middle of the tube (left……, back ____, right ——). 500 600 700 800 900 1000 170 190 210 230 250 270 290
t(s)
T
p,o(°C)
Fig. 5. Solid temperatures at the outlet of the receiver cavity (5 mm from the wall ——, centre of the tube____).
0 200 400 600 800 1000 0 50 100 150 200 250 300
t(s)
T(°C)
Tp,i Tp,o ∆TpFig. 6. Solid temperature as a function of time in the irradiated cavity (operating conditions: average solid superficial mass-flow rate¼12.28 kg/m2
s; aeration¼ 0.109 sm3
aeration gives different values of the particle volume fraction because of the temperature variations. In spite of this uncontrolled influence, it is confirmed that increasing the aeration lowers the solid volume fraction.
The power transferred to the suspension can be defined in two different ways: as a function of the heat transfer coefficient and the
Δ
Tlm, or as a function of the solid mass-flow rate andtemperatures. The solid mass-flow rate itself depends on the particle volume fraction
α
pand on their vertical velocity Upwhichis directly linked to
τ
, the particle passage time inside the part ofthe tube exposed to solar radiations, defined as the ratio
τ
¼ Lexposed/ Up. This allows one to writeh:
Δ
Tlm¼ρ
p:r 2 :α
p: 1τ
:Cp;p Tp;iþTp;o 2 " # ðTp;o'Tp;iÞ ¼2:Lρ
p:r exposed:α
p:Up;z:Cp;p Tp;iþTp;o 2 " # ðTp;o'Tp;iÞ ð17Þ where r is the tube radius, Lexposedthe length of the irradiated partof the tube and
ρ
pthe particle density.Consequently, the influence of these pertinent parameters was studied.Figs. 10 and11show the variations of the heat transfer coefficient as a function of the particle average passage time and as a function of their average vertical velocity, respectively, for three ranges of particles volume fraction (same set of experimental results but two representations). The ranges of particle volume fraction are: 0.26o
α
po0.29 (low range), 0.29 oα
po0.32 (inter-mediate range), 0.32 oα
po0.35 (high range). The lowest heat transfer coefficient is 106 W m'2K' 1. It was obtained for thelow range of solid volume fraction, at a mean particle vertical velocity of 9.1 mm s' 1, corresponding to a 7.4 kg m' 2s' 1solid
superficial mass-flow rate. The highest heat transfer coefficient is 536 W m' 2K'1. It was obtained for the high range of solid
volume fraction, at mean particle vertical velocity 23.4 mm s' 1,
corresponding to a 24.6 kg m' 2s' 1 solid superficial mass-flow
rate. The faster the particles move, the higher the heat transfer coefficient; this comes directly from the much higher particle exchange between the wall and the tube centre obtained when the particles circulate faster. As a last comment, it should be noted on the plot that the higher the range of particle volume fraction, the higher the heat transfer coefficient.
Fig. 12 features the average heat transfer coefficient as a function of the average particle volume fraction, for three ranges of average particle passage time in the solar irradiated part of the tube. The ranges are: 23 so
τ
o30 s (short time range), 31 soτ
o36 s (intermediate time range), 39 soτ
o48 s (long time range). The lowest heat transfer coefficient is 145 W m'2K' 1.It was obtained for the long passage time range, at 0.271 mean particle volume fraction, corresponding to a 9.8 kg.m' 2s'1 solid
superficial mass-flow rate. The highest heat transfer coefficient is 505 W m' 2K'1. It was obtained for the short passage time range,
at 0.343 mean particle volume fraction, corresponding to a 23.2 kg m' 2s' 1solid superficial mass-flow rate. The higher the
particle volume fraction, the higher the heat transfer coefficient; the reason is that the contact area between the particles and the tube internal surface is greater when the particles occupy a greater volume fraction. The observed trends agree with the heat transfer mechanism of the “packet” model, described byMickley et al. (1961), which predicts an increase of the heat coefficient
8 10 12 14 16 18 20 22 24 26 28 0 100 200 300 400 500 600 700 Gp (kg/m2.s) h (W/m 2.K)
Fig. 7. Heat transfer coefficient as a function of the solid superficial mass-flow rate (operating conditions: aeration¼0.044 sm3/m² s; Solar flux¼210 kW m' 2).
5 10 15 20 25 30 0 100 200 300 400 500 600 Gp (kg/m2.s) h (W/m 2.K)
Fig. 8. Average heat transfer coefficient as a function of the average solid super-ficial mass-flow rate with confidence intervals at a 95% confidence level.
0 20 40 60 80 100 120 0.25 0.26 0.27 0.28 0.29 0.3 0.31 0.32 0.33 0.34 0.35
Aeration(10
−3sm
3/m
2.s)
α
pproportional to (
α
p.Cp,p.ρ
p.λ
e/τ
)1/2, whereλ
e is the equivalentthermal conductivity of the suspension.
5. Discussion and conclusion
The aim of the study was to run a first series of on-sun experiments involving a new type of solar receiver that uses a dense suspension of solid particles (DSP) circulating upward in an opaque tube exposed to the concentrated solar flux.
Contrary to circulating fluidized beds (CFB), DSP flows operate at low gas velocity and large solid fraction. Typical air velocity and mean solid fraction in CFB are respectively 10 m/s and less than 5% respectively; these values are typically 10 mm/s and 35% in DSP.
It was shown that this innovative process leads to heat transfer coefficients up to 500 W/m² K in the considered conditions, with particle mean velocities always less than 2.5 cm/s. We found that the particle velocity and the particle volume fraction are the main parameters influencing the heat transfer coefficient. The higher the particle velocity, the higher the heat transfer coefficient, because the particle agitation increases, thus improving the particle movement and the exchange between the wall and the tube centre. In addition, the higher the particle volume fraction, the higher the heat transfer coefficient, since when particles
occupy a greater volume, the contact area with the tube wall is larger.
The mean heat transfer coefficient obtained at low temperature (about 250 1C) being about 400 W/m2K, a higher heat transfer
coefficient can be expected at 700 1C and more so becauseFlamant and Ménigault (1987)have shown previously a large increase of wall-to-fluidized bed heat transfer coefficients with temperature. At this moment, only general trends can be drawn to compare DSP and molten salts that is the more developed HTF technique in central receiver solar power plants. DSP thermal capacity (
ρ
Cp) isabout half that of molten salts, and, accounting for the measured heat transfer coefficient for DSP, the flux limit that can stand the receiver is estimated in the range 300–400 kW/m2, that-is-to say
1/3 to 1/4 of the flux limit for molten salt receivers. But DSP extends drastically the operating temperature range of solar heat transfer fluids, currently limited to about 560 1C, do not suffer the freezing point problem, are harmless and their cost is low. More-over, DSP keep both advantages of being a HTF and a storage medium. Suspension temperatures up to 750 1C are expected for metallic tubes, thus opening new opportunities for high efficiency thermodynamic cycles such as supercritical steam and super-critical carbon dioxide. Using ceramic tubes may extend the operating temperature up to more than 1000 1C, i.e. Brayton and combined cycles. 8 10 12 14 16 18 20 22 24 26 28 100 200 300 400 500 600 Up (10−3m/s) h (W/m 2.K)
Fig. 11. Average heat transfer coefficient as a function of the average particle vertical velocity.
0.26 0.27 0.28 0.29 0.3 0.31 0.32 0.33 0.34 0.35 100 200 300 400 500 600 αp h (W/m 2.K)
Fig. 12. Average heat transfer coefficient as a function of the average particle volume fraction.
15 20 25 30 35 40 45 50 55 100 200 300 400 500 600 τ (s) h (W/m 2.K)
In fact, DSP appear to open a new domain of applications of concentrated solar energy compared to existing technologies. Indeed, such a thermal treatment of divided solid in solar receiver composed of closed and opaque tubes could be implemented for thermo-chemical processing of particles. Applications to concrete industry, to waste and biomass treatment, or to ore processing, can be foreseen and will be considered next.
The next step of this study is operating DSP in the temperature range 500–700 1C.
Funding sources
This work was funded by French CNRS (Energy Programme) and by European Commission, FP7 (CSP2 Project, Grant Agreement 82932).
Nomenclature Latin symbols
A internal surface area of the tube receiver [m2] Cp heat capacity [J/kg K]
d32 sauter mean diameter [m]
F mass-flow rate [kg/s]
G Superficial mass-flow rate [kg/m2s]
g gravitational acceleration [m2/s]
h mean wall-to-suspension heat transfer coefficient [W/m2K]
hbase height of the base of the tube [m]
htube suspension level in the tube [m]
L distance between two pressure plugs [m] Lexposed length of the irradiated part of the tube [m]
Patm atmospheric pressure [Pa]
Pchamber freeboard pressure (particle suspension dispenser) [Pa]
r tube radius [m]
S tube cross-section area [m2]
t time [s]
T temperature [1C] U velocity [m/s] Greek symbols
α
volume fractionΔ
P pressure difference [Pa]Δ
Pmotor driving pressure of the flow [Pa]Δ
Ptube hydrostatic pressure of the suspension in the tube [Pa]Δ
Pbed hydrostatic pressure of the suspension in the bed [Pa]Δ
t time interval in the solid mass-flow calculation [s]Δ
Tlm logarithmic-mean temperature difference [K]ε
voidageλ
conductivity [W/m K]Φ
power transmitted to the suspension [W]ρ
density [kg/m3]sX standard deviation on the parameter X
τ
particles average passage time inside the irradiated part of the tube [s]Subscripts/superscripts
g/p/w Gas/particles or solid/wall i/m/o Inlet/middle/outlet of the cavity int/ext internal/external side of the tube wall
References
Al-Ansary, H., El-Leathy, A., Al-Suhaibani, Z., Jetre, S., Sadowski, D., Alrished, A., Golob, M., 2012. Experimental study of a sand–air heat exchanger for use with a high-temperature solar gas turbine system. ASME Journal of Solar Energy Engineering 134, 041017.
Badie, J-M., Bonet, C., Faure, M., Flamant, G., Foro, R., Hernandez, D., 1980. Decarbonation of calcite and phosphate rock in solar chemical reactors. Chemical Engineering Science 35, 413–420.
Bataille, D., Laguerie, C., Royere, C., Gauthier, D., 1989. Gas–solid heat exchangers with multistage fluidized beds in the range of average and high temperature. Entropie 25, 113–126.
Bodin, S., Briens, C., Bergougnou, M.A., Patureaux, T., 2002. Standpipe flow modeling, experimental validation and design recommendations. Powder Technology 124, 8–17.
Boissière B., Ansart R., Hemati M., Gauthier D., Flamant G., 2012. 7ème Colloque Science et Technologie des Poudres, STP2012, Toulouse, FRANCE, 4–6 Juillet 2012.
Chen, H., Chen, Y., Hsieh, H.T., Siegel, N., 2007. CFD modeling of gas particle flow within a solid particle solar receiver. ASME Journal of Solar Energy Engineering 129, 160–170.
Evans, G., Houf, W., Grief, R., Crowe, C., 1987. Gas-particle flow within a high temperature solar cavity receiver including radiation heat transfer. ASME Journal of Solar Energy Engineering 109, 134–142.
Falcone, P.K., Noring, J.E., Hruby, J.M., 1985. Assessment of a solid particle receiver for a high temperature solar central receiver system. Sandia National Labora-tories, Report SAND 85, 8208.
Flamant, G., Hernandez, D., Bonet, C., Traverse, J-P, 1980. Experimental aspects of the thermochemical conversion of solar energy; decarbonation of CaCO3. Solar
Energy 24, 385–395.
Flamant, G., 1982. Theoretical and experimental study of radiant heat transfer in a solar fluidized-bed receiver. AIChE Journal 28, 529–535.
Flamant, G., Ménigault, T., 1987. Combined wall-to-fluidized bed heat transfer. Bubbles and emulsion contributions at high temperature. International Journal of Heat and Mass Transfer 30, 1803–1812.
Flamant, G., Hemati, M.. French Patent No. 1058565, 20 October 2010. PCT extension, 26 April 2012, No. WO 2012/052661 A2.
Geldart, D., 1973. Types of gas fluidization. Powder Technology 7, 285–292. Giuliano, S., Buck, R., Eguigen, S., 2011. Analysis of solar-thermal power plants with
thermal energy storage and solar-hybrid operation strategy. ASME Journal of Solar Energy Engineering 133, 031007.
Lédé, J., Verzaro, F., Antoine, B., Villermaux, J., 1986. Flash pyrolysis of wood in a cyclone reactor. Chemical Engineering and Processing: Process Intensification 20, 309–317.
Martin, J., Vitko, J., 1982. ASCUAS: a solar central receiver utilizing a solid thermal carrier. Sandia National Laboratories, Report SAND82, 8203.
Mickley, H.S., Fairbanks, D.F., Hawthorn, R.D, 1961. The relation between the heat transfer coefficient and thermal fluctuations in fluidized bed heat transfer. Chemical Engineering Progress Symposium Series 57, 51–60.
Munro, R.G., 1997. Material properties of a sintered alpha-SiC. Journal of Physical and Chemical Reference Data 26, 1195–1203.
Pacio, J., Wetzel, Th., 2013. Assessment of liquid metal technology status and research paths for their use as efficient heat transfer fluids in solar central receiver systems. Solar Energy 93, 11–22.
Pitz-Paal, R., Amin, A., Bettzuge, M.O., Eames, P., Flamant, G., Fabrizzi, F., Homes, J., Kribus, A., Van der Lan, H., Lopez, C., Garcia Novo, F., Papagiannakopoulos, P., Pihl, E., Smith, P., Wagner, H-J., 2012. Concentrating solar power in Europe, the Middle East and North Africa: a review of development issues and potential to 2050. ASME Journal of Solar Energy Engineering 134, 024501.
Röger, M., Amsberg, L., Gobereit, B., Buck, R., 2011. Face-down solid particle receiver using recirculation. ASME Journal of Solar Energy Engineering 133, 031009. Siegel, N., Ho, C.K., Khalsaz, S.S., Kolb, G.J., 2010. Development and evaluation of a
prototype solid particle receiver: on-sun testing and model validation. ASME Journal of Solar Energy Engineering 132, 021008.
Tan T., Chen Y.T., Chen Z., 2008. Performance of Solid Particle Receivers with or without the Protection of an Aerowindow. ASME 2nd international conference on energy sustainability. Aug 10–14, 2008. Jacksonville, Florida, USA. (ES 2008-54129).
Tan, T., Chen, Y., 2010. Review of study on solid particle solar receivers. Renewable and Sustainable Energy Reviews 14, 265–276.
Warerkar, S., Schmitz, S., Goettsche, J., Hoffschmidt, B., Reissel, M., Tamme, R., 2011. Air–sand heat exchanger for high-temperature storage. ASME Journal of Solar Energy Engineering 133, 021010.
Watson, R.J., Thorpe, R.B., Davidson, J.F., 2012. Vertical plug-flow pneumatic conveying from a fluidised bed. Powder Technology 224, 155–161.