HAL Id: hal-01715086
https://hal.archives-ouvertes.fr/hal-01715086
Submitted on 11 Jan 2019
HAL is a multi-disciplinary open access
archive for the deposit and dissemination of
sci-entific research documents, whether they are
pub-lished or not. The documents may come from
teaching and research institutions in France or
abroad, or from public or private research centers.
L’archive ouverte pluridisciplinaire HAL, est
destinée au dépôt et à la diffusion de documents
scientifiques de niveau recherche, publiés ou non,
émanant des établissements d’enseignement et de
recherche français ou étrangers, des laboratoires
publics ou privés.
Microstructure evolution of hot-work tool steels during
tempering and definition of a kinetic law based on
hardness measurements
Z Zhang, Denis Delagnes, Gérard Bernhart
To cite this version:
Z Zhang, Denis Delagnes, Gérard Bernhart. Microstructure evolution of hot-work tool steels during
tempering and definition of a kinetic law based on hardness measurements. Materials Science and
Engineering: A, Elsevier, 2004, 380 (1-2), pp.222-230. �10.1016/j.msea.2004.03.067�. �hal-01715086�
Microstructure evolution of hot-work tool steels during tempering and
definition of a kinetic law based on hardness measurements
Z. Zhang
a,∗, D. Delagnes
b, G. Bernhart
baInstitute of Materials and Technology, Dalian Maritime University, Dalian 116026, China
bResearch Centre on Tools, Materials and Processes (CROMeP), Ecole des Mines d’Albi-Carmaux, 81013 Albi CT cedex 09, France
Abstract
Microstructural evolutions of the 55NiCrMoV7 steel during tempering were investigated by transmission electron microscopy, scanning electron microscopy and X-ray diffraction in order to describe the main mechanisms of softening. The softening resistance is strongly associated with evolution of obstacles to the movement of dislocations (prior austenitic grain boundary, lath boundary, secondary carbides, etc.). Only the average size of carbides was found to be influenced by tempering conditions. Moreover, a strong correlation observed between the hardness measured after tempering and the average size of carbides showing that this easy test could in this case partially characterize the state of the microstructure after tempering. Performing hardness measurements at the as-quenched, tempered and annealed states, a kinetic law of tempering based on the work of Johnson, Mehl and Avrami has been proposed. This law was validated in the case of complex tempering and for other steels and can well describe the evolution of hardness during tempering.
Keywords: Martensitic steel; Kinetic law of tempering; Tempering ratio; Microstructure; Carbides; Hardness
1. Introduction
Hot-work tool steels are widely used at various temper-ing states with different mechanical properties, accordtemper-ing to the needs of industrial applications where the steel endures cyclic thermal and mechanical loads. Furthermore, some in-vestigations [1–3] have shown that the temperature at the surface of the tool may exceed the tempering temperature. In that case, the steel may be subjected to a continuous evo-lution of the microstructure and associated properties dur-ing service. As a consequence, it is important to understand the evolution of the microstructure during tempering and during service in order to control the tool lifetime. There-fore, researchers have paid close attention to the evolution of microstructure and properties with time and temperature over a long period of time. For example, relationships be-tween the microstructure obtained after tempering and phys-ical properties have been widely studied[4–6]. In that field, Engel finely investigated the softening rate of steel when
∗Corresponding author. Tel.:+86-411-4726897;
fax:+86-411-4727184.
E-mail address: zzp@newmail.dlmu.edu.cn (Z. Zhang).
tempered from different initial structures. In other respects, relations between time, temperature and composition with the microstructure obtained after tempering have also been intensively investigated[7–15].
Without any doubt, the famous work of Hollomon and Jaffe has led to the most well known relation. Hollomon and Jaffe [10] supposed that the same hardness could be reached by different tempering history, i.e. by different time-temperature routes assuming that the hardness was a function of the time and the temperature: hardness =
f(te−Q/RT). Finally, Hollomon and Jaffe have obtained a
relation between the hardness and a tempering parameter
M: hardness= f(M) = f [T(c + log t)]. This relation has a great importance and has been widely used to determine the different possibilities of tempering conditions in industry. But, as this relation is not a kinetic law (hardness is not an explicit function of time and temperature), this relation cannot describe the evolution of hardness during a temper-ing and cannot be used to predict the hardness variation of steels in service with time and temperature. Moreover, some authors indicated that the Hollomon–Jaffe relation is not suitable for all steels [11–16]. In order to extend the application of the Hollomon and Jaffe work, some
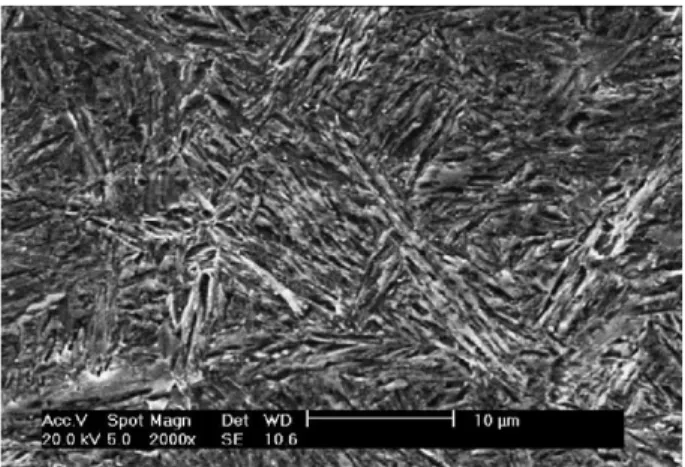
re-Fig. 1. SEM micrograph of the as-quenched microstructure.
searchers[11–15]have proposed some modifications of the initial law. For example, with a reference state tempered at 550◦C for 2 h and 600◦C for 2 h, Jean[15]gave a relative hardness decrease law with time and temperature for 5% chromium hot-work tool steel.
In this study, our aim is to develop a kinetic law describing the softening of the steel during tempering. At first, the steel investigated and experimental methods are presented. Then, after the study of microstructural evolutions during temper-ing at different scales (ex-austenitic grains, martensitic laths and carbides), a kinetic law of tempering is proposed. This law is based on microstructural investigations of secondary carbides growth and the associated hardness evolution. In the last part, this kinetic law is discussed in detail using data coming from the literature obtained on different types steels.
2. Materials and experiments
2.1. 55NiCrMoV7 steel
The grade investigated is the 55NiCrMoV7 hot-work tool steel with the following chemical composition (wt.%): 0.56C, 1.7Ni, 1.0Cr, 0.5Mo, 0.1V, 0.2Si and 0.7Mn. The microstructure obtained after quenching is shown inFig. 1. The quenched microstructure contains martensitic laths and a small quantity of primary carbides. In addition, no retained austenite was detected by X-ray diffraction (XRD).
Table 2
Tempering conditions for hardness evolution measurements and carbides analysis
Tempering temperature (◦C) Part 1 Part 2
Tempering time (h) Tempering time (h)
350 0.25 2 665.00 0.025 0.083 0.5 1 75 189 460 0.25 2 25.63 0.025 0.083 0.5 1 75 100 500 0.25 2* 75.30 0.025 0.083 0.5 1 25 100 560 0.25 2* 18.87 0.025 0.083 0.5 1 25 75 600 0.25* 2* 16.00* 0.025 0.083 0.5 1 25 75 Table 1
Heat treatment conditions for the analysis of ex-austenitic grains and tempered martensitic lath sizes
Sample Quenching Tempering
R52 Austenizing to 875◦C for 1 h oil quenching 510◦C+ 2 h
R63 Austenizing to 875◦C for 1 h oil quenching 605◦C+ 3.5 h
2.2. Experiments
Heat treatment conditions for the analysis of ex-austenitic grains and martensitic laths are presented inTable 1. Heat treatment conditions for hardness measurements and for in-vestigations of the relationship between hardness and sec-ondary carbides are shown in Table 2. Thermocouples for temperature control were welded on each sample. Vickers hardness measurements were performed on every sample af-ter the tempering. Considering the experimental schedule, 15 samples of the part 1 were used to investigate the evo-lution of the volume fraction of carbides, 8 samples indi-cated by bold type numbers were selected on the basis of the Hollomon–Jaffe relation T(20+log t) = constant for the steel, and finally the 6 samples indicated by numbers with an asterisk were devoted to the determination of the evolu-tion of the mean carbide size during tempering.
The microstructure evolution of the steel was investigated by XRD, scanning electron microscopy (SEM) PHILIPS XL30, transmission electron microscopy (TEM) JEOL 2010 and PHILIPS CM12 and quantitative image analy-sis. Quantitative image analysis was carried out with the software VISILOG®. In order to reveal respective lath and
prior austenitic grain boundaries, samples were respectively etched 3 s with a Nital 2% solution (2% nitric acid+ethanol) and 16 h with the corrosive Beaujard–Bechet solution (4% picric acid+1% Teepol aqueous solution). The morphology and the mean size of ex-austenitic grain and martensitic lath were investigated by SEM observations and quantita-tive image analysis. The volume fraction of the carbides was estimated by energy dispersive X-ray diffraction. The size and morphology of carbides were analyzed by TEM observations and quantitative image analysis. Previously, carbides were extracted from the martensitic matrix using the well-known replica technique[16].
Hardness measurements were performed using a Buehler® MICROMET® 2001 type microhardness tester.
Fig. 2. SEM micrograph of the tempered microstructure showing secondary carbides.
Fig. 3. SEM micrograph of the prior austenitic grains (a) and result of the image analysis (b).
Thirty indentations were performed on each sample with 0.2 kg load. The mean value was considered as the hardness result. The standard deviation is approximately 10 Vickers (HV0.2).
3. Microstructure evolution during tempering
Tempering is a diffusion type phase transformation from a quenched martensite to a tempered martensitic structure containing ferrite and carbides as shown inFig. 2. The pre-cipitation and growth of carbides is strongly related to tem-pering time and temperature. Therefore, establishing a rela-tion between tempering condirela-tions and microstructures is of great interest. In order to study evolution of microstructural relevant parameters, samples were observed at three differ-ent scales.
3.1. Ex-austenitic grains
Each sample was observed with SEM and 20 photos with a magnification of 1000 were taken. Grain boundaries were drawn on a tracing paper. Then, the tracing paper was treated with the VISILOG®software as initial photos. These photos
were treated by median filtering, entropy thresholding, la-beling and finally the perimeter (P) and the area (S) of each grain were calculated. An example of ex-austenitic grain ob-servation and the result of such image treatment are given inFig. 3.
As the grains are nearly equiaxial, an equivalent diame-ter D= 4S/P can be calculated. The result of the statistics (Fig. 4) shows that the two samples investigated have nearly the same distribution of grain equivalent diameter. The mean
0 2 4 6 8 10 12 14 2 4 6 8 10 12 14 16 18 20 22 24 26 28 Grain equivalent diameter (µm)
Perc
ent (%)
854 grains analysed for the sample R52 747 grains analysed for the sample R63
Fig. 5. SEM micrograph of the martensitic laths (a) and result of the image analysis (b). Table 3
Size and morphology of martensitic laths obtained by image analysis
Sample Number of laths analysed Mean length of laths (!m) Mean width of laths (!m) Shape factor of laths R52 2540 3.49 1.64 0.47 R63 2753 3.20 1.55 0.48
equivalent diameter for samples R52 and R63 are respec-tively 10.08 and 10.63 !m, which are nearly the same values as the as-quenched sample. AnalyzingFig. 4 and the data, we found out that the two populations cannot be separated. Therefore, it can be concluded that tempering does not in-fluence the prior austenitic grain size. This conclusion is in agreement with results coming from the literature mainly obtained on carbon steels[17].
3.2. Martensitic laths
Each sample was observed on SEM and 10 photos with a magnification of 2000 were taken. These photos were treated with the VISILOG® software through median filtering, en-tropy thresholding and labeling. An example of martensitic laths observation and the result of such image treatment are given in Fig. 5. Finally, parameters extracted from the im-age analysis were the length, the width and the shape factor (width/length). Results of the statistics (average values) are
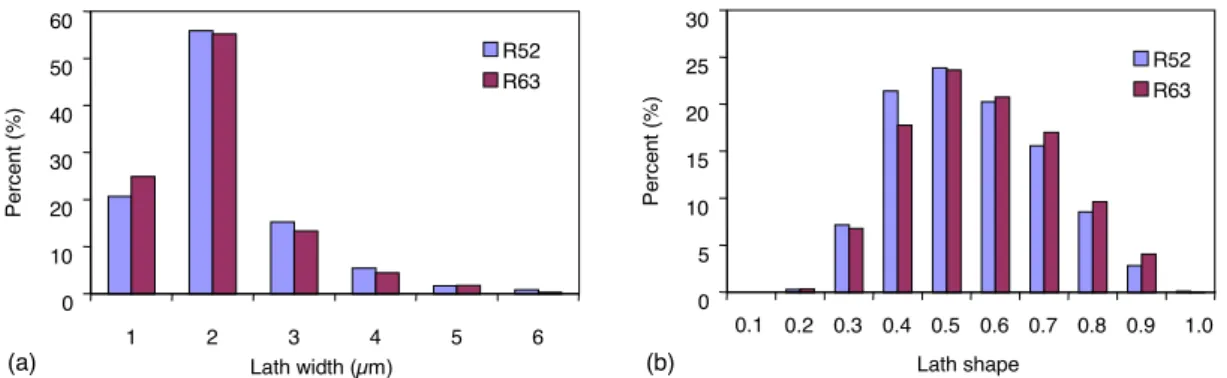
0 10 20 30 40 50 60 1 2 3 4 5 6 Lath width (µm) Pe rc e n t (% ) R52 R63 0 5 10 15 20 25 30 0.1 0.2 0.3 0.4 0.5 0.6 0.7 0.8 0.9 1.0 Lath shape Pe rc e n t (% ) R52 R63 (a) (b)
Fig. 6. Distribution of martensitic lath width and shape factor.
5.0 5.5 6.0 6.5 7.0 7.5 8.0 8.5 9.0 9.5 10.0 300 350 400 450 500 550 600 650 Tempering temperature (˚C) Volume fraction of carbides ( % ) 0.25h 2h 16h 18.87h 25.63h 75.3h 665h mean: 8.20% minimum: 7.45% maximum: 8.67%
Fig. 7. Evolution of the volume fraction of carbides with the tempering temperature.
presented inTable 3. Distributions of the width and shape factor of martensitic laths are shown in Fig. 6. The con-clusion is the same as for prior austenitic grain size. The martensitic lath morphology and size are not influenced by the tempering treatment.
3.3. Carbides
The volume fraction of carbides was estimated by XRD with an energy dispersive spectrometer (seeFig. 7). More-over, TEM observations and image analysis were performed
Fig. 8. TEM micrograph of intra-laths carbides extracted from the matrix.
to investigate the evolution of intra-laths carbide size with tempering conditions. Using EDS analysis, the chemical composition of the carbides extracted from the matrix (see Fig. 8) was investigated. Most of the carbides are iron rich carbides, M3C type with an orthorhombic structure.
Volume fractions of carbides vary from 7.45 to 8.67% and the mean value is equal to 8.2%, nearly corresponding to the theoretical maximum volume fraction of cementite assuming that all the carbon has precipitated. Except for 350◦C, where we can see a slight influence of the tempering time inFig. 7, the volume fraction does not seem to vary with the tempering time and temperature. In conclusion, the volume fraction of carbides can be considered as a constant for these tempering conditions. This conclusion is in agreement with the results given in literature[18].
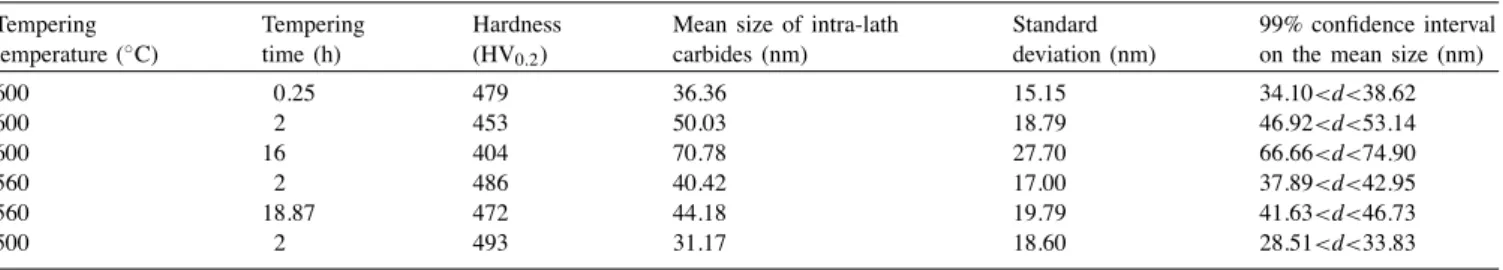
Six samples (seeTable 2) were selected for the evaluation of intra-laths carbides size. The mean intra-laths carbides size, the standard deviation and the 99% confidence inter-val on the mean size are reported in Table 4. Confidence intervals were estimated using the t-distribution of Student [19]. At a given temperature, the mean size of intra-laths carbide increases rapidly during tempering. When the tem-pering time increases, the coarsening rate of carbide dimin-ishes. In other respects, for a given tempering time, the mean carbide size increases with tempering temperature, signifi-cantly influencing mechanical properties of the steel. Indeed, Fig. 9shows a strong correlation between the hardness and the average size of carbides.
Table 4
Evaluation of the mean size of intra-laths carbides Tempering temperature (◦C) Tempering time (h) Hardness (HV0.2)
Mean size of intra-lath carbides (nm)
Standard deviation (nm)
99% confidence interval on the mean size (nm)
600 0.25 479 36.36 15.15 34.10<d<38.62 600 2 453 50.03 18.79 46.92<d<53.14 600 16 404 70.78 27.70 66.66<d<74.90 560 2 486 40.42 17.00 37.89<d<42.95 560 18.87 472 44.18 19.79 41.63<d<46.73 500 2 493 31.17 18.60 28.51<d<33.83 20 30 40 50 60 70 80 390 410 430 450 470 490 510 Hardness (HV0.2) Intra-laths carbide mean size (nm) 600˚C+16h 600˚C+2h 600˚C+0.25h 560˚C+18.87h 560˚C+2h 500˚C+2h
Fig. 9. Relation between hardness and the mean size of intra-laths carbides.
4. Tempering kinetic law
4.1. Definition of a tempering ratio
Hardness evolutions with tempering time at different tem-peratures are shown inFig. 10a and b. A sharp decrease of hardness takes place during the initial stage of tempering at each temperature. Then, this short period is followed by a quasi-linear decrease of hardness, which depends on tem-pering temperature (seeFig. 11).
Tempering can be considered as a phase transformation promoted by diffusion from an unstable state (martensite) towards a quasi equilibrium state (ferrite+ globular car-bides). Therefore, all kinds of hardness can be used to de-fine any tempering state between these two states. Neverthe-less, hardness cannot clearly indicate the softening from a quenched state or the hardening from an equilibrium state. So, the following definition of a tempering ratio called τvis
introduced: τv=
Hv− H0
H∞− H0
(2) where H0is the hardness after quenching, H∞the hardness
in the annealed state, and Hv the hardness of an
interme-diate state between the as-quenched state and the annealed state. According to this definition, tempering ratio values fall between 0 (as-quenched state) and 1 (annealed state). For the 55NiCrMoV7 steel, the values experimentally obtained
200 300 400 500 600 700 800 900 0.0 0.5 1.0 1.5 2.0 2.5 3.0 3.5 4.0 Tempering time (h) Hardness (HV 0.2 ) 700˚C 650˚C 600˚C 460˚C 350˚C 300˚C 200˚C 100˚C 200 300 400 500 600 700 800 0 10 20 30 40 50 60 70 80 90 100 Tempering time (h) Hardness (HV 0.2 ) 100˚C 200˚C 350˚C 460˚C 500˚C 560˚C 600˚C 650˚C 700˚C 300˚C
Fig. 10. Hardness evolutions during tempering for different temperatures between 100 and 700◦C.
are respectively H0= 776(HV0.2) and H∞= 210(HV0.2).
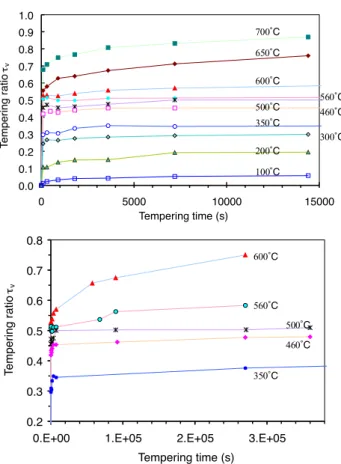
Evolutions of tempering ratio are shown inFig. 12. Tem-pering ratio exponentially increases with the temTem-pering time for various tempering temperatures. The higher the temper-ature, the greater is the tempering ratio for the same tem-pering time. 200 300 400 500 600 700 800 0 100 200 300 400 500 600 700 800 Tempering temperature (˚C) Hardness (HV 0. 2 ) 90s 900s 7200s
Fig. 11. Influence of tempering temperature on hardness values.
0.0 0.1 0.2 0.3 0.4 0.5 0.6 0.7 0.8 0.9 1.0 0 5000 10000 15000 Tempering time (s) T e mpering r a tio τv 100˚C 200˚C 350˚C 460˚C 500˚C 560˚C 600˚C 650˚C 700˚C 300˚C 0.2 0.3 0.4 0.5 0.6 0.7 0.8
0.E+00 1.E+05 2.E+05 3.E+05
Tempering time (s) T e mpering ratio τv 350˚C 460˚C 500˚C 560˚C 600˚C
Fig. 12. Evolution of tempering ratio with tempering time and temperature.
4.2. Tempering kinetic law
A relation describing solid phase transformation con-trolled by diffusion was simultaneously proposed by John-son and Mehl [21], and Avrami [22–24]. This relation is widely used for describing the solid transformation and re-crystallization kinetics in metallic materials[20,25–28], and also succeeds in establishing the continuous-cooling trans-formation (CCT) [29]. As the evolution of the tempering ratio with time and temperature is also controlled by dif-fusion mechanisms (particularly carbides precipitation and growth), a tempering kinetic law was proposed in the form of the Johnson–Mehl–Avrami type equation as follows:
τv= 1 − exp(−(Dt)m) (3)
where t is the tempering time, m the ageing exponent de-pending on the material and the previous heat treatment. D depends on tempering temperature and follows the Arrhe-nius equation: D= D0exp ! −RTQ " (4) where D0is the pre-exponential constant, Q the activation
energy of the tempering transformation, R the perfect gas constant (equal to 8.31 J K−1mol−1) and T the tempering temperature in K.
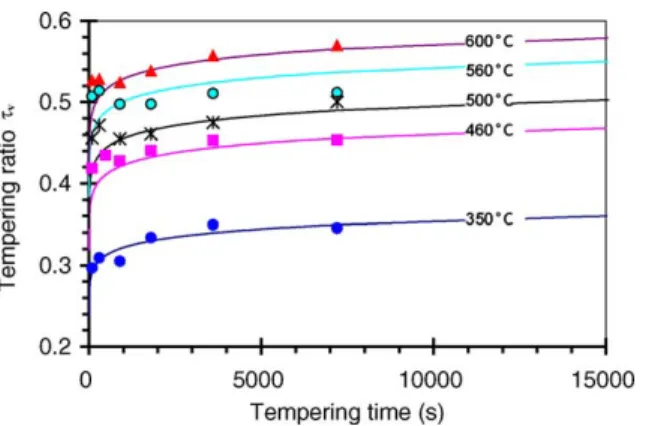
Fig. 13. Evolution of the tempering ratio with time for several temperatures between 350 and 600◦C: experimental results and predictions obtained
with the kinetic law.
IntroducingEq. (2)into Eq. (3), the tempering hardness can be expressed by the following equations:
Hv= H0+ (H∞− H0)(1− exp(−(Dt)m) (5)
or
Hv= H∞+ (H0− H∞)exp(−(Dt)m) (6)
Using the measured hardness values, parameters were iden-tified with a method consisting in minimizing the differ-ence between the experidiffer-ence and the simulation using the software SiDoLo[30]. The obtained values are respectively D0= 2.7 × 10⁸s−1, m= 0.0518 and Q ≈ 231 kJ mol−1.
The latter value is close to the values reported in literature for low or medium alloyed steel and also close to the activa-tion energy of the diffusion of usual alloying elements (Cr, Mn, Ni, V) in ferrite[31].Fig. 13shows the experimental and calculated evolution of tempering ratio for short times (≤4 h) corresponding to the domain of usual industrial tem-pering conditions. When complex time-temperature routes are followed, a differential equation of the kinetic law has to be used: ˙τv= (1 − τv)mD ! ln 1 1− τv "m−1/m (7) where: if t = 0, τv = 0, then ˙τv → ∞ and if τv = 1,
t→ ∞, then ˙τv→ 0, as shown inFig. 13.
4.3. Validation
To validate the tempering kinetic law, three sets of double tempering (complex time-temperature routes) were per-formed. Results are presented inFig. 14where a compari-son between experimental results and predictions obtained with the proposed kinetic law is done. Experimental results closely agree with predicted values. After a first tempering at 350◦C (1 h), the steel strongly softens when the second tempering temperature is higher than the first tempering one. On the contrary, the steel softens very slowly when the temperature of second tempering is less than the first one.
0.1 0.2 0.3 0.4 0.5 0.6 0.7 0 2000 4000 6000 8000 10000 12000 Tempering time (s) 600˚C-exp 600˚C+1h+460˚C-ex p 350˚C+1h+600˚C-ex p 600˚C-calcul 350˚C-calcul 460˚C-calcul 350˚C+1h+600˚C-calcul Tempering ratio τv
Fig. 14. Evolution of the tempering ratio with time for a double tempering: experimental results and predictions obtained with the kinetic law.
If the tempering temperature remains constant, the behavior of the steel during the second tempering follows closely the situation obtained at the end of the first one. Therefore, the proposed kinetic law (Eq. (7)) seems to be valid for the steel investigated.
5. Discussion
5.1. Relationship with the Hollomon–Jaffe tempering relation
According to Eq. (6), various tempering routes can be followed to reach the same hardness value HV. For example,
for two different routes: t1exp ! Q RT1 " = t2exp ! Q RT2 " = constant (8)
and more generally: texp ! −Q RT " = constant (9)
Consequently,Eq. (9)leads to the well-known Hollomon– Jaffe relation:
T(k+ log t) = constant
Compared to the Hollomon–Jaffe relation, the proposed ki-netic law gives an explicit relation between hardness, time and tempering temperature. It can properly point out met-allurgical mechanisms associated to the strong hardness de-crease at the beginning of the tempering and to the following slow softening.
5.2. Application to other steels
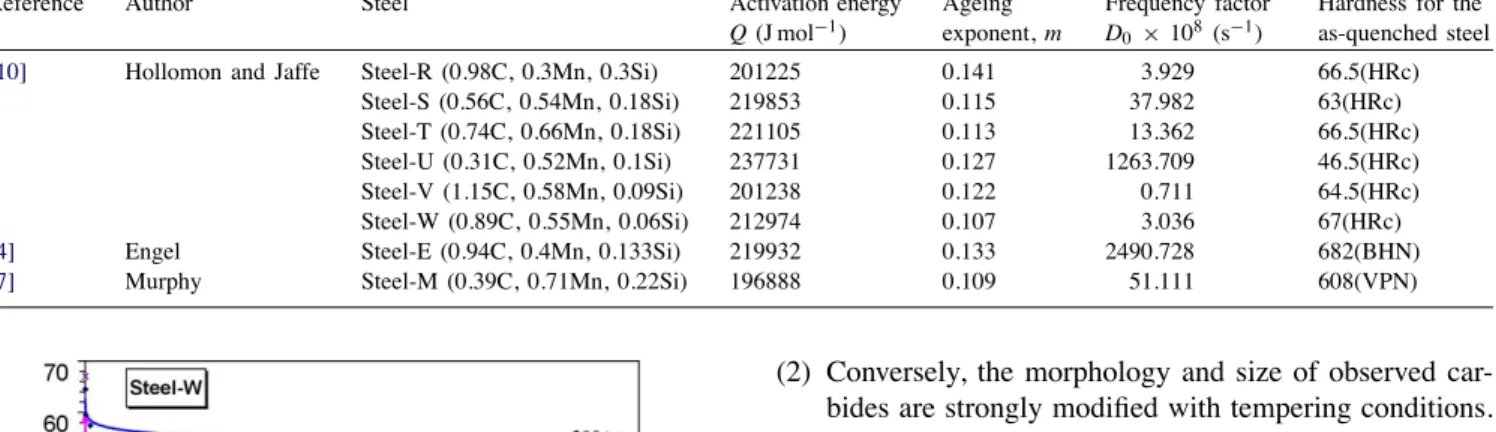
Using the data found in the literature[4,7,10], the kinetic law was applied to other steels. The selection was done assuming that carbides found in these low-alloyed steels are iron rich carbides (cementite) as in the 55NiCrMoV7. Steels investigated and parameters obtained are shown in
Table 5
Parameters of the tempering law obtained for different steels selected in the literature
Reference Author Steel Activation energy
Q (J mol−1)
Ageing exponent, m
Frequency factor D0 × 108 (s−1)
Hardness for the as-quenched steel
[10] Hollomon and Jaffe Steel-R (0.98C, 0.3Mn, 0.3Si) 201225 0.141 3.929 66.5(HRc)
Steel-S (0.56C, 0.54Mn, 0.18Si) 219853 0.115 37.982 63(HRc)
Steel-T (0.74C, 0.66Mn, 0.18Si) 221105 0.113 13.362 66.5(HRc)
Steel-U (0.31C, 0.52Mn, 0.1Si) 237731 0.127 1263.709 46.5(HRc)
Steel-V (1.15C, 0.58Mn, 0.09Si) 201238 0.122 0.711 64.5(HRc)
Steel-W (0.89C, 0.55Mn, 0.06Si) 212974 0.107 3.036 67(HRc)
[4] Engel Steel-E (0.94C, 0.4Mn, 0.133Si) 219932 0.133 2490.728 682(BHN)
[7] Murphy Steel-M (0.39C, 0.71Mn, 0.22Si) 196888 0.109 51.111 608(VPN)
Fig. 15. Comparison between experimental and calculated hardness for the Steel-W.
Table 5. An example of comparison between experimental results and calculated hardness is presented in Fig. 15 for the Steel-W. Therefore, the kinetic law proposed in this paper seems to be widely suitable for the description of the transformation process from a non-equilibrium state towards an equilibrium state. As it is a kinetic law, this law could be used to predict the hardness evolution of a tool when it is under ageing effect. Nevertheless, the application of the law to more alloyed steels with an intensive precipitation of special carbides (with a sharp secondary peak hardening) is now under discussion. More generally, the effects of al-loying additions and austenitizing treatments on secondary hardening constitute an interesting outlook of this study.
6. Conclusions
The tempering behavior of the 55NiCrMoV7 steel was in-vestigated describing microstructural and associate hardness evolutions. Main results are summarized below:
(1) The morphology and size of the ex-austenitic grain and the martensitic lath, at selected magnification and method of observation, are not significantly influenced during the tempering of the 55NiCrMoV7 steel. The volume fraction of carbides, estimated by X-ray diffrac-tion, also remains constant for a tempering between 350 and 600◦C for a large range of time.
(2) Conversely, the morphology and size of observed car-bides are strongly modified with tempering conditions. TEM observations have shown an increase of the mean size of mostly iron carbides with tempering temperature and time. A linear relation between hardness and the mean size of carbides has been observed.
(3) Based on the hardness of quenched state, tempered state and annealed state, a tempering ratio has been defined. Then, a kinetic law of tempering controlled by solid state diffusion has been proposed. This kinetic law can well describe the evolution of all types of hardness (Vickers, Rockwell, etc.) with temperature and time during the tempering of martensitic steel.
Acknowledgements
The authors would like to thank the Thyssen France Com-pany for supplying the steel investigated and the China Scholarship Council for financial support.
References
[1] R. Komanduri, Z.B. Hou, Int. J. Mech. Sci. 43 (2001) 57. [2] C.L. Gibbons, J.E. Dunn, Ind. Heat. 47 (1980) 6.
[3] G. Andreis, K.-D. Fuchs, I. Schruff, in: F. Jeglitsch, R. Ebner, H. Leitner (Eds.), Proceedings of the Fifth International Conference on Tooling, Tool Steels in the Next Century, University of Leoben, Austria, 29 September to 1 October 1999, p. 593.
[4] E.H. Engel, Trans. Am. Soc. Met. 27 (1939) 17. [5] K. Kuo, J. Iron Steel Inst. 173 (1953) 375.
[6] R.G. Baker, J. Nutting, J. Iron Steel Inst. 179 (1959) 268. [7] S. Murphy, J.H. Woodhead, Metall. Trans. 3 (1972) 735. [8] K.J. Irvine, F.B. Pickering, J. Iron Steel Inst. 180 (1960) 153. [9] B.K. Jha, N.S. Mishra, Mater. Sci. Eng. A 263 (1999) 55. [10] J.H. Hollomon, L.D. Jaffe, Trans. AIME 162 (1945) 249. [11] G. Murry, R. Namdar, Revue de Metallurgie 7/8 (1970) 670. [12] G. Murry, Revue de Metallurgie 12 (1977) 672.
[13] J. Barralis, G. Maeder, in: A. Nathan (Ed.), Le précis de métallurgie, élaboration, structure-propiétés et normalisation, 1991.
[14] E. Smith, J. Nutting, J. Iron Steel Inst. 177 (1957) 329.
[15] S. Jean, Ph.D.Thesis, Institut national polytechnique de Toulouse, 1999.
[16] N. Mebarki, Ph.D. Thesis, Ecole Nationale Supérieure des Mines de Paris, February 2003.
[17] A.V. Sverdlin, A.R. Ness, in: G.E. Totten, M.A.H. Howes (Eds.), Fundamental Concepts in Steel Heat Treatment, Steel Heat Treatment Handbook, Marcel Dekker, 1997, pp. 1–44.
[18] M.F.Ashby, D.R.H. Jones, Matériaux, 2: Microstructure et mise en oeuvre, Dunod, Paris, 1991.
[19] W.S. Gosset, in: E.S. Pearson, J. Wishart (Eds.), The Probable Error of a Mean, “Student’s” Collected Papers, Cambridge: University Press, 1958.
[20] G. Béranger, G.Henry, G.Sanz, Le Livre De L’acier, Technique & Documentation, Lavoisier, Paris, 1994.
[21] W.A. Johnson, R.F. Mehl, Trans. Am. Inst. Mining, Metall. Petroleum Eng. Incorporated 135 (1939) 458.
[22] M. Avrami, J. Chem. Phys. 7 (1939) 1112. [23] M. Avrami, J. Chem. Phys. 8 (1940) 224. [24] M. Avrami, J. Chem. Phys. 9 (1941) 184.
[25] J. Majta, J.G. Lenard, M. Pietrzyk, ISIJ Int. 36 (1996) 1102. [26] A. Borrego, G.G. Doncel, Mater. Sci. Eng. A 252 (1998) 152. [27] M. Takahashi, H.K.D.H. Bhadeshia, Mater. Sci. Technol. 6 (1990)
603.
[28] T. Tsuchiyama, Y. Miyamoto, S. Takaki, ISIJ Int. 41 (2001) 1052. [29] ASM Handbook, Volume 4: Heat Treating, ASM International, 1991. [30] P. Pilvin, SiDoLo, Notice d’utilisation, 1985.
[31] Z. Zhang, Ph.D Thesis, Ecole Nationale Supérieure des Mines de Paris, May 2002.