HAL Id: hal-01063789
https://hal.archives-ouvertes.fr/hal-01063789
Submitted on 30 Sep 2014
HAL is a multi-disciplinary open access
archive for the deposit and dissemination of
sci-entific research documents, whether they are
pub-lished or not. The documents may come from
teaching and research institutions in France or
abroad, or from public or private research centers.
L’archive ouverte pluridisciplinaire HAL, est
destinée au dépôt et à la diffusion de documents
scientifiques de niveau recherche, publiés ou non,
émanant des établissements d’enseignement et de
recherche français ou étrangers, des laboratoires
publics ou privés.
On Analyzing the Topology of Commit Histories in
Decentralized Version Control Systems
Marco Biazzini, Martin Monperrus, Benoit Baudry
To cite this version:
Marco Biazzini, Martin Monperrus, Benoit Baudry. On Analyzing the Topology of Commit Histories
in Decentralized Version Control Systems. ICSME - 30th IEEE International Conference on Software
Maintenance and Evolution, Sep 2014, Victoria, Canada. pp.261-270, �10.1109/ICSME.2014.48�.
�hal-01063789�
On Analyzing the Topology of Commit Histories in
Decentralized Version Control Systems
Marco Biazzini
INRIA — Bretagne Atlantique [email protected]
Martin Monperrus
Universit´e de Lille martin.monperrus@univ–lille1.fr
Benoit Baudry
INRIA — Bretagne Atlantique [email protected]
Abstract—Empirical analysis of software repositories usually deals with linear histories derived from centralized versioning systems. Decentralized version control systems allow a much richer structure of commit histories, which presents features that are typical of complex graph models. In this paper we bring some evidences of how the very structure of these commit histories carries relevant information about the distributed development process. By means of a novel data structure that we formally de-fine, we analyze the topological characteristics of commit graphs of a sample of GITprojects. Our findings point out the existence of common recurrent structural patterns which identically occur in different projects and can be consider building blocks of distributed collaborative development.
I. INTRODUCTION
Centralized version control systems (CVCS) such as CVS or SVN have a rather sequential history. There is a linear history of committed change sets (or commits), stored on a central server. Branching makes up for some parallelism, but its capability to improve successful collaboration has been thoroughly questioned [1].
On the contrary, the history of Decentralized Version Control Systems (DVCSs) such as Mercurial or GIT is much richer. In decentralized version control systems, each developer has the full commit history of the codebase locally available. This allows for a much more flexible way to handle different concurrent branches. The extreme ease of branch manipulation and combination results in software histories that are much more complex than what is typically found in a traditional centralized systems software.
Bird and colleagues have shown that the analysis of DVCS presents several issues for traditional repository mining techniques and metrics [2], In DVCSs, there are concurrent branches that start from a common ancestor, run in parallel, split, merge together or with other branches, then are finally merged in a commit which gives a “current stable version” of the software product. Such a canopy of development lines de-mands to redefine concepts such as “developer collaboration”, “current state of the code”, “amount of contribution”, which are fairly easy to establish for CVCSs.
In this paper, we propose to use graph concepts and metrics to characterize DVCSs such as GIT. We consider commit histories of DVCSs as directed acyclic graphs (DAGs) and talk about software development using a general graph char-acterization (topology, patterns, metrics, etc.). The structure of commit history DAGs is given by the way developers use branches. Their topology reflects the way the software is modified, improved, fixed, in one word, evolved.
Thus there is information hidden in the very structure of the commit history graph, which is relevant to understand key characteristics of the development process typical of DVCSs. In this paper we show that the topology of commit graphs presents recognizable patterns, whose recurrence is due to the nature of the underlying development process itself. Such patterns are not purposely designed by developers, who rather pursuit goals related to the state of their codebase. They thus
emerge from the topologically rich structure of DVCSs and characterize the way the codebase evolves over time.
To sum up, this paper makes the following contributions: – The definition of a novel data structure, the repository
Metagraph, that captures all the relevant information about the DVCSs repositories.
– A classification of the elements of a DVCS commit history, based on their topological relevance in their history graph.
– An analysis of topological properties of the commit history of several open source GIT–based project repositories.
We thus propose a novel way to analyze DVCS–based software project and discuss the evidences that signal its potential in leading to novel insights about the process of collaborative development.
The rest of the paper is organized as follows. Section II presents and formally defines our contribution. Section III describes the settings of our experiments. Section IV discusses our findings and motivates their relevance. Section V presents related work and Section VI draws our conclusion.
II. TOPOLOGICALANALYSIS OFCOMMITGRAPHS
The commit history of a decentralized repository can be modeled by a directed acyclic graph whose nodes are commits and edges are parent/child relations between them.
As the history of a project evolves, parallel branches are created and joined in a distributed process of incremental manipulation of the code base. In general (as backed up by statistics we present in the following), the majority of commits belongs to single branches, while fewer are those where the creation or the join of the branches themselves occur.
For the purpose of understanding the global structure of the commit history, i.e. the topology of the commit graph, these latter commits are much more relevant than the former.
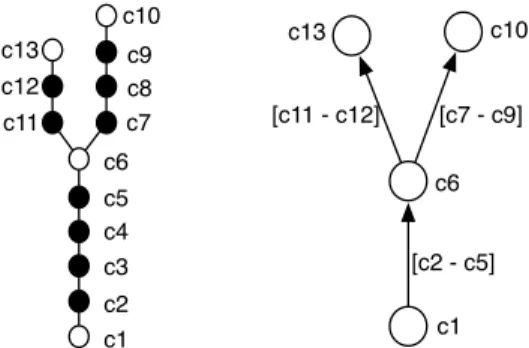
c1 c2 c3 c4 c5 c6 c7 c11 c8 c9 c10 c12 c13 [c2 - c5] c1 c6 c10 c13 [c7 - c9] [c11 - c12]
Fig. 1. Example of commit history to Metagraph transformation
We propose to classify, from the standpoint of their topo-logical interest, the commits populating a history graph as follows:
– Terminal. Commits having no parent or no child. – Sequential. Commits having exactly one parent and
one child.
– Structural. Non-terminal commits whose union set of parents and children has more than 2 elements. These categories are devised so that (i) they capture the whole set of commits in a GIThistory and (ii) a given commit
can belong to one and only one of them. To bridge these definitions with the standard GIT terminology, terminal com-mits are either first comcom-mits orHEADs; sequential commits are non-merging and non-branching ones, excluding first commits and HEADs; structural commits are merging and/or branching commits, which are not HEADs.
Terminal commits are thus the boundaries of the graph, while structural commits are the nodes which define its struc-ture. Sequential commits do not play any role in determining the topology of the graph, being just enqueued in development lines (the branches) which lead from a merge (or branch) commit to another.
Sequential commits are clearly important from the stand-point of the developer contribution to the codebase. They should anyway be bypassed, when analyzing how branches feed each other and the parallel development gets organized in the repository, in order to get rid of topologically irrelevant information, which would bias any metrics.
Thus, a way must be devised to meet conflicting goals: • Avoiding the overhead and the information noise of
sequential commits while analyzing the topology of a commit history graph, in order to be able to obtain meaningful results
• Saving the information about the developer contribu-tions that the sequential commits incorporate, along with their position in the commit history, in order to be able to relate the results of the topological analysis with those derived by other kinds of data mining, which focus on code metrics or process metrics. We define in the following a data structure and a set of properties that allow to positively solve both issues.
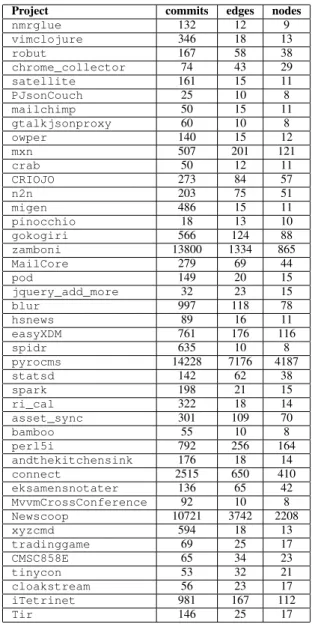
TABLE I. THEGIT REPOSITORIES UNDER STUDY—PARTI.
THE COLUMNS REPORT THE PROJECT’S NAME,THE NUMBER OF COMMITS,
THE NUMBER OF EDGES AND NODES OF ITSMetagraph.
Project commits edges nodes
OpenLeague 43 36 25 BroadleafCommerce 4722 784 496 Fridgemagnet 67 12 10 AutoSave 124 15 12 OryzoneBoilerplateBundle 60 20 14 ketama 18 10 7 Edaha 185 11 9 Tolmey 61 29 21 Ai_Class_Octave_Functions 23 13 10 WPide 152 24 17 sexpistol 37 14 10 ace 3220 1139 693 contracted 72 10 8 gitpython 163 37 25 tcesp 81 25 18 bempp 1530 375 246 FReD 211 45 31 testlol 77 12 9 configs 40 18 14 pool 42 14 10 q4wine 966 81 54 pylibemu 59 10 8 sarah 312 19 14 ConcurrenTree 632 91 59 ProWiC 61 30 22 java 95 47 33 flour 209 45 29 Telephus 272 65 43 arkilloid 177 40 27 RLLVMCompile 87 20 15 pants 643 57 40 pelm 415 103 68 jump 49 32 23 a4a 206 68 46 PySynergy 278 23 16 caveman 211 19 14 cocoagit 756 86 57 stsh 239 37 26 zap 28 10 7 iamhanchang 600 202 123 Locke 29 10 8 ConfigServiceProvider 43 16 12 Twittia 86 14 11 MiniCart 124 15 11
A. The Repository Metagraph
We define an original data structure, based on this clas-sification of GIT commits. This structure, called Metagraph, encompasses a commit history, focusing on the topologically relevant commits. The Metagraph retains all the information from in the commit history. It aims at simplifying structural analyses performed on the repository commit logs of a GIT
repository.
Def. — Metagraph
A MetagraphM g of a commit history graph G = hV, Ei is a multi–graph M g = hV e, M ei, where V e is the set of nodes which correspond to terminal and structural commits inV and M e is a set of metaedges (see next definition). We call root the node in V e associated to the first commit of G.
Def. — metaedge
Given a Metagraph M g of a commit history graph G, a
Fig. 2. Patterns of size 4 and 5.
nodes V e of M g.
A metaedgeme between two nodes V e1andV e2exists in
M g if and only if a path in G exists between the corresponding nodes V1 and V2, which is composed uniquely by sequential
commits. The list of (sequential) commits composing this path inV is associated (as metadata) to the metaedge.
We call V e1 (resp.V e2) first (resp. last) node of me.
TABLE II. THEGIT REPOSITORIES UNDER STUDY—PARTII.
THE COLUMNS REPORT THE PROJECT’S NAME,THE NUMBER OF COMMITS,
THE NUMBER OF EDGES AND NODES OF ITSMetagraph.
Project commits edges nodes
nmrglue 132 12 9 vimclojure 346 18 13 robut 167 58 38 chrome_collector 74 43 29 satellite 161 15 11 PJsonCouch 25 10 8 mailchimp 50 15 11 gtalkjsonproxy 60 10 8 owper 140 15 12 mxn 507 201 121 crab 50 12 11 CRIOJO 273 84 57 n2n 203 75 51 migen 486 15 11 pinocchio 18 13 10 gokogiri 566 124 88 zamboni 13800 1334 865 MailCore 279 69 44 pod 149 20 15 jquery_add_more 32 23 15 blur 997 118 78 hsnews 89 16 11 easyXDM 761 176 116 spidr 635 10 8 pyrocms 14228 7176 4187 statsd 142 62 38 spark 198 21 15 ri_cal 322 18 14 asset_sync 301 109 70 bamboo 55 10 8 perl5i 792 256 164 andthekitchensink 176 18 14 connect 2515 650 410 eksamensnotater 136 65 42 MvvmCrossConference 92 10 8 Newscoop 10721 3742 2208 xyzcmd 594 18 13 tradinggame 69 25 17 CMSC858E 65 34 23 tinycon 53 32 21 cloakstream 56 23 17 iTetrinet 981 167 112 Tir 146 25 17
Figure 1 illustrates a Metagraph (right) built from a commit history graph (left). Our definition of metaedges serves two main purposes: (i) it simplifies the topology of a commit history by excluding sequential commits from its structure, while preserving the information they carry and (ii) it makes the Metagraph a model that focuses on parallel development events (occurrences of branching or merging in the commit history graph G).
Our analysis of Metagraphs extracted from GIT reposito-ries is based on the following properties:
Def. — Metagraph’s layer
For any vi ∈ V e, let dist(vi) : V e → N be a function that
maps each node ofM g to its maximum distance from the root of M g, measured in number of metaedges.
A layer Ln in a MetagraphM e is defined as
Ln⊆ V e ∈ M e : li∈ Ln ⇐⇒ dist(li) = n.
Layer Ln is thus the set of all nodes having the same
maximum distancen from the root. We call n the index of the layer. By construction, roots are the only nodes belonging to L0.
Supposing the example in Figure 1 represents a complete
Metagraph, we have L0 = c1, L1 = c6 and L2 = c10, c13.
The set of layers of a Metagraph is a convenient partitioning of its nodes, which groups commits according to their distance from the first commit, measured in terms of number of parallel development events, as captured by the metaedges.
Def. — Width of a layer.
The width of a layer Ln is equal to its cardinality |Ln|.
Def. — Density of a layer.
We call density of a layerLnthe number of metaedges whose
last node is in Lm, m ≥ n.
The density of a layerLnis thus the number of metaedges
terminating either in Ln or in a layer which is farther from
the root. By definition, the density of L0= 0.
Let cn be a cut of M g partitioning its nodes in two sets:
V e1 = vi: dist(vi) < n and V e2= vj: dist(vj) ≥ n. Then,
the density of Ln is the number of metaedges crossingcn.
Def. — Diameter of a Metagraph.
The diameter of a Metagraph is equal to the length of the longest path in the Metagraph. By construction, it is equal to the greatest layer index of the Metagraph.
B. Development Patterns
Since the Metagraph captures the structural properties of a commit graph, we now look for evidence of the presence (or
lack thereof) of recurrent development patterns in repository metagraphs.
A way to spot such patterns is to find recurring subgraphs in a Metagraph over different projects. Since any subgraph of a Metagraph can only be composed by merging and/or branching commits of the project history, the fact that the same subgraph occurs several times in a project Metagraph would denote the emergence of the same collaborative pattern at different moments of the project history.
Moreover, the fact that the same subgraph repeatedly occurs in Metagraphs which model the history of different projects would point out emergent patterns characterizing collaborative development itself, rather than the collaboration habits of a specific community of developers.
The problem of finding all isomorphic subgraphs of a given graph is in general NP-complete [3]. Even limiting the size of the subgraphs to target, the feasibility of such a task heavily depends on the structural complexity of the Metagraph. Several efficient algorithms exist, though, to find single subgraphs within larger graphs. By restricting the number of targets and narrow down the search to each one of them, we can find all occurrences of specific patterns of a given size (number of nodes).
A way to choose target patterns is needed. We are interested in enlightening the very structure of the Metagraphs. Terminal nodes are the ever-changing boundaries of the Metagraphs and thus not really relevant for our purposes. We can focus on structural nodes and on the metaedges that start from or arrive to structural nodes.
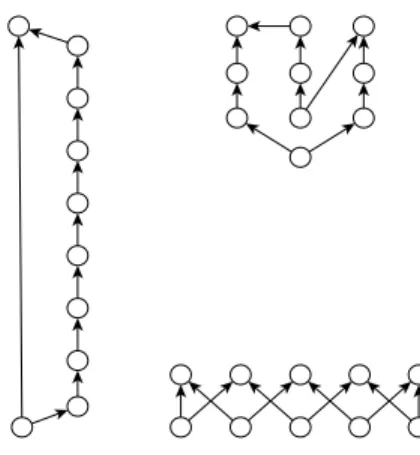
Let us therefore consider the subgraphSg = hV s, M si of a Metagraph M g, composed by the set V s of all structural nodes of M g, along with the set M s of all metaedges of M g whose first and last nodes are both in V s. Recalling that, by construction, any metaedge inM s must either start form or end to a node inV s, it is easy to see that all subgraphs of Sg are either isomorphic to simple polygons or to polygons composed by adjacent polygons of smaller size. Figure 3 exemplifies our point by showing two isomorphic graphs.
Thus the quest for patterns becomes the search for all polygon subgraphs inSg. Finding simple polygons is enough, because it is easy to spot out composed polygons, by tracking common nodes among simple (smaller) polygons. Such a task is accomplished by finding induced subgraphs in M g, which are isomorphic to simple polygons.
We thus propose the following definition. Def. — Pattern
We call pattern any induced subgraph of a Metagraph, which is isomorphic to a polygon graph.
As metaedges are always directed, there are several differ-ent (i.e., non–isomorphic) patterns of any given size s, s > 3. Thus the relevance of a pattern may not be given only by its size, but also by its very topology. Since we are interested in characterizing the way collaborative development shapes commit histories, we propose a simple way to discriminate between patterns of incremental development and patterns of
code integration. Clearly both aspects are always present in any
pattern, but their relative relevance may differ, as we exemplify in the following.
Fig. 3. Isomorphic simple acyclic digraphs of degree 2.
Fig. 4. Patterns of size 10 showing a different slenderness.
Being our patterns simple acyclic digraphs of degree 2, each pattern is composed of two or more walks. The lengths of these walks fall in the interval]0, 1, . . . , N [, where N is the size of the pattern. Considering the topology of a pattern, the presence (resp. absence) of few longer walks indicates a greater (resp. smaller) relevance of incremental developing w.r.t. code integration. Figure 4 intuitively shows how three identically sized patterns can be different from this standpoint.
In order to classify patterns of different size w.r.t. the kind of collaboration they entail, and, more generally, to compare them w.r.t. this criterion, we propose to compute their
slenderness, defined as follows: Def. — Pattern’s slenderness
The slenderness of a pattern is a real number in [0 . . . 1[, computed as the number of vertexes that are internal to its walks, divided by the size of the pattern.
Intuitively, a higher (resp. lower) slenderness denotes a pattern where incremental development (resp. code integration) dominates over its counterpart. For instance, the patterns in Figure 4 have a slenderness of 8/10 = 0.8 (left), 6/10 = 0.6 (top right) and 0/10 = 0 (bottom right), which well denotes the fact that the first pattern is strongly incremental, while the second balance increments and integration (with a slight dominance of the first) and the third pattern is all about integration.
The results presented in the following show that recurring patterns indeed characterize commit histories of a sample of GIT–based projects.
We underline that such patterns would not be detectable on “raw” commit history graphs, because sequential commits
TABLE III. THE PATTERNS WE CONSIDER.
Name Size How many
tri 3 1 tetra* 4 3 penta* 5 3 exa* 6 8 epta* 7 9 octa* 8 20 enna* 9 28 deca* 10 53
“overwhelm” their structure destroying relevant topology prop-erties. Thanks to the transformation to Metagraphs, the very structure of commit graphs can be successfully mined from a topological standpoint.
III. EXPERIMENTALDESIGN
We present an experiment that aims at identifying develop-ment patterns in a sample of GIT repositories, collected from GITHUB. For each repository, we build a Metagraph modeling its commit history. We then detect patterns in the topology of the Metagraphs and analyze their characteristics.
A. Experimental Data
The experimental data comes from GITHUB, an
Inter-net hosting service for open source software. According to FLOSSmole [4] (Free Libre Open Source Software) statistics, GITHUB had 191765 repositories publicly available in May 2012. In order to obtain a statistically representative sample of GITHUBhosted projects, we order these projects according to the number of watchers. To discard outliers and less significant entries, we decide to cut off the extrema of the range, i.e. projects whose number of watchers is less than 2 or more than1000. Then we select 1% of the projects in each of three subsets:
• Projects that had from 2 to 9 watchers (total: 30236; sampled: 303)
• Projects that had from 10 to 99 watchers (total: 3554; sampled: 36)
• Projects that had from 100 to 999 watchers (total: 286; sampled: 3)
This way, we obtain a set of 342 GITrepositories. We then discard those having a too poor structure, which we define as less than 10 metaedges in their Metagraph. We finally obtain a set of 87 projects, listed in Tables I and II.
B. Patterns and Metagraph Properties
As explained above, we define patterns as polygonal in-duced subgraphs of our Metagraphs. We limit our analysis to patterns from size 3 to size 10, because small patterns are trivial and large patterns are too costly to compute. There are 125 non–isomorphic patterns within this size range. For instance, there is only one pattern of size 3, which corresponds to a triangle. Figure 2 shows all patterns of size 4 and 5.
To ease the references to each pattern in the following, we use some arbitrary nicknames, composed by the greek name of numbers from three to ten and by a numerical index. Table III summarizes the information about the “families” of patterns
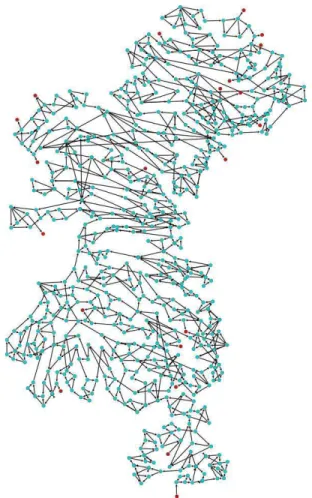
Fig. 5. Metagraphof the ace project. Root at the bottom; other red nodes
are branches’ heads.
we consider. The third column reports the number of existing non–isomorphic instances of each pattern.
It is important to recall that any pattern can only occur in a Metagraph of a commit history where two or more parallel lines of development exist, since patterns are composed by structural nodes, which by themselves imply the existence of more than one branch. Thus, whenever a pattern is found in a Metagraph, it is implied that those nodes whose in–degree and out–degree is equal to 1 within the pattern are actually linked to other nodes of the Metagraph, which are not part of the same pattern.
We define two sets of patterns, named increment and
integration. All patterns having a slenderness greater or equal to 0.5 are assigned to the first set, while the others fall into the second.
In the following, we use the expression category to refer to any of the families and sets of patterns we just defined.
C. Implementation
In order to perform our analysis, we developed a toolset called GitWorks, as a pure Java application. GitWorks uses JGit1 to extract information from GIT repositories, then build
2 3 5 20 30 50 200 300 500 3849 1 10 100 1000 andthekitchensink arkilloidbamboo ConfigServiceProvider contracted crab Fridgemagnetgtalkjsonproxy hsnewsketamaLocke mailchimp migen MvvmCrossConference nmrglue OryzoneBoilerplateBundle pinocchio PJsonCouch pod pool pylibemu sarah
satellitesparkspidrtinyconTwittia caveman Edahaowperpants PySynergy rical-stsh testlol xyzcmd zap Ai -Class -Octave
-FunctionsAutoSavesexpistol tradinggame WPide a4a CMSC858E configs gitpython java MiniCart RLLVMCompile tcesp Tir cloakstream ProWiC vimclojure q4winerobutTolmey
jquery -add -moreblur chrome
-collectorFReDjumpMailCore ConcurrenTree statsd eksamensnotater gokogiri OpenLeague pelm flour n2n asset -sync CRIOJOcocoagitTelephus
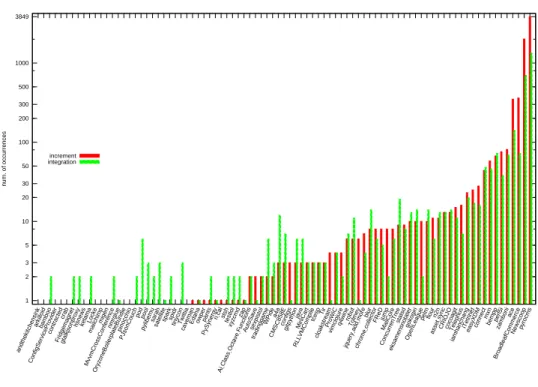
iamhanchang iTetrinet easyXDMconnect mxn bemppperl5i zamboni ace BroadleafCommerce Newscooppyrocms num. of occurrences increment integration
Fig. 6. Occurrences of increment and integration patterns.
Metagraphs and extract several features from the collected data. GitWorks is freely available on GITHUB2.
In order to extract the occurrences of patterns in the
Metagraph, we use the Grochow–Kellis subgraph detection al-gorithm, based on symmetry breaking [5]. The implementation of the algorithm has been provided by the authors.
D. Research Questions
R.Q. 1 — Can we find significant recurring structures in
DVCS histories?
Our purpose is to see whether there are patterns in commit histories which repeatedly occur. For smaller patterns (e.g., of size 3 and 4), such a phenomenon can be an explicit choice of developers, which implies that such patterns are found useful for their collaborative job. For larger patterns, repeating occurrences can be considered emergent features of the topology of the repository. We want to study their relation with the structure of the commit history and with the activity of the developers.
R.Q. 2 — Does the structure of DVCS evolve over time? If structural patterns can be detected, we want to understand how they change along the history of a project, i.e. whether some collaboration patterns are more frequent at the beginning of a project or in its maturity. This may be relevant for a further analysis of each repository. If a commit history is morphologically characterized by specific patterns at specific stages of its evolution, it may be worth investigating for information about the way developer collaboration change over time.
R.Q. 3 — Is the occurrence of patterns correlated with
increased concurrent development activities?
2https://github.com/marbiaz/GitWorks
Whenever patterns appear, they may signal a particular in-crease of activity in the project. Patterns that tend to ap-pear whenever activity increases or decreases may then be correlated to the strengthening of the project in terms of development or code base.
R.Q. 4 — Are there structural similarities among DVCS
histories?
We aim at finding evidences of the existence (or the lack thereof) of same subgraphs in unrelated projects. Such a finding would indicate that there are “universal” patterns of development collaboration. This could then highlight common problems or strong points of different development communi-ties.
IV. EXPERIMENTALRESULTS
In this section, we present the outcomes of our analysis and discuss their relevance. We first present our results related to the properties of the Metagraphs and the detection of patterns. Then we discuss their meaning and propose our answers to the research questions.
A. Metagraph Properties
The Metagraphs that model the commit graphs of our sample are indeed quite diverse, from very simple parallel organization to very complex structures. Figure 5 depicts a topologically rich Metagraph.
In order to spot relevant characteristics, we analyzed basic
Metagraphfeatures (listed in Tables I and II) and layer–related properties.
Table IV shows the linear correlation between each couple of Metagraph features, plus the number of authors per repos-itory, measured over the whole ensemble of repositories.
TABLE IV. METAGRAPH FEATURES CORRELATIONS.
nodes edges commits
edges 0.99978 — —
commits 0.86953 0.86000 — authors 0.91235 0.91190 0.77873
Interestingly, Metagraph features are more correlated to the dimension of the developer community (number of au-thors) than to their total amount of contributions (number of commits).
Metagraph’s layers present high variability in terms of time range: from few seconds to hundreds of days elapse between two consecutive layers. We thus measured, in each
Metagraph the time range spanned by layers and we tested the correlation of their minimum, median and maximum value with the properties of their respective Metagraphs, defined in Section II-A.
Table V shows the resulting Spearmans’ correlation val-ues. It only reports values that have been found statistically significant, withp − values << 0.01.
TABLE V. LAYER PROPERTIES CORRELATIONS. THE SUFFIXtrSTANDS
FOR LAYER’S TIME RANGE.
diameter mintr medtr max width
mintr -0.800941 — — —
medtr -0.58116 0.41084 — —
max width 0.54177 -0.424114 n.s. — max density 0.69206 -0.59806 -0.3154 0.69646
Among the reported values, we see a fairly high correlation between diameter and layer maximum density. It indicates that the two sizes of the Metagraphs are positively correlated: the more the layers in a Metagraphs, the more they tend to be dense. Thus incremental development and synchronization practices follow a similar trend.
The inverse correlation between diameter and minimum layer time range is also noteworthy. The more the layers, the shorter is the time span they tend to cover
B. Patterns
We first detect, in each repository Metagraph, all patterns from size 3 to size 10. Figure 6 shows, for each Metagraph, the number of patterns belonging to the increment and integration categories.
The Metagraphs are sorted according to the number of increment patterns. It is visible a trend that somehow backs up the correlation values in Table V. Integration patterns tend to be more as the number of increment patterns grows, but the trend seems to be stable only for larger repositories (which happen to be on the right side of the plot).
We also notice that integration patterns are found in smaller repositories where increment patterns are not. This outcome is due to the fact most of pattern of size s < 5 fall into the integration category.
In order to investigate if and how the properties of the
Metagraphare associated with occurrences of patterns, we ana-lyze the relations between patterns and the structural properties of the Metagraph (diameter, layer width and density).
Figure 8 shows the occurrences of patterns in one of the largest Metagraphs of our sample. The same figure also gives a synopsis of layer densities and widths. All patterns, but tri and to some extent tetra*, seem to be particularly sensitive to layer properties, thus clustering more where layers are denser. 0.5 0 0.2 0.4 0.6 0.8 1 increment integration tri
tetra* penta* exa* epta* octa* enna* deca*
normalized time
pattern
Fig. 7. Distribution of timestamps of structural commits per pattern.
0 0.2 0.4 0.6 0.8 1 1488 0 200 400 600 800 1000 1200 1 5 10 15 20 25 30 35 40 45 50 55 cdf( pattern layer ) layer size layers
tri tetra* penta* exa* epta* octa* enna* deca* y = x
Fig. 8. Cumulative distribution of patterns in the Newscoop metagraph.
The cdf values of pattern occurrences, grouped per size, are given on the left axis, while the right axis gives the values of the layer width (orange vertical bars) and density (yellow vertical bars). The black line traces the slope of a linearly uniform distribution across the Metagraph’s layers.
Patterns occur at different moments of projects histories. Figure 7 shows the distribution of timestamps of Metagraphs vertexes belonging to patterns for each category we defined. Data are aggregated over all the Metagraphs, thus we normal-ize the timestamps in the interval[0..1], by simply computing the relative displacement of every commit timestamp w.r.t. the minimum and maximum timestamp in each Metagraph. The boxplots are standard interquartile plus whiskers to cover 95% of data points. Outliers are not shown, to improve legibility.
For instance, the boxplot related to the tetra* category shows that, considering the whole ensemble of repository in our sample, these patterns occur anywhere after 10% of the age of a repository is elapsed, half of them is found in the last 20% of repository lifetime (check the position of the median) and they get closer to each other in time as projects grow
old (check the different size of the two halves of box and whiskers).
We see how patterns of higher size tend to occur later than smaller ones. The skew towards the top is somehow biased by the fact that we compare project of different age and size, thus, in our case, the normalization of outcomes of smaller project tends to give high values. Nonetheless, it is true that larger patterns are definitely more numerous in the second half of projects’ life.
The first two boxplots show that increment patterns tend to occur substantially later than integration pattern.
Table VI presents the results of a comparative analysis of the number of authors and commits among metaedges which belong to patterns and which do not. In order to summarize a large amount of data, we present these results as dominance scores of the main aggregates. Each triplet reports the number of projects where a given aggregate (i.e., minimum, median or maximum) measured in a pattern is hless_than-equal_to-greater_thani the same ag-gregate measured in metaedges non belonging to a pattern. For instance, the first case on the left tells that the mini-mum number of distinct authors in metaedges belonging to increment patterns is greater than the minimum of metaedges non belonging to any patterns in 40 projects out of 59. Only projects where the considered patterns appear are taken into account, thus the triplets sum up to less than 87.
We see that pattern metaedges consistently dominate the others w.r.t. the minimum and the median number of distinct authors, while they usually carry less sequential commits.
TABLE VI. DOMINANCE COUNTS FOR AUTHORS AND COMMITS IN
PATTERNS.
Patterns Authors Commits
min med max min med max
increment 1–18–40 10–33–16 34–19–6 21–35–3 57–1–1 56–1–2 integration 1–24–46 7–34–30 41–20–10 26–44–1 65–4–2 63–2–6 tri 1–24–46 9–33–29 40–19–12 26–44–1 64–5–2 63–2–6 tetra* 1–16–38 9–30–16 31–18–6 18–35–2 54–1–0 53–0–2 penta* 0–9–26 7–15–13 24–9–2 9–26–0 32–2–1 33–0–2 exa* 0–7–25 4–17–11 19–8–5 8–23–1 30–1–1 31–1–0 epta* 0–5–16 2–11–8 15–4–2 5–16–0 21–0–0 21–0–0 octa* 0–4–13 2–7–8 12–3–2 4–13–0 16–1–0 17–0–0 enna* 0–4–15 2–6–11 14–4–1 4–15–0 17–0–2 18–0–1 deca* 0–2–13 2–4–9 12–2–1 2–13–0 14–0–1 15–0–0 C. Discussion
As said, the definition of Metagraphs as models of commit graphs allows a novel kind of topological analysis of reposi-tories.
Several properties of the Metagraphs offer interesting standpoints for further analysis of single projects. The results we present aggregate measures of diverse repositories and are not meant to offer a precise description of any of them. They rather point out interesting features which shall be further investigated both at the aggregate level and project by project, in order to reveal their specific importance.
In the following, we discuss our results by recalling and answering our research questions.
R.Q. 1 — Can we find significant recurring structures in
DVCS histories?
Answer — The patterns we discover are the very evidence of concurrent development in a GIT repository. As Figure 8 shows, in general patterns, and most of all smaller ones (size 3 to 5), are distributed across Metagraph layers. This means that they are not related to a particular “development stage” of the software (which may be identified at given sets of subsequent layers), but rather to the parallel development process itself.
Nonetheless, most patterns are found where the “footprint” of the Metagraph (the layer width and density) increase. This dependence on the topology of the Metagraph is stronger as the patterns get larger. But we could find no evident commonality among the “footprints” of the various Metagraphs.
These findings are common to several of the largest
Meta-graphs, the exception occurring mostly among the smaller projects. So far, we can say that, while smaller patterns are usually independent from a given topology and common to more repositories, others are strongly related to the structure of the Metagraphs and seem to occur in repositories having similar structures, in terms of diameter, layer width and density.
This outcome somehow supports the hypothesis about the intentionality of patterns: smaller patterns are direct product of developer decisions (they decide to involve one, two or three branches in some operation), while larger patterns emerges where the topology of the Metagraphs can support them.
A further analysis of each project, which combine the characterization of the Metagraph topology and its patterns with information about developer activity history and state of the software (bug tracks, release issues, etc.) could potentially achieve interesting novel insights on the collaborative devel-opment process.
R.Q. 2 — Does the structure of DVCS evolve over time? Answer — Figure 7 shows that patterns mostly appear later in time, if not “in space”. We find an interesting distinction between the timing of codebase evolution and the changes in its commit topology, at least as described in terms of
Metagraphlayers. The number of layers appears to grow faster as the project get older, which may mean that authors get more confident about merging and branching practices, or simply that more authors join a project.
We cannot attempt a generalization of this trend, because of the limited size of our sample and because of what we can consider an “internal bias” of several large repositories. We found that many of them have been automatically converted to GITfrom a pre–existing CVCS. They thus initially exhibit a mostly linear topology which, e.g. for long–lasting successful projects, can encompass a significant portion of their total age. Wherever the topology starts becoming complex and the
Metagraphsdenser, we see that layers do not subscribe to any regularity w.r.t. the pace of collaboration. We find layers whose time span is of few seconds and others which encompass several months. This fact may suggest that automatic merging is used in the first case. But, depending on the number of separate branches belonging to the layers, it may simply reveal highly synchronous development activity.
Thus, if we can see that larger patterns do tend to occur later in time w.r.t. smaller ones, we cannot answer so far an
interesting question: whether is there a feed–back loop between the structural complexity of a commit history (the Metagraph getting longer and denser) and the behavior of the developers (the fact that they branch and merge within shorter time).
We think that deepening this kind of analysis may reveal specific practices of integration and development which may affect the quality of the code, either positively or negatively.
R.Q. 3 — Is the occurrence of patterns correlated with
increased concurrent development activities?
Answer — We found some apparently conflicting evidences in our outcomes, summarized in Table VI.
On the one hand, we see that pattern metaedges present a higher concentration of authors w.r.t. most of other metaedges. On the other hand, they do not seem to carry a particularly high number of internal commits. Based on the first observation, we can say that patterns do identify portions of the commit history where authors collaboration becomes more evident. At the same time, quite clearly higher collaboration does not entail a higher number of commits per branch.
Our hypothesis — which will need a more thorough anal-ysis of the single projects to be confirmed — is that commits that brings most novelties to a codebase are made by fewer authors, who work in branches which do not directly end up in patterns, but merge with other “local integration” branches, which then lead the modifications to the main integration structures.
Thus, metaedges which comprise higher numbers of au-thors do not include higher numbers of commits. This is an interesting finding that open a novel perspective on how to determine the strength and the extent of author collaboration in a distributed project. By combining the analysis of author presence in metaedges with, for instance, code–based analysis about authors modifying the same files or components, it is possible to deepen the comprehension of collaboration practices in developer communities.
R.Q. 4 — Are there structural similarities among DVCS
histories?
Answer — We can positively answer this question and from two diverse perspectives.
First, as Table IV shows, the structural properties of commit histories are more correlated with the size of the developer community than with the number of commits they produce. Thus it is reasonable to think that projects whose community size is close would exhibit structures of similar richness, at least from the standpoint of aggregate measuring.
Then, we find the same patterns in otherwise very diverse software repositories. Figure 6 shows that increment patterns tend to occur more, but repositories with a richer structure tend to have anyway a higher number of occurrences of both categories. The occurrence of same patterns in unrelated software repositories suggests that development practices of different teams produce similar topologies in the repositories. Common patterns across repositories may reveal common vantage points or flaws in the way the software is developed, which may impact the quality of the software product itself.
Patterns that rarely occur in our repository sample are inter-esting as well. Their occurrence may be related to a particular
necessity or may happen only in specific topologies. If further analysis found that they present some drawback, it would be interesting to understand which structural configuration let them emerge, in order to devise better practices.
D. Threats to validity
The reasons behind the detection of patterns in commit histories may be questioned, given the absence of evidences that support their relevance. In this paper, our main effort is giving some empirical evidence of the fact that these common sub–structures occur in complex development histories, though they may be hidden in a standard commit graph topology.
We present results which concern patterns of maximum size equal to 10. It is certainly feasible and interesting to scale up, though the computation of all possible polygons of a given size gets exponentially harder as the size increases. Anyway, the main purpose of the present work is to show relevant characteristics that, to some extent, are common to pattern of different size and are mainly due to their topological properties.
Our repository sample is of limited size, thus some of our results may not generalize on larger ensembles. It has then been chosen with no known bias towards any specific topological structure. Due to the novelty of the analysis, though, it is possible that we are not aware of specific features of the
Metagraphtopology, which somehow affect the emergence of the patterns.
Finally, the toolset we used to perform the computations has been developed by us and manually tested. We cannot exclude the presence of unnoticed bugs which could affect the correctness of our results. The subgraph detection algorithm has been provided by its author and has not been thoroughly tested by us.
V. RELATEDWORK
The works which use graph–based techniques to analyze repositories focus either on characterizing the sourcecode, or on finding patterns in the social networks of developers.
In the first group, Posnett et alii propose models derived from ecological inference to analyze code at different hierar-chical levels (files, packages, modules) [6]. They show that properties inferred at a given level may not hold at a different one or often be mistakenly considered to hold in general.
Demeyer et alii [7] propose metrics to detect refactoring. Valverde e Sol´e [8] show how large scale software architectures can be modeled by dynamic logarithmic networks.
These and similar works focus on the content of contribu-tions, rather than on the topology of commit histories.
In the second group, Posnett et alii propose graph–based models to infer developer focus [9], showing correlation with bug occurrences and issue solving performance.
Bhattacharya et alii [10] combine the analysis of code organization and developer networks. They characterize both in terms of graph metrics and they show how it is possible to predict several indicators of software quality by using these metrics.
In [11] the authors analyze how different social organiza-tions of developers impact the quality of the development in open source communities.
Several relevant works target open source software devel-opment [12], [13]. A recent paper [14] analyze the social structure of developer networks on a large sample of GITHUB
projects.
These works apply complex network theory to the analysis of interactions among developers and to the characterization of their contribution to projects.
A thorough analysis of GITHUB–based software develop-ment, with a deep comparative analysis of centralized and decentralized versioning systems is given in [15].
Though recent publications pay more and more attention to GIT–based repositories and their distributed development paradigm [1], [16], to the best of our knowledge no study focuses on the characterization of the topology of commit histories.
VI. CONCLUSION
Decentralized version control systems produce structurally rich commit graphs. The commit history of projects that use these systems is thus a highly non–linear graph, whose topology can be analyzed by means of techniques, which are typical of complex graph analysis.
As for many other domains, rich and complex commit histories incorporate recurring substructures that reveal similar-ities among otherwise unrelated projects. They characterize the development process from a purely topological standpoint. We discuss in this paper the reasons why the analysis of commit graph topology is relevant and the challenges of such a task.
We define the Metagraph, a novel data structure that makes it possible to perform a topological analysis of commit history graphs, in order to detect recurrent subgraphs hidden in their structure. We define and analyze several topological properties of the Metagraphs and we identify a class of subgraphs that we call patterns, which may be consider building blocks of the very topology of Metagraphs.
We find empirical evidences of the recurring presence of several patterns in a sample of open source GIT repositories available on GITHUB. We analyze the characteristics of these patterns and their relations with the properties of the repository
Metagraphs. Our results support the conclusion that commit histories of otherwise unrelated projects are characterized by rich topologies, which exhibit similar properties and feature common patterns.
These findings open several different research directions. We plan to dig further the relation between patterns and prop-erties of commit graphs, such as number of commits, authors and size of commit changesets. We think it is possible to devise novel models to characterize developer collaboration, which are based on common contributions to the same metaedges or patterns of a given Metagraph.
The novel kind of analysis we propose is not an alterna-tive, but rather a complement to all existing techniques. By focusing entirely on topological features, it can guide to new
insights on the emergent properties of distributed collaborative development.
VII. ACKNOWLEDGMENTS
The authors thank Joshua Grochow, who kindly provided the sourcecode of his algorithm, and Nataliia Bielova for their help and fruitful discussions.
This work is partially supported by the EU FP7-ICT-2011-9 No. 600654 DIVERSIFY project and by the rgion Bretagne SoftLive project.
REFERENCES
[1] E. Shihab, C. Bird, and T. Zimmermann, “The effect of branching
strategies on software quality,” in Proceedings of the ACM-IEEE
international symposium on Empirical software engineering and mea-surement. ACM, 2012, pp. 301–310.
[2] C. Bird, P. C. Rigby, E. T. Barr, D. J. Hamilton, D. M. German,
and P. Devanbu, “The promises and perils of mining git,” in Mining
Software Repositories, 2009. MSR’09. 6th IEEE International Working Conference on. IEEE, 2009, pp. 1–10.
[3] I. Wegener, Complexity Theory: Exploring the Limits of Efficient
Algo-rithms. Springer, 2005.
[4] J. Howison, M. Conklin, and K. Crowston, “Flossmole: A collaborative
repository for floss research data and analyses,” International Journal
of Information Technology and Web Engineering, vol. 1, pp. 17–26, 07/2006 2006.
[5] J. A. Grochow and M. Kellis, “Network motif discovery using subgraph
enumeration and symmetry-breaking,” in Research in Computational
Molecular Biology (RECOMB07), ser. Lecture Notes in Computer
Science, vol. 4453. Springer-Verlag, 2007, pp. 92–106.
[6] D. Posnett, V. Filkov, and P. T. Devanbu, “Ecological inference in
empirical software engineering,” in ASE, 2011, pp. 362–371.
[7] S. Demeyer, S. Ducasse, and O. Nierstrasz, “Finding refactorings via
change metrics,” in ACM SIGPLAN Notices, vol. 35/10. ACM, 2000,
pp. 166–177.
[8] S. Valverde and R. Sole, “Logarithmic growth dynamics in software
networks,” EPL (Europhysics Letters), vol. 72, p. 858, 2005.
[9] D. Posnett, R. D’Souza, P. Devanbu, and V. Filkov, “Dual ecological
measures of focus in software development,” in Proceedings of the 2013
International Conference on Software Engineering. IEEE Press, 2013, pp. 452–461.
[10] P. Bhattacharya, M. Iliofotou, I. Neamtiu, and M. Faloutsos,
“Graph-based analysis and prediction for software evolution,” in Proceedings
of ICSE ’12, ser. ICSE ’12, 2012, pp. 419–429.
[11] S. Valverde and R. V. Sol´e, “Self-organization versus hierarchy in
open-source social networks,” Phys. Rev. E, vol. 76, p. 046118, Oct 2007.
[12] A. Mockus, R. T. Fielding, and J. Herbsleb, “A case study of open
source software development: the apache server,” in Proceedings of the
22nd international conference on Software engineering, ser. ICSE00. New York, NY, USA: ACM, 2000, pp. 263–272.
[13] C. Rodriguez-Bustos and J. Aponte, “How distributed version control
systems impact open source software projects,” in Mining Software
Repositories (MSR), 2012 9th IEEE Working Conference on. IEEE, 2012, pp. 36–39.
[14] F. Thung, T. Bissyande, D. Lo, and L. Jiang, “Network structure of
social coding in github,” in Software Maintenance and Reengineering
(CSMR), 2013 17th European Conference on, March 2013, pp. 323– 326.
[15] C. Brindescu, M. Codoban, S. Shmarkatiuk, and D. Dig, “How do
centralized and distributed version control systems impact software changes?” in ICSE’14, 2014 (to appear).
[16] L. Dabbish, C. Stuart, J. Tsay, and J. Herbsleb, “Social coding in
github: transparency and collaboration in an open software repository,” in Proceedings of the ACM 2012 conference on Computer Supported