HAL Id: hal-02267199
https://hal-mines-albi.archives-ouvertes.fr/hal-02267199
Submitted on 2 Sep 2019
HAL is a multi-disciplinary open access
archive for the deposit and dissemination of
sci-entific research documents, whether they are
pub-lished or not. The documents may come from
teaching and research institutions in France or
abroad, or from public or private research centers.
L’archive ouverte pluridisciplinaire HAL, est
destinée au dépôt et à la diffusion de documents
scientifiques de niveau recherche, publiés ou non,
émanant des établissements d’enseignement et de
recherche français ou étrangers, des laboratoires
publics ou privés.
Amorphous magnesium silicate ultrasound-assisted
precipitation in a mixing system: Population balance
modelling and crystallization rates identification
Marie Dietemann, Fabien Baillon, Fabienne Espitalier, Rachel Calvet, Mike
Greenhill-Hooper
To cite this version:
Marie Dietemann, Fabien Baillon, Fabienne Espitalier, Rachel Calvet, Mike Greenhill-Hooper.
Amor-phous magnesium silicate ultrasound-assisted precipitation in a mixing system: Population balance
modelling and crystallization rates identification. Powder Technology, Elsevier, 2019, 356, pp.83-96.
�10.1016/j.powtec.2019.08.004�. �hal-02267199�
Amorphous magnesium silicate ultrasound-assisted precipitation
in a mixing system: Population balance modelling and crystallization
rates identification
Marie Dietemann
a, Fabien Baillon
a, Fabienne Espitalier
a,⁎
, Rachel Calvet
a, Mike Greenhill-Hooper
baUniversité de Toulouse, IMT Mines d'Albi, UMR CNRS, Centre RAPSODEE, Campus Jarlard, F-81013 Albi, France
bImerys Talc, 2 Place E. Bouillères, 31036 Toulouse, France
a b s t r a c t
Natural talc is a very interesting filler for plastic and rubber materials and paints because it enables polymer ma-trix properties to be improved. Nano-sized particles are required to get a good dispersion of the solid in the poly-mer matrix. However, at the moment the main drawback in the use of natural talc is that, with a conventional milling process, nanometric particle sizes are difficult and expensive to obtain. A process of magnesium silicate synthesis made by ultrasound-assisted precipitation has been developed in two steps. The first step consists of the synthesis of amorphous magnesium silicate by precipitation from sodium metasilicate and acid magnesium chloride. In the second step, the amorphous solid is transformed in a crystalline solid under pressure. In this study an ultrasound-assisted synthesis of amorphous magnesium silicate is proposed. Some process parameters (ultra-sound power, initial reactants molalities and reactants flow rate) have effects on the particle-size distribution. The population balance is modelled and solved by moments method in the steady state to identify nucleation and growth rates and agglomeration kernel as a function of operating conditions and to understand how these conditions affect the particle-size distribution.
Keywords: Population balance Precipitation Magnesium silicate Ultrasound Crystallization rates 1. Introduction
Natural talc is an interesting material that can be used as high perfor-mance filler in polymers. Polymers properties, for instance mechanical reinforcement and barrier effects, are improved Ciesielczyk et al. [5]. Talc is used in rubbers in order to improve lubricating properties Tufar [17]. Tensile and transverse strength and the modulus of elasticity of plastics are improved by talc Tufar [17]. This solid also enables to im-prove the resistance to corrosion of paints, change their flow properties, make spreading easier and reinforce covering power Martin [12]. How-ever, a homogeneous dispersion of the filler in the polymer matrix is necessary to obtain these different performances. A good dispersion in a polymer matrix requires, in an ideal case, particles to be nano-sized Martin et al. [13]. However, obtaining nanometric particles using con-ventional milling processes is expensive because of an important ener-getic consumption. An alternative method to milling is the chemical synthesis of talc. This synthesis is made up of two steps. The first step consists of magnesium silicate precipitation with the production of an amorphous solid. A second step is necessary to convert the amorphous solid into crystalline lamellar nano-sized particles with a talc-like
structure. Amorphous and crystalline forms of magnesium silicate can be used, depending on the industrial application.
The first step of the process of producing amorphous magnesium sil-icate has been studied by Dietemann et al. [6]. The aim of this work was to study the influence of precipitation parameters on product proper-ties. Effects of some process parameters, such as reactant molalities, temperature and the mixing system used with an ultrasound probe, on the properties of amorphous magnesium silicate, in particular on the particle-size distribution, have been studied.
However effects of these process parameters on crystallization rates (nucleation rate, growth rate and agglomeration kernel) haven't been studied. The knowledge of these effects would enable to understand process parameters effects on the particle-size distribution and how these process parameters affect crystallization rates. The aim of this paper is to identify crystallization rates as a function of process param-eters with use of ultrasound and understanding the ultrasound-assisted precipitation phenomena in order to control the particle size of solid. 2. Experimental section
2.1. Materials
The amorphous magnesium silicate was synthesized by a precipita-tion between a sodium metasilicate soluprecipita-tion (Na2SiO3, 5H2O) and an
⁎ Corresponding author.
acid magnesium chloride solution (MgCl2, 6H2O), according to the
fol-lowing equation Martin et al. [13]: 4Na2SiO3;5H2O þ 3MgCl2;6H2O þ 2HCl
¼ Si4Mg3O11;5H2O þ 8NaCl þ 34H2O
The reactants were aqueous solutions of sodium metasilicate (purity 95%), and of magnesium chloride (purity 99%), (supplier Prolabo). The initial molar ratio Mg/Si was always 0.750.65, corresponding to that of natural talc. Hydrochloric acid 1 M was added to the aqueous solution of magnesium chloride (supplier Prolabo). Demineralised water was used. The water moles number in the magnesium silicate solid has been estimated by the solid weight loss at 550 °C [6]. This value, n = 5, has been confirmed by Dynamic Vapour Sorption analysis.
2.2. Procedures and methods 2.2.1. Synthesis of magnesium silicate
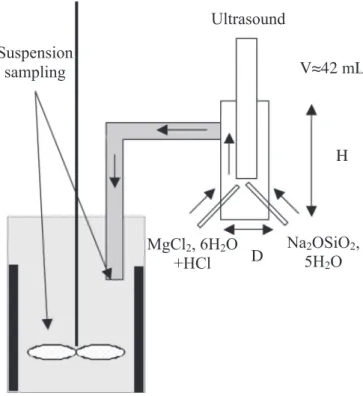
To ensure proper mixing of the reactants and optimal application of ultrasound, a small volume cell adapted to our probe was chosen to do the precipitation [1]. The precipitation occurred in aThe characteristic of the mixing system (Fig. 1) are: diameter D = 4 cm, height H = 6 cm and volume 42 mL. Peristaltic pumps were used to feed solutions into the mixing system.
The following operating conditions are studied at different values: • reactants molalities ([MgCl2, 6H2O] = 0.52, 0.73, 1.03, 1.26, 1.47, 2.21 and 2.94 mol·kg−1; [Na 2SiO3, 5H2O] = 0.50, 0.71, 1.00, 1.22, 1.43, 2.14 and 2.86 mol·kg−1); ([HCl] = 0.35, 0.50, 0.72, 0.87, 1.00, 1.50 and 2.00 mol·kg−1).
• reactants flow rate (QM= 128.4, 205.0 and 328.3 g·min−1). The
par-tial flowrates [MgCl2]/[Na2SiO3] are 50/78 g·min−1, 80/125 g·min−1
and 128/201 g·min−1for a total flowrate Q
Mof respectively 128.4,
205.0 and 328.3 g·min−1.
• and ultrasound power PUS(0.0, 34.5 and 70.6 W at 20 kHz) during the
precipitation in the mixing system.
TheTable 1gives the operating conditions of each experiments. The ultrasound power dissipation in the solution was measured by the calorimetry method.
At the exit of the mixing system, the suspension was poured into a sel which was initially filled with 100 mL ofdemineralised water.This ves-sel was equipped with four baffles and stirred. The mixing device was a PTFE helix propeller with four squared blades. Its diameter was 4 cm. The stirring rate was 600 rpm. The total volume of the suspension was 1 L. In a previous work, Dietemann et al. [6] showed amorphous silica could precipitate with amorphous magnesium silicate. This co-precipitation occured if an excess of hydrochloric acid was used in initial reactants molalities.
2.2.2. Evaluation of the properties of synthetic magnesium silicate Suspension and solid were submitted for physico-chemical proper-ties evaluation.
2.2.2.1. Particule-size distribution.Samples were taken of the suspension to be analysed by the dynamic light scattering technique using a Malvern Mastersizer 2000. This enables particle-size distribution to be followed during the synthesis. The suspension was diluted with water in the cell of the granulometer. Ultrasound (about 3 mW) was applied during 2 min before the size measurement following established proto-col showed by Dietemann et al. [6]. Samples were taken of the suspen-sion in two different points (Fig. 1): at the exit of the mixing system or at the exit of the tube that enabled the suspension to flow inside the vessel. 2.2.2.2. pH of the suspension.The pH and the temperature of the suspen-sion were measured at the exit of the mixing system.
2.2.2.3. Chemical composition of solid.Analyses by X-Ray fluorescence spectrometry were used to calculate Mg/Si ratio in the synthesized solid that had been washed, dried and milled as it is explained by Dietemann et al. [6]. The solid powder was then mixed with lithium meta and tetra-borate. A pearl was formed from this mixture in the ap-paratus Perlix′3. A Philips (WD-XRF) - PW2504 apap-paratus was used for these analyses. It was a wavelength-dispersive apparatus.
3. Chemical equilibrium calculations and precipitation process 3.1. Chemical equilibrium calculations involved during the precipitation reaction
The objective of the resolution of the chemical equilibrium calcula-tions is to determine supersaturation ratio of amorphous magnesium
Fig. 1. Experimental device of the precipitation process.
Table 1
Operating conditions and process parameters.
Experiment [MgCl2, 6H2O] (mol·kg−1) [Na2SiO3, 5H2O] (mol·kg−1) [HCl] (mol·kg−1) T(°C) P(W)US Q(g·minM −1) 1 0.52 0.50 0.35 20.0 0.0 205.0 2 0.73 0.71 0.50 20.0 0.0 205.0 3 1.03 1.00 0.72 20.0 0.0 205.0 4 1.26 1.22 0.87 20.0 0.0 205.0 5 0.73 0.71 0.50 20.0 34.5 205.0 6 1.47 1.43 1.00 20.0 34.5 205.0 7 2.21 2.14 1.50 20.0 34.5 205.0 8 2.94 2.86 2.00 20.0 34.5 205.0 9 0.73 0.71 1.00 20.0 0.0 205.0 10 0.73 0.71 1.00 20.0 34.5 205.0 11 0.73 0.71 1.00 20.0 70.6 205.0 12 0.73 0.71 1.00 20.0 70.6 328.3 13 0.73 0.71 1.00 20.0 70.6 128.4
silicate versus operating conditions. The equilibrium calculations were solved using the PHREEQC Charlton and Parkhurst [4] speciation calcu-lation software. The initial molalities of the Na, Mg, Si and Cl species, the initial water mass, the temperature, as well as the equilibrium equation for the formation of magnesium silicate, constitute the input data. The software calculates, in particular, the activity coefficients, the activities and the molalities of the various species present in solution, the initial supersaturations of the magnesium silicate and the silica, as well as the temperature, the pH and the conductivity of the suspension (solu-tion with solids).
The PHREEQC software resolve the following system (see 8) includ-ing equations of:
• electroneutrality;
• material balances of some species (Mg, Si, O, H, Na); • ionic strength of the solution;
• activity of water.
The equilibria involved in the precipitation reaction, which is re-sponsible for the formation of amorphous magnesium silicate Si4Mg3O11, nH2O and amorphous silica SiO2are presented in theTable
2. Only the main species and their equilibrium are presented in this table. Some species, with a very low molality, are not presented. The species in solution are: OH−, H+, H
2O, Cl−, Mg2+, MgOH+, Na+,
H4SiO4, H3SiO4−, H2SiO42−, SiO2and Si4Mg3O11, 5H2O.
For each chemical equilibrium, the associated equilibrium constant Kor the solubility product Ksis written according to the activities ai
spe-cies in solution and its value or expression as a function of the temper-ature T, if known, are specified. These values or expressions of the equilibrium constant or solubility product are provided by the database of speciation software, PHREEQC [4]. The pH of solution is calculated from the activity of the species H+and is given by the following relation
(PHREEQC software database):
pH ¼ −log aðHþÞ ð2Þ
Since the equilibrium constant of amorphous magnesium silicate is not implemented in the PHREEQC software database, it has been identi-fied. The chemical equilibrium for the magnesium silicate has been cho-sen in agreement with those of talcum available in PHREEQC database. A paper concerning chemical properties of an amorphous magnesium sil-icate present in detail its determination [6].
TheTable 3presents the models used to calculate the activity coeffi-cient γi, depending on the species i considered. For the charged species,
the choice of the model depends on the knowledge of the specific pa-rameters of the species, a0and b. In cases where these parameters are
known, their values are specified in the table.
The values of the ionic strength calculated for the different experi-ments are between 0.7 and 2.7 mol·kg−1. These values are higher
Table 2
Chemical equilibria, associated K constants and solubility products Ks(∗phreeqc.dat database of PHREEQC software, [4]).
Chemical equilibrium K equilibrium constant log(K)∗
(Si4Mg3O11, 5H2O)solide+ 6H+= 3Mg2++ 4H4SiO4
Ks1= a3 Mg2þa4H4SiO4 aSi4Mg3O11;5H2Oa6Hþ ! éq Unknown (SiO2)solide+ 2H2O = H4SiO4
Ks2= aH4SiO4 a2 H2OaSiO2 ! éq −3,98 Mg2++ H 2O = MgOH++ H+ K3= aHþaMgOHþ aMg2þaH2O ! éq −11,44 H4SiO4= H3SiO4−+ H+ K 4= aHþaH3SiO−4 aH4SiO4 ! " eq −302,3724-0,050698*T+15 669; 69 T +108,18,466*log(T)− 1 119 669; 0 T2 H4SiO4= H2SiO42−+ 2H+ K5= a2 HþaH2SiO2−4 aH4SiO4 ! eq −294,0184-0,050698*T+15 669; 69 T +108,18,466*log(T)− 1 119 669; 0 T2 H2O = OH−+ H+ K e= aHþaOH − aH2O ! " eq −283,971-0,05069842*T+13 323; 0 T +102,24,447*log(T)− 1 119 669; 0 T2 Table 3
Coefficients of activity of different species in solution (∗PHREEQC software database: phreeqc.dat).
Model Species in solution Specific parameters∗
Debye-Hückel extended equation H+ Ion: a0= 0, 90, b = 0
Ib0,05 mol·kg−1 OH− a0= 0, 35; b = 0 a0and b known Na+ a0= 0, 40; b = 0,075 log10ðγiÞ ¼ −Az 2 i ffiffi I p 1 þ Ba0p þ bIffiffiI Mg2+ a0= 0, 55; b = 0,200 Cl− a0= 0, 35; b = 0,015
Davies extended equation MgOH+
Ib0,5 mol·kg−1 H 3SiO4− – a0and b unknown H 2SiO42− log10ðγiÞ ¼ −Az2i vpffiffiI 1 þp −0; 3IffiffiI ! Setchenow equation Ib0,002 mol·kg−1 H 4SiO4 – Neutral species log10(γi) = 0, 1I
I, ionic strength of the solution.
zi, ion charge i.
a0and b, specific parameters of the considered ionic species.
Aand B, temperature dependent constants given by
A= 9, 37 ∗ 10−4∗ T + 4, 86 ∗ 10−1(determined from Bard et al. [2])
than the application ranges of the models presented in theTable 3. Cal-culation errors probably follow from this.
Amorphous magnesium silicate solubility was estimated from the precipitation using PHREEQC, a computer program for speciation
calculations. The equation between the equilibrium constant of amor-phous magnesium silicate Ksand the temperature was determined:
logKs¼ −0:2399 % T þ 108:82 ð3Þ 0 0.5 1 1.5 2 2.5 3 3.5 particle size ( m) 10-5 1010 1012 1014 1016 1018 1020 1022 population density n (m -3.m -1) 13 min 16 min
Fig. 2. Number population density in the system 1 ([MgCl2, 6H2O] = 0.73 mol·kg−1, [Na2SiO3, 5H2O] = 0.71 mol·kg−1, [HCl] = 0.50 mol·kg−1, PUS= 34.5 W).
with the chemical equilibrium of amorphous magnesium silicate: Si4Mg3O11;5H2O
ð Þsolidþ 6Hþ¼ 3Mg2þþ 4H4SiO4 ð4Þ and the equilibrium constant of amorphous magnesium silicate: Ks¼ a3 Mg2þa4H4SiO4 aSi4Mg3O11;5H2Oa6Hþ ! eq ð5Þ The knowledge of the equilibrium constant of amorphous magne-sium silicate enables to calculate its supersaturation ratio S:
S ¼aSi4Mg3O11a5H2O
Ks ð6Þ
3.2. Precipitation process
The precipitation process of magnesium silicate and silica is un-known. Chemical equilibria are studied in the mixing system for each experiment in order to see if the precipitation of two solids can occur. Two hypotheses were tested.
3.2.1. Hypothesis 1
Amorphous magnesium silicate alone precipitates. It is assumedsupposed to be supersaturated in the mixing system or in the vessel. Amorphous silica can be supersaturated or undersaturated. Mag-nesium silicate supersaturation ratio is adjusted to obtain pHcalculated=
pHexperimental. The Moles number of magnesium silicate solid is
calculated. 3.2.2. Hypothesis 2
Both solids precipitate. Silica is supposed to be at the equilibrium state so its supersaturation ratio is equal to 0. Magnesium silicate super-saturation ratio is adjusted to obtain pHcalculated= pHexperimental. The
Moles number of both solids are calculated.
To make these calculations, initial molalities of species Na, Si, Cl and Mg, total mass of water, final temperature of the suspension and chem-ical equilibria constitute the input data. Chemchem-ical equilibria have been previously presented by Dietemann et al. [6]. The program notably
calculates activity coefficients, final activities and molalities of different species in solution, the temperature and the pH of the suspension with-out and with precipitated solid.
4. Population balance modelling
The measurements of residence time distributions have shown that with a medium flowrate without ultrasound or with all flowrates with ultrasound, the mixing system can be considered as perfectly mixed. Measurements of residence time distribution with water were made in silent condition and with ultrasound. We chose as tracer an electro-lyte (potassium chloride) dissolved in water at a concentration of 260 g·L−1and we made a negative step. We showed that from medium
flow without ultrasound (205 g·min−1) and at all flow rates studied
with ultrasound, the mixing system can be considered as perfectly stirred.
The logarithm of the population density of the suspension at the exit of the mixing cell at 13 and 16 min is not linear (Fig. 2). It can be due to the agglomeration phenomenon that can occur during the precipitation process in the mixing system (Fig. 3) or/and to the growth rate that would depend on particles size.
The population balance written with the agglomeration term is given by [16]: rNvδ V$ p−Vpc%−∂ Gð∂VvnvÞ p − Qsnv V þ12 ZVp 0 β Vp1;Vp2 $ %n v$Vp1; t%nv$Vp−Vp1; t%dVp1 −nv$Vp; t% Z þ∞ 0 β Vp 0;Vp $ %n v$Vp0; t%dVp0¼ 0 ð7Þ
with rNvthe secondary nucleation rate (L−1·s−1), δ(Vp− Vpc) the Dirac
function, Vpand Vpcthe volume and the critical volume of a nucleus
(m3), G
vthe growth rate (m·s−3), nvthe population density for a class
iof volume Vpat time t (L−1·m−3), β, the agglomeration kernel
(L·s−1), Q
ssuspension volume flows at the exit of the system (L·s−1)
and V the mixing system volume (L). nvdVpis the number of crystals
by suspension volume unit with a volume ranged in [Vp, Vp+ dVp].
The population balance is resolved by the moment transformation with respect to volume. The ithorder volume moment m
v, jis calculated 10-1 100 101 102 103 particle size ( m) 0 0.5 1 1.5 2 2.5 3 3.5 4 4.5 5 volume (%) system 1 system 2
Fig. 4. Particle-size distributions comparison in systems 1 and 2, for the experiment 5 ([MgCl2, 6H2O] = 0.73 mol·kg−1, [Na2SiO3, 5H2O] = 0.71 mol·kg−1, [HCl] = 0.50 mol·kg−1, PUS=
100 102 0 1 2 3 4 5 min 7 min 100 102 0 2 4 6 5 min 10 min 100 102 0 2 4 6 8 3.5 min 5 min 7 min
a)
b)
c)
d)
e)
f)
g)
h)
i)
j)
m)
k)
l)
100 102 0 2 4 6 8 3.5 min 4.5 min 5.5 min 100 102 0 1 2 3 4 5 4 min 6 min 9 min 12 min 100 102 0 1 2 3 4 5 5 min 7 min 100 102 0 1 2 3 4 5 5 min 100 102 0 2 4 6 5 min 10 min 100 102 0 2 4 6 3.5 min 4.5 min 100 102 0 2 4 6 8 5 min 15 min 30 min 60 min 100 102 0 2 4 6 8 30 min 45 min 60 min 100 102 0 1 2 3 4 5 10 min 15 min 30 min 43 min 100 102 0 2 4 6 15 min 30 min 60 minTable 4
pH, supersaturation ratios at the exit of mixing system and moles numbers calculations (PHREEQC speciation calculations; the kept hypothesis is written in bold characters; 1 = mag-nesium silicate; 2 = silica; a negative moles number means matter must be supplied to form the solid.).
Hypothesis 1 Hypothesis 2
Experiment pHexp pHcalc log(S1) n1(mol) log(S2) n2(mol) pHcalc log(S1) n1(mol) log(S2) n2(mol)
1 11.81 11.81 14.59 7.472*10−2 −0.38 0 2 11.63 11.63 14.62 1.249*10−1 −0.22 0 11.62 16 1.070*10−1 0 −1.590*10−2 3 11.55 11.55 11.83 2.072*10−1 −0.40 0 4 10.60 10.60 7.33 1.936*10−1 0.07 0 5 10.06 10.06 3.05 1.595*10−1 −0.07 0 10.12 3 1.592*10−1 0 −9.680*10−4 6 11.26 11.26 15.48 1.393*10−1 0.26 0 11.28 14 1.460*10−1 0 1.020*10−2 7 9.57 9.57 11.31 2.250*10−1 1.56 0 9.64 5 2.305*10−1 0 4.570*10−2 8 11.26 11.26 16.67 1.498*10−1 0.38 0 11.20 14 1.550*10−1 0 6.890*10−3 9 9.15 9.15 8.50 9.985*10−1 1.74 0 9.10 1 1.069*100 0 1.404*100 10 9.00 9.00 7.76 1.020*100 1.83 0 8.96 0 1.070*100 0 1.408*100 11 9.03 9.03 8.82 1.010*100 1.80 0 8.97 1 1.069*100 0 1.408*100 12 8.70 8.70 6.49 1.042*100 1.83 0 8.86 0 1.070*100 0 1.409*100 13 9.34 9.34 8.78 9.826*10−1 1.85 0 9.31 3 1.070*100 0 1.410*100 Table 5
Amorphous magnesium silicate supersaturation ratio, nucleation and growth rates and agglomeration kernel in the system 2, as a function of process parameters.
Experiment [MgCl2, 6H2O]
(mol·kg−1) [Na(mol·kg2SiO3−1, 5H)2O] [HCl](mol·kg
−1) T (°C) P US(W) QM(g·min−1) Gv(m3·s−1) β (L·s−1) rNv(L−1·s−1) pH log(S) 1 0.52 0.50 0.35 20.0 0.0 205.0 4.4*10−20 1.3*10−11 1.6*1015 11.81 14.59 2 0.73 0.71 0.50 20.0 0.0 205.0 4.1*10−19 3.8*10−11 1.6*1014 11.63 14.62 3 1.03 1.00 0.72 20.0 0.0 205.0 8.7*10−19 3.2*10−11 7.4*1013 11.55 11.83 4 1.26 1.22 0.87 20.0 0.0 205.0 9.4*10−19 2.2*10−11 7.1*1013 10.60 7.33 5 0.73 0.71 0.50 20.0 34.5 205.0 2.3*10−21 3.2*10−13 6.7*1016 10.06 3.05 6 1.47 1.43 1.00 20.0 34.5 205.0 7.8*10−20 1.7*10−11 7.5*1015 11.26 15.48 7 2.21 2.14 1.50 20.0 34.5 205.0 2.0*10−19 1.6*10−11 1.9*1015 9.57 11.31 8 2.94 2.86 2.00 20.0 34.5 205.0 3.9*10−19 1.0*10−11 5.6*1014 11.26 16.67 9 0.73 0.71 1.00 20.0 0.0 205.0 4.9*10−19 3.4*10−11 7.0*1013 9.15 8.50 10 0.73 0.71 1.00 20.0 34.5 205.0 4.0*10−20 6.0*10−10 1.9*1017 9.00 7.76 11 0.73 0.71 1.00 20.0 70.6 205.0 1.8*10−21 7.5*10−15 1.2*1015 9.03 8.82 12 0.73 0.71 1.00 20.0 70.6 328.3 4.5*10−20 6.5*10−12 4.5*1015 8.70 6.49 13 0.73 0.71 1.00 20.0 70.6 128.4 9.7*10−22 1.7*10−12 3.5*1017 9.34 8.78 Table 6
Nucleation and growth rates and agglomeration kernel in systems 1 and 2 for the experiment 5.
System [MgCl2, 6H2O](mol·kg−1) [Na2SiO3, 5H2O](mol·kg−1) [HCl](mol·kg−1) T (∘C) PUS(W) QM(g·min−1) Gv(m3·s−1) β (L·s−1) rNv(L−1·s−1) pH
1 0.73 0.71 0.50 20.0 34.5 205.0 3.3*10−21 4.8*10−13 4.8*10−16 10.06 2 0.73 0.71 0.50 20.0 34.5 205.0 2.3*10−21 3.2*10−13 6.7*10−16 10.10 10-1 100 101 102 103 particle size ( m) 0 1 2 3 4 5 6 volume (%)
with ultrasound (exp.5) without ultrasound (exp.2)
from the following equation: mv; j¼ Z þ∞ 0 V j pnvdVp ð8Þ
The population balance (Eq.(7)) can be written with volume mo-ments. Eq.(7)is multiplied by the term VpjdVpand integrated between
0 and +∞: Mv; j;aggþ Zþ∞ 0 rNvδ Vp−Vpc $ % Vj pdVp −Zþ∞ 0 ∂ Gð vnvÞ ∂Vp V j pdVp− Z þ∞ 0 Qsnv V V j pdVp¼ 0 ð9Þ
Tavare [16] has showed that Eq.(9)can be written:
0
ð ÞjrNvþ Gvjmv; j−1−QVsmv; jþ Mv; j;agg¼ 0 ð10Þ According to Hulburt and Katz [11], the kthorder volume moment of
the agglomeration term is written, in a case of a constant agglomeration kernel β: Mv;k;agg¼ β 12 Xk j¼0 k j ! " mv; jmv;k− j 0 @ 1 A−mv;0mv;k 2 4 3 5 ð11Þ with kj ! " ¼j!ðk−jÞ!k! and k = 0, 1, 2, … 0.5 1 1.5 2 2.5 3
initial magnesium chloride molality (mol/kg) 10-22 10-20 10-18 G v (m/s) without ultrasound with ultrasound 0.5 1 1.5 2 2.5 3
initial magnesium chloride molality (mol/kg) 10-14 10-12 10-10 (L/s) without ultrasound with ultrasound 0.5 1 1.5 2 2.5 3
initial magnesium chloride molality (mol/kg) 1010 1015 1020 r n ( L -1/s) without ultrasound with ultrasound
Fig. 7. Nucleation and growth rates and agglomeration kernel versus initial reactants molalities and use of ultrasound.
10-1 100 101 102 103 particle size ( m) 0 1 2 3 4 5 6 7 8 volume (%) 0.0 W (exp.9) 34.5 W (exp.10) 70.6 W (exp.11)
The 0th, 1thand 2thorder volume moments are calculated from the
last equation (Huburt and Katz [11]):
Mv;0;agg¼ −β m2 v;0 2 ð12Þ Mv;1;agg¼ 0 ð13Þ Mv;2;agg¼ βm2v;1 ð14Þ
Calculations of moments are presented in Appendix 1.
So population balances for the moments of orders 0, 1 and 2 are ob-tained as: rNv−QVsmv;0−β m2 v;0 2 ¼0 ð15Þ Gvmv;0−QVsmv;1¼ 0 ð16Þ 2Gvmv;1−QVsmv;2þ βm2v;1¼ 0 ð17Þ
Eq.(16)enables to calculate Gv:
Gv¼τmmv;1
v;0 ð18Þ
with τ ¼QV s ! "
the residence time in the mixing system. The agglomeration kernel β is determined from Eq.(17):
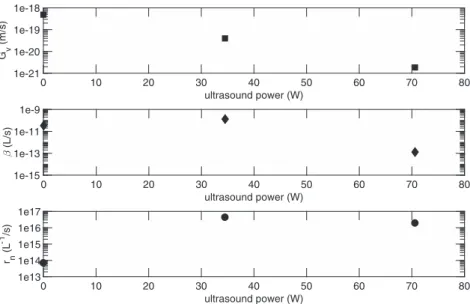
β ¼τm−2 v;0þ mv;2 τm2 v;1 ð19Þ 0 10 20 30 40 50 60 7 0 ultrasound power (W) 1e-15 1e-13 1e-11 1e-9 (L/s) 0 10 20 30 40 50 60 7 0 ultrasound power (W) 1e13 1e14 1e15 1e16 1e17 rn (L -1/s) 0 10 20 30 40 50 60 7 0 ultrasound power (W) 1e-21 1e-20 1e-19 1e-18 Gv (m/s)
Fig. 9. Nucleation and growth rates and agglomeration kernel versus ultrasound power.
10-1 100 101 102 103 particle size ( m) 0 0.5 1 1.5 2 2.5 3 3.5 4 4.5 5 volume (%) 0.73 mol.kg-1 (exp.5) 1.47 mol.kg-1 (exp.6) 2.21 mol.kg-1 (exp.7) 2.94 mol.kg-1 (exp.8)
Eq.(15)enables to determine rNv:
rNv¼ mv;2m2v;0
2τm2
v;1 ð20Þ
5. Results and discussion
5.1. Size distribution and pH of suspension
Fig. 4shows particle-size distributions at the exit of the mixing sys-tem (syssys-tem 1) and at the exit of the tube connecting the mixing syssys-tem and the stirred vessel (system 2). Both distributions are identical. More-over, the pH of the suspension is almost identical in two locations for system 1 (the pH is 10.06) and for the system 2 (the pH is 10.10). There-fore no phenomenon occurs inside the tube. Nucleation, growth and ag-glomeration phenomena take place inside the mixing system. To
calculate nucleation and growth rates and agglomeration kernel, particle-size distributions at the exit of the tube (system 2) and the mixing system volume (system 1) are considered.
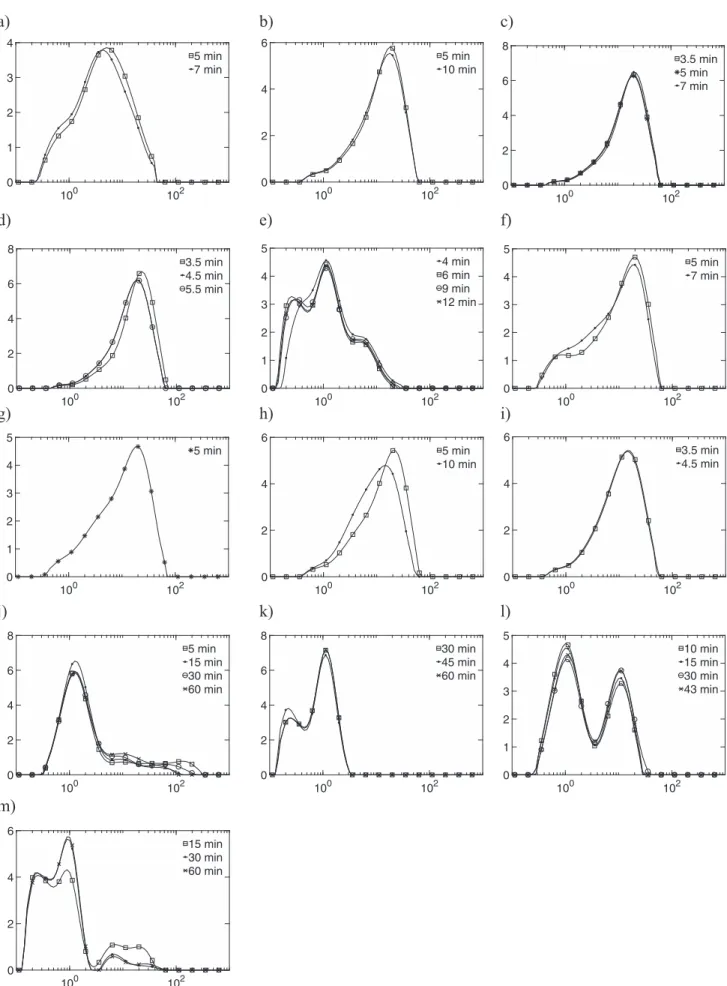
Fig. 5shows temporal particle-size distribution evolution for every experiment. Suspension sampling times are higher than 15 times the residence time τ. Apart from experiments 8 and 10 (Fig. 5sub-plots h and j), particle-size distributions are stable, so the system is stationary. For readability, the labels of axis are not written on Figures. The x-axis represents the size in μm and the y-x-axis the percentage volume of particles. (sub-plots a, b, …, m correspond to experiments 1, 2, …, 13 respectively).
5.2. Speciation calculations
Table 4presents results of speciation calculations that were made for each experiment in the mixing system. pHexpis the experimental pH.
For two assumptions, calculated pH, pHcalc, supersaturation ratios, S,
and moles numbers, n, are given. Results corresponding to the kept
10-1 100 101 102 103 particle size ( m) 0 1 2 3 4 5 6 7 volume (%) 0.52 mol.kg-1 (exp.1) 0.73 mol.kg-1 (exp.2) 1.03 mol.kg-1 (exp.3) 1.26 mol.kg-1 (exp.4)
Fig. 11. Effects of initial reactants molalities on the particle-size distribution, during experiments without ultrasound.
102 104 106 108 1010 1012 1014 1016 1018 magnesium silicate supersaturation ratio
10-22 10-20 10-18 G v (m/s) without ultrasound with ultrasound 102 104 106 108 1010 1012 1014 1016 1018 magnesium silicate supersaturation ratio
10-14 10-12 10-10 (L/s) without ultrasound with ultrasound 102 104 106 108 1010 1012 1014 1016 1018 magnesium silicate supersaturation ratio
1010 1015 1020 r n (L -1/s) without ultrasound with ultrasound
hypothesis are in bold characters. Magnesium silicate is represented by the subscript 1 whereas silica is represented by the subscript 2.
According to speciation calculations, in the mixing system, amor-phous magnesium silicate would precipitate alone. It is supersaturated at the exit of the mixing system so its precipitation would end inside the vessel. With some operating conditions (hydrochloric acid excess, experiments 7 and 9 to 13), amorphous silica is supersaturated at the exit of the mixing system. Its precipitation kinetics would be slow so that it doesn't precipitate in the mixing system. However, it is difficult to determine if silica precipitates during or after reactants addition. At the end of the synthesis, with the highest hydrochloric acid excess, amorphous silica is slightly supersaturated. In the most of experiments, amorphous silica is at the equilibrium state at the end of the synthesis. Operating conditions (reactants molalities, ultrasound power dissi-pation PUSand total reactants mass flow QM) of experiments are
pre-sented inTable 5. (SeeTable 6.)
5.3. Application of the population balance modelling
Volume moments are calculated from each particle-size distribution and medium volume moments are then calculated (seeAppendix A).
Medium nucleation and growth rates and agglomeration kernel are determined from these medium volume moments. These medium values are those presented inTable 5as function of magnesium silicate supersaturation ratio (log(S)).
5.3.1. Study of process parameters effects on crystallization rates 5.3.1.1. Ultrasound effects.Ultrasound power effects on particle-size dis-tribution are studied from experiments 2 and 5. Both experiments were made with the same initial reactants molalities (Table 5).Fig. 6shows effects of ultrasound on the particle-size distribution. Both distributions are very different. Particle sizes are smaller than 20 μm with ultrasound as against 70 μm without ultrasound. Ultrasound would thus appear to reduce particle sizes and prevent agglomerates from forming. This re-sult has been already showed by Dodds et al. [7] about the ultrasound-assisted crystallization of BaSO4, K2SO4, TiO2and sucrose
particles.
Nucleation and growth rates and agglomeration kernel evolutions are represented inFig. 7versus initial reactants molalities and the use of ultrasound. Results of experiments 2 and 5 are circled on the figure. The ultrasound use causes the decrease of the growth rate and the
agglomeration kernel, and the increase of the nucleation rate. Moreover, without considering initial reactants molalities, the ultrasound use gen-erally causes the growth rate decrease and the nucleation rate increase. Magnesium silicate supersaturation ratio increases when the precip-itation operation occurs without ultrasound (Table 5).
Therefore ultrasound-assisted precipitation would enable to synthe-size smaller particles and agglomerates by decreasing the supersatura-tion ratio, the growth rate and the agglomerasupersatura-tion kernel and increasing the nucleation rate.
Ultrasound power effects on particle-size distribution can be studied from experiments 9, 10 and 11. These experiments were made with the same initial reactants molalities (Table 5). Particle-size distributions of these experiments are presented inFig. 8. The increase of the ultrasound power enables particles and agglomerates sizes to decrease. This effect of ultrasound power has been already showed by Gatumel [10].
Fig. 9shows effects of the ultrasound power on nucleation and growth rates and agglomeration kernel. When the ultrasound power in-creases, the nucleation rate firstly increases and then seems to decrease. This result has been formerly found by Gatumel [10]. The growth rate decreases and the agglomeration kernel decreases from 34.5 W.
On the other hand, magnesium silicate supersaturation ratio is not affected by the ultrasound power (Table 5).
The increase of ultrasound power would cause a decrease of the growth rate and the agglomeration kernel and an increase of the nucle-ation rate. But this increase is limited. From some ultrasound power value, the nucleation rate doesn't increase any more. These effects would explain the decrease of particles and agglomerates sizes as a re-sult of the ultrasound power increase.
5.3.1.2. Initial reactants molalities effects.Effects of initial reactants mo-lalities on the particle-size distribution can be studied from experiments 5 to 8 when the precipitation is ultrasound-assisted and from experi-ments 1 to 4 when the precipitation is not ultrasound-assisted.
Particle-size distributions of experiments 5 to 8 (ultrasound-assisted precipitation) are presented inFig. 10. In this range of initial reactant molalities, particle-size distribution is strongly influenced.
Between [MgCl2, 6H2O] = 0.73 mol·kg−1and [MgCl2, 6H2O] =
1.47 mol·kg−1, distribution clearly shifts towards large sizes. Over
1.47 mol·kg−1, particle-size distribution does not vary a lot. These
re-sults have been observed with other solids, such as strontium molyb-date by Sohnel [15] and Dos Santos Nicolau Esteves Cameirao [3].
10-1 100 101 102 103 particle size ( m) 0 1 2 3 4 5 6 7 volume (%) 128.7 g.min-1 (exp.13) 205.0 g.min-1 (exp.11) 328.3 g.min-1 (exp.12)
Similar results are observed from experiments 1 to 4 (no-assisted precipitation) (Fig. 11). An effect of initial reactants molalities on particle-size distribution is observed between 0.52 and 0.73 mol·kg−1: particles and agglomerates sizes decrease when
mo-lalities decrease. Up to 0.73 mol·kg−1, the particle-size distribution
doesn't vary any more. The molality from which the size distribution doesn't vary seems to be a function of the ultrasound power.
InTable 5, we can observe magnesium silicate supersaturation ratio decreases when initial reactants molalities increase, when the precipita-tion is not ultrasound-assisted. Moreover, when this supersaturaprecipita-tion ratio increases, the nucleation rate and the agglomeration kernel in-crease too, whereas the growth rate dein-creases (Fig. 12).
Concerning the ultrasound-assisted precipitation (experiments 5 to 8), magnesium silicate supersaturation ratio conversely varies: it in-creases when initial reactants molalities increase. When this supersatu-ration ratio increases, the growth rate and the agglomesupersatu-ration kernel increase, whereas the nucleation rate decreases. This evolution of the nucleation rate is the opposite of the one that is usually observed. In-deed, the nucleation rate generally increases when the supersaturation ratio increases, as the following equation shows it [16]:
Jsec¼ kmj
jSb ð21Þ
with k a coefficient, mjthe ithorder volume moment and S the
supersat-uration ratio.
In this study, we consider the secondary nucleation rate Jsecbecause
the system is continuous and magnesium silicate particles are already formed in the suspension.
To explain the observed nucleation rate evolution, we suppose the global nucleation rate Jsecis made up of two elements: the secondary
nucleation rate JsecnoUSand a nucleation rate that leads to ultrasound JsecUS:
J ¼ Jsecþ JUS ð22Þ
At high supersaturation values (higher than 1010in this study) and
at high solid concentration (between 0.0639 and 0.1145 kg·L−1), we
suppose the acoustic wave is weaken by the solid. Ultrasound effect would be inhibited because solid concentration is too high. The leading component of the global nucleation rate would be the secondary nucle-ation rate Jsec. The nucleation rate due to ultrasound would be negligible.
On the other hand, at low supersaturation values (103.05in this
study), the solid concentration is low too (0.0408 kg·L−1). Ultrasound
effect would not be inhibited, so the nucleation rate due to ultrasound JUSwould be leading.
So we suppose that, if the acoustic wave was not weaken by the solid in the suspension, the global nucleation rate J would be higher, because the nucleation rate due to ultrasound JUSwould be higher. If these
hy-pothesis were true, the global nucleation rate would increase when the supersaturation increases, that would agree with works of other authors.
5.3.1.3. Reactants flow rate effects. Experiments 11 to 13 enable to study effects of reactants flow rate on the particle-size distribution.Fig. 13
represents particle-size distributions of these three experiments. When reactants flow rate decrease from 328.3 g·min−1 to
205.0 g·min−1, the distribution shifts towards fine particles. When
re-actants flow rate decrease from 205.0 to 128.4 g·min−1, the distribution
width slightly changes but proportions of both particles populations change. Large particles population proportion (sizes about 1 μm) de-creases whereas fine particles population proportion inde-creases (sizes about 220 nm).
Fig. 14shows nucleation and growth rates and agglomeration kernel versus reactants flow rates. The comparison of results from experiments made with 328.3 and 205.0 g·min−1enables to observe that the growth
rate and the agglomeration kernel decrease when reactants flow rate decreases. The decrease of the growth rate has been already observed by Franke [8] and Zauner and Jones [18] with the precipitation of cal-cium carbonate and calcal-cium oxalate. On the other hand, the nucleation rate slightly varies. So the decrease of particles and agglomerates sizes, when reactants flow rates decrease, is due to the decrease of the growth rate and agglomeration kernel.
When reactants flow rates more decrease (from 205.0 to 128.4 g·min−1), the nucleation rate and the agglomeration kernel
in-crease. The growth rate doesn't change.
Moreover amorphous magnesium silicate supersaturation ratio isn't affected by reactants flow rates (Table 5).
6. Conclusions
Whatever process parameters, amorphous magnesium silicate would precipitate alone in the mixing system. It is supersaturated at the exit of the mixing system so its precipitation would end inside the vessel. An excess of hydrochloric acid causes the precipitation of amor-phous silica inside the vessel. Even if it is slightly supersaturated at the
100 150 200 250 300 350
reactants flow rate (g/min) 1e-22 1e-20 1e-18 G v (m/s) 100 150 200 250 300 350
reactants flow rate (g/min) 1e-13 1e-12 1e-11 1e-10 (L/s) 100 150 200 250 300 350
reactants flow rate (g/min) 1e13 1e15 1e17 rn (L -1 /s)
exit of the mixing system, we suppose its precipitation kinetics to be slow so silica precipitation would occur inside the vessel.
When the precipitation is ultrasound-assisted, the decrease of parti-cles and agglomerates sizes would be due to the increase of the nucle-ation rate and the decrease of the growth rate and agglomernucle-ation kernel. These effects would be intensified by the increase of the ultra-sound power dissipation. However, the increase of the nucleation rate would be limited: from some ultrasound power dissipation, it wouldn't increase any more. Moreover amorphous magnesium silicate supersat-uration ratio would be influenced by the ultrasound use but not by the increase of the ultrasound power dissipation.
Particles and agglomerates sizes also decrease when initial reactants molalities decrease. Two opposite effects of molalities on the amor-phous magnesium silicate supersaturation ratio are observed, depend-ing on the use of ultrasound. If the precipitation is ultrasound-assisted, ultrasound effectiveness would be inhibited when solid concentration increases. The decrease of initial reactants molalities would cause the increase of the nucleation and the decrease of the growth rate and glomeration kernel, that would explain the decrease of particles and ag-glomerates sizes.
Particles and agglomerates sizes finally decrease when reactants flow rate decreases. This effect would be due to the decrease of the nu-cleation rate and agglomeration kernel.
Acknowledgements
The authors acknowledge the Agence Nationale de la Recherche for the financial support of ANR-09-MAPR-0017 project. The authors also thank Ms. M.-A. Piquemal, Ms. H. Leroy and Ms. J. Ferret of Imerys Talc for XRF analyses.
Appendix A. Particles population density calculation
Before calculating nucleation and growth rates and agglomeration kernel, volume moments must be calculated. The three moments are calculated using the inner rectangles method. The particle-size distribu-tion is divided into particles sizes classes. Every class i contains particles whose size is included in the interval [Li; Li+ dLi] and whose volume is
included in the interval [Vi; Vi+ dVi]. The whole of classes covers the
sizes range between 0.02 μm and 2 mm. The size analysis gives the vol-ume fraction %vol, iof particles of every sizes class i. The particles
popu-lation density nv, iis calculated for every sizes class i.
The particle volume Viis written:
Vi¼ ϕvL3i ðA:1Þ
with ϕvthe volume form factor (equal toΠ6for spherical particles).
Viis the medium volume of the class i:
Vi¼Viþ12þ Vi ðA:2Þ
ΔViis the width of the class i:
ΔVi¼ Viþ1−Vi ðA:3Þ
The particles population density of the class i, nv, i, is calculated from
the following equation: nv;i¼%vol;i
MT
ρViΔVi ðA:4Þ
with MTthe mass concentration of particles in the suspension (kg·L−1)
that is calculated from the following equation:
MT¼ 1 msusp ρH2OnsolidMsolid þ ρ1 solid− 1 ρH2O ! ðA:5Þ
with msuspthe suspension mass (kg), ρH2Oand ρsoliddensities of water
and solid (kg·m−3), M
solidthe solid molar mass (kg·mol−1) and nsolid
the solid moles number (mol) that is calculated using the computer software PHREEQC [6] at the exit of mixing system.
The density of the suspension is calculated from the following equa-tion:
ρsusp¼w ρsolidρH2O solidρH2Oþ 1−wð solidÞρsolid
ðA:6Þ
with wsolid¼nsolidmMsolid susp . A.1. Volume moments calculation
The ithorder volume moment m
v, jis calculated from the following
equation: mv; j¼ Z ∞ 0 nvV jdV ðA:7Þ As a result, the 0th, 1thand 2thorder volume moments are:
mv;0¼X i nv;iΔVi ðA:8Þ mv;1¼X i nv;iΔViVi ðA:9Þ mv;2¼ X i nv;iΔViV2i ðA:10Þ
Appendix B. Electro-neutrality equation OH−
½ ' þ Cl½ −' þ H& 3SiO−4' þ 2 H2SiO2−4
h i
− H& þ'− Na& þ'−2 Mgh 2þi− MgOH& þ'¼ 0 ðB:1Þ with [i], the molality of species i in solution (mol/kg water).
B.1. Molar balance on silicon
nSi;0¼ Si½ 'solution% mwaterþ 4nSi4Mg3O11;5H2Oþ nSiO2
¼ H½ 4SiO4' þ H& 3SiO−4'þ H2SiO2−4
h i
( )% mwater
þ 4nSi4Mg3O11;5H2Oþ nSiO2 ðB:2Þ
with mwater, the mass of water (kg). nSi4Mg3O11, 5H2Oand nSiO2represent
respectively the moles number of amorphous magnesium silicate and amorphous silica.
B.2. Molar balance on magnesium nMg;0¼ nMg;solutionþ nMg;solide
¼ mwater Mg2þ
h i
þ MgOH& þ'Þ þ 3nSi4Mg3O11;5H2O
B.3. Molar balance on sodium
nNa;0¼ Na& þ'mwater ðB:4Þ
B.4. Molar balance on oxygen nO;0−16nSi4Mg3O11;5H2O−2nSiO2
−mwater ½OH−' þ MgOH& þ'þ 4 Hð½ 4SiO4'þ H& 3SiO−4'þ H2SiO2−4
h i
( )
¼ 0
ðB:5Þ
B.5. Molar balance on hydrogen balance nH;0−10nSi4Mg3O11;5H2O−mwater
! OH−
½ ' þ H& þ'þ MgOH& þ' þ 4 H½ 4SiO4' þ 3 H& 3SiO−4'þ 2 H2SiO2−4
h i"
¼ 0 ðB:6Þ
B.6. Ionic strength of the solution I ¼ 0; 5X
i zi
ð Þ2i½' ¼ 0; 5!½OH−' þ H& þ'þ Cl½ −' þ 4 Mgh 2þi þ MgOH& þ'þ Na& þ'þ H& 3SiO−4' þ 4 H2SiO2−4
h i"
ðB:7Þ
B.7. Activity of water [Garrels and Christ [9]] awater¼ 1−0:017X
N
i
i½' ðB:8Þ
The two solids are assumed to be pure, therefore their activities aSi4 Mg3O11, nH2Oand aSiO2are equal to 1.
References
[1] F. Baillon, F. Espitalier, C. Cogné, R. Peczalski, O. Louisnard, Chapter 28:
Crystalliza-tion and freezing processes assisted by power ultrasound, in: Juan A. Gallego-Juárez, Karl Graff (Eds.),Power Ultrasonics (1st Edition): Applications of High-Intensity Ul-trasound, Woodhead publishing series in electronic and optical mate-rials, , 2015.
[2]A.J. Bard, R. Parsons, J. Jordan, IUPAC, Marcel Dekker Inc., New York, 1985.
[3] A.A. Dos Santos Nicolau Esteves Cameirao, Étude expérimentale et modélisation
d'une précipitation avec agglomération entre cristaux de morphologies différentes: application au molybdate de strontium, Thèse de l'Institut National Polytechnique de Toulouse, 2007.
[4]S.R. Charlton, D.L. Parkhurst, Modules based on the geochemical model PHREEQC for
use in scripting and programming languages, Comput. Geosci. 37 (2011) 1653–1663.
[5] F. Ciesielczyk, A. Krysztafkiewicz, K. Bula, T. Jesionowski, Evaluation of synthetic
magnesium silicate as a new polymer filler, Compos. Interfaces 17 (2010) 481–494.
[6] M. Dietemann, F. Baillon, F. Espitalier, R. Calvet, P. Accart, S. Del Confetto, M.
Greenhill-Hooper, Evaluation of the physico-chemical properties of an amorphous magnesium silicate synthesized by an ultrasound-assisted precipitation, Chem. Eng. J. 215 (2013) 658–670.
[7] J. Dodds, F. Espitalier, O. Louisnard, R. Grossier, R. David, M. Hassoun, F. Baillon, C.
Gatumel, N. Lyczko, The effect of ultrasound on crystallisation-precipitation pro-cesses: some examples and a new segregation model, Part. Part. Syst. Charact. 24 (2007) 18–28.
[8]J. Franke, A. Mersmann, The influence of the operational conditions on the
precipi-tation process, Chem. Eng. Sci. 50 (1995) 1737–1753.
[9]R. Garrels, J. Christ, Solution, Minerals, and Equilibria, 1965.
[10] C. Gatumel, Précipitation du sulfate de baryum sous ultrasons: effets sur le
micromélange et sur la nucléation, Thèse de l'Institut National Polytechnique de Toulouse, 1997.
[11] H.M. Hulburt, S. Katz, Some problems in particle technology: a statistical mechanical
formulation, Chem. Eng. Sci. 19 (1964) 555–574.
[12] F. Martin, Le talc: un minéral idéal ? Habilitation à Diriger des Recherches,
Université Toulouse III, Paul Sabatier, 1999.
[13] F. Martin, J. Ferret, C. Lèbre, S. Petit, O. Grauby, J.-P. Bonino, D. Arseguel, A. Decarreau,
Procédé de préparation d'une composition de talc synthétique à partir d'une com-position de kérolites, Brevet d'invention français FR2903682 - A1 - 2006, 2006.
[15] O. Sohnel, J.W. Mullin, A.G. Jones, Crystallization and agglomeration kinetics in the
batch precipitation of strontium molybdate, Ind. Eng. Chem. Res. 27 (1988) 1721–1728.
[16] N.S. Tavare, Industrial Crystallization: Process Simulation Analysis and Design,
Ple-num Press, 1995. [17] Tufar, Talc, 2000.
[18] R. Zauner, A. Jones, Mixing effects on product particle characteristics from
![Fig. 2. Number population density in the system 1 ([MgCl 2 , 6H 2 O] = 0.73 mol·kg −1 , [Na 2 SiO 3 , 5H 2 O] = 0.71 mol·kg −1 , [HCl] = 0.50 mol·kg −1 , P US = 34.5 W).](https://thumb-eu.123doks.com/thumbv2/123doknet/12177616.314149/5.892.210.672.116.433/fig-number-population-density-mgcl-mol-sio-hcl.webp)
![Fig. 4. Particle-size distributions comparison in systems 1 and 2, for the experiment 5 ([MgCl 2 , 6H 2 O] = 0.73 mol·kg −1 , [Na 2 SiO 3 , 5H 2 O] = 0.71 mol·kg −1 , [HCl] = 0.50 mol·kg −1 , P US = 34.5 W).](https://thumb-eu.123doks.com/thumbv2/123doknet/12177616.314149/6.892.223.684.115.437/fig-particle-size-distributions-comparison-systems-experiment-mgcl.webp)
![Fig. 6. Effects of ultrasound on the particle-size distribution. ([MgCl 2 , 6H 2 O] = 0.73 mol·kg −1 , [HCl] = 0.50 mol·kg −1 )](https://thumb-eu.123doks.com/thumbv2/123doknet/12177616.314149/8.892.66.840.442.650/fig-effects-ultrasound-particle-size-distribution-mgcl-hcl.webp)