O
pen
A
rchive
T
OULOUSE
A
rchive
O
uverte (
OATAO
)
OATAO is an open access repository that collects the work of Toulouse researchers and
makes it freely available over the web where possible.
This is an author-deposited version published in :
http://oatao.univ-toulouse.fr/
Eprints ID : 4077
To link to this article :
URL : http://www.springerlink.com/content/ur55344107g4/?
p=02ea3afd63634e3abea3f873a8994e34&pi=2
To cite this version :
Bedoussac, Laurent and Justes, Eric (2010). The efficiency of a
durum wheat-winter pea intercrop to improve yield and wheat grain
protein concentration depends on N availability during early
growth. Plant and soil, vol. 330, n° 1-2, pp. 19-35.
Any correspondance concerning this service should be sent to the repository
administrator: [email protected].
Laurent Bedoussac1 and Eric Justes2 (☛)
1
The efficiency of a durum wheat-winter pea intercrop to improve yield and wheat
2
grain protein concentration depends on N availability during early growth
3
Plant and Soil (2010) DOI: 10.1007/s11104-009-0082-2
4
1 Université de Toulouse; INPT; UMR AGIR; ENSAT, 31320 CASTANET TOLOSAN, France
5
2 INRA; UMR AGIR; 31320 CASTANET TOLOSAN, France
6
e-mail: [email protected]7
Phone: 0033(0)5612852508
Fax: 0033(0)5617355379
Abstract
10
Grain protein concentration of durum wheat is often too low, particularly in low-N-input systems. The aim of our study was to
11
test whether a durum wheat - winter pea intercrop can improve relative yield and durum wheat grain protein concentration in
low-12
N-input systems. A 2-year field experiment was carried out in SW France with different fertilizer-N levels to compare wheat
13
(Triticum turgidum L., cv. Nefer) and pea (winter pea, Pisum sativum L., cv. Lucy) grown as sole crops or intercrops in a
row-14
substitutive design. Without N fertilization or when N was applied late (N available until pea flowering less than about 120 kg N
15
ha-1), intercrops were up to 19% more efficient than sole crops for yield and up to 32% for accumulated N, but were less efficient
16
with large fertilizer N applications. Wheat grain protein concentration was significantly higher in intercrops than in sole crops
17
(14% on average) because more N was remobilized into wheat grain due to: i) fewer ears per square metre in intercrops and ii) a
18
similar amount of available soil N as in sole crops due to the high pea N2 fixation rate in intercrops (88% compared to 58% in
19
sole crops).
20
Keywords
21
Complementary resource use, grain protein concentration, land equivalent ratio (LER), nitrogen acquisition, nitrogen fixation,
22
plant competition
23
24
Introduction
24
The intensification of agriculture during the last 50 years has contributed, in some areas, to the appearance of problems such as
25
soil erosion, environmental contamination by fertilizer and pesticides and also selection of diseases, pests, and weeds resistant to
26
chemical treatments (Jackson and Piper 1989; Vandermeer et al. 1998; Griffon 2006). Consequently, the efficiency of agricultural
27
systems needs to be improved and diversification of agro-systems has been proposed as one of several solutions for future
28
agriculture (Altieri 1999; Griffon 2006). Intercropping (IC) - the simultaneous growing of two or more species in the same field
29
for a significant period but without necessarily being sown and harvested at the same time (Willey 1979a) - could be one way to
30
increase the number of species cultivated (Vandermeer et al. 1998; Malézieux et al. 2008). Grass-legume intercrops are common
31
in natural ecosystems, but they are now rarely used in European countries, except in a few cropping systems for animal feeds
32
(Anil et al. 1998). For these reasons there has been a renewed interest in intercropping (Anil et al. 1998; Malézieux et al. 2008)
33
and particularly grain legume-cereal intercrops, which use available resources more efficiently than the corresponding sole crops
34
(Willey 1979ab; Ofori and Stern 1987; Vandermeer 1989; Willey 1990; Fukai and Trenbath 1993). The advantage of such
35
systems can be explained by the fact that the two intercropped species do not compete for exactly the same resource niche and
36
thereby tend to use resources in a complementary way (Snaydon and Satorre 1989; Hauggaard-Nielsen et al. 2001ab). Cereals in
37
particular seem to be more competitive for soil inorganic N (Jensen 1996) compared to grain legumes such as peas, due to faster
38
and deeper root growth and the higher N demand of the cereal (Fujita et al. 1992; Corre-Hellou 2005; Hauggaard-Nielsen et al.
39
2003; Corre-Hellou and Crozat 2005). Consequently, the grain legume increases its reliance on symbiotic N2 fixation (Li et al.
40
2008). Furthermore, growing a grain legume-cereal intercrop at various N levels shows that the grain legume has a higher
41
interspecific competitive ability at lower soil N levels, whereas that of the cereal is lower (Hauggaard-Nielsen and Jensen 2001;
42
Ghaley et al. 2005). The complementary use of N sources between species could be of particular interest in low-N-input cropping
43
systems and organic farming, particularly for cereals with high N requirements such as durum wheat.
44
In 2007, in southern France durum wheat represented 19% of the cereal area and peas 76% of the legume area (AGRESTE 2008).
45
Fulfilling the N demand of durum wheat is crucial to obtaining maximum yield and grain protein concentration (Garrido-Lestache
46
et al. 2004). Consequently, durum wheat is generally fertilized with high levels of N in conventional cropping systems, which can
47
lead to nitrate leaching during the following winter when drainage normally occurs (Abad et al. 2004). In low-N-input systems
48
and organic farming, where N is often a limiting resource, it is difficult to reach the grain protein concentration threshold needed
49
to avoid kernel vitreousness (Garrido-Lestache et al. 2004), which makes it unsuitable for high-quality pasta (semolina)
50
production (Samaan et al. 2006) and hence for human consumption.
The advantages of legume-cereal intercrops are often assumed to arise from the complementary use of N sources by the
52
components of the intercrop (Ofori and Stern 1987; Jensen 1996). Thus, when intercropped, the cereal should have access to a
53
greater proportion of soil inorganic N because of greater interspecific competitive ability explained by a faster and deeper root
54
growth and higher N demand of the cereal (Corre-Hellou and Crozat 2005), whereas the intercropped legume should increase its
55
symbiotic N2 fixation to satisfy its N requirements (Crozat et al. 1994; Voisin et al. 2002) as compared with sole cropping
56
conditions.
57
In Europe, many studies on spring barley-pea intercrops have shown that relative yield and grain protein concentration of
58
intercropped barley are higher than in sole crops (e.g. Hauggaard-Nielsen et al. 2003) and that the yield advantage depends
59
greatly on N fertilization. In particular, Hauggaard-Nielsen and Jensen (2001) showed that spring barley-pea intercrop advantage
60
for yield was maximum without N fertilization and significantly reduced when N was applied, mostly due to pea yield decrease
61
with N supply. Similar results were found for spring wheat-pea intercrops (Ghaley et al. 2005). However, no information on
62
winter wheat-grain legume intercrops is available, despite the fact that winter crops are more suited to southern European
63
conditions in order to avoid water stress.
64
The aim of our study was to evaluate the effects of N availability as modified by fertilization (quantity and splitting of doses) on a
65
durum wheat-winter pea intercrop compared with sole crops by analyzing: i) N resource use, ii) crop production, iii) potential
66
advantages for total yield, dry weight and grain protein concentration and iv) functional relationships between N acquisition and
67
intercropping performances for yield and cereal grain protein concentration in order to better understand species
68
complementarities for N use.
69
70
Materials and methods
70
Site and Soil
71
The experiment was carried out on two experimental fields of the Institut National de la Recherche Agronomique station in
72
Auzeville (SW France, 43°31’N, 1°30’E) in 2005-2006 (Exp. I) and 2006-2007 (Exp. II). The 25-year mean annual rainfall in
73
Auzeville is 650 mm and the mean annual air temperature is 13.7 °C with a mean maximum daily air temperature of 21.9 °C in
74
August and a mean minimum of 6.0 °C in January. The rainfall during the growing seasons was 361 mm and 468 mm for Exp. I
75
and II, respectively, while the 25-year mean was 489 mm for the same period (November-July). Exp. I was characterized by a
76
cold winter and a dry, warm spring, whereas the winter was warm and dry and spring particularly wet during Exp. II. In Exp. I,
77
soil water content was lower during the growing season and water stress higher in spring.
78
Exp. I was carried out on a plot with loamy soil (23% clay, 29% silt and 46% sand) with an available water capacity of 223 mm
79
(0-150 cm). Soil pH in water was 8.0, indicating a calcareous soil as illustrated by the CaCO3 content (20 g kg-1) mainly in the
90-80
120 cm layer (65 g kg-1). The topsoil (0-30 cm) contained 9.4 g kg-1 total C, 0.93 to 1.09 g kg-1 total N, a satisfactory phosphorus
81
and potassium content and a cation exchange capacity (CEC) of 16.0 cmol+ kg-1. Exp. II was conducted on another plot with clay
82
loam soil (26% clay, 34% silt and 28% sand) with an available water capacity of 207 mm (0-150 cm). Soil pH in water was 8.3
83
with a large amount of CaCO3 (87 g kg-1), mainly in the 60-120 cm layer (165 g kg-1). The topsoil (0-30 cm) contained 9.9 g kg-1
84
total C, 1.07 g kg-1 total N, adequate contents of phosphorus and potassium and a CEC of 21.3 cmol+ kg-1. For both experiments,
85
phosphorus, potassium and CEC values were assumed to be non-limiting. The four previous crops on the experimental sites were
86
durum wheat (Triticum turgidum), sunflower (Helianthus annuus), durum wheat and sorghum (Sorghum bicolor) for Exp. I and
87
sunflower, durum wheat, sorghum and sunflower for Exp. II. In Exp. I, 7 t ha-1 sorghum residues with a C:N of 63 were
88
incorporated on September 26, 2005 by tillage (20-25 cm depth). In Exp. II, 4 to 7 t ha-1 of sunflower residues - with a C:N
89
varying between 31 to 55 according to the previous sunflower experiment - were incorporated on September 25, 2006 by tillage
90
(20-25 cm depth) (see details in Table 1).
91
Experimental design
92
Durum wheat (W) (Triticum turgidum L, cv. Nefer, authority Eurodur) and winter pea (P) (Pisum sativum L., cv. Lucy, authority
93
GAE recherche) were grown as sole crops (SC) and as a mixed crop (IC) in a row-replacement design. Three main treatments
94
were compared: i) durum wheat (cv. Nefer) sole crops sown at the recommended density (336 grains m-2), ii) winter pea (cv.
95
Lucy) sole crops sown at the recommended density (72 grains m-2) and iii) durum wheat-winter pea intercrops, each species sown
96
at half of the sole crops densities in alternate rows. In Exp. I, final plant densities were 51 for sole cropped pea, 27 for
intercropped pea, 226 for sole cropped wheat and 112 plants m-2 for intercropped wheat. In Exp. II, plant densities were 56 for
98
sole cropped pea, 27 for intercropped pea, 202 for sole cropped wheat and 101 plants m-2 for intercropped wheat.
99
Wheat stages were identified according to the Zadoks scale (Zadoks et al. 1974).
100
In both experiments, different fertilizer N sub-treatments were evaluated on intercrops and wheat sole crops while pea sole crops
101
were grown only without any N application. In Exp. I we compared: i) no fertilizer-N (N0), ii) low N fertilization (N100) split
102
into two applications of 50 kg N ha-1 at ‘1 cm ear’ (E1cm, Zadoks 30) and ‘flag leaf visible’ (FLV, Zadoks 37) and iii) moderate
103
N fertilization (N180) split into 3 applications of 30 kg N ha-1 at wheat tillering (Zadoks 23), 100 kg N ha-1 at Zadoks 30 and 50
104
kg N ha-1 at Zadoks 37. In Exp. II, four treatments were evaluated: i) no fertilizer-N (N0), ii) one application of 60 kg N ha-1
105
(N60) at Zadoks 37 aimed at increasing grain protein, iii) one application of 80 kg N ha-1 (N80) at Zadoks 30 to increase yield and
106
iv) a moderate N fertilization (N140) split into two applications of 80 kg N ha-1 at Zadoks 30 and 60 kg N ha-1 at Zadoks 37. In
107
Exp. II, the previous crop was rainfed sunflower grown with four levels of fertilizer N: 50, 150, 0 and 100 kg N ha-1 for N0, N60,
108
N80 and N140, respectively, which led to contrasting dynamics of N availability. As a consequence, the N60 treatment was more
109
than the simple effect of a late N supply due to the previous treatment with sunflower, so we chose to name it N60+ in order to
110
underline this point. The two experiments (I and II), combined with various N treatments, aimed to cover a wide range of N
111
availabilities, which can be considered as low-N-input systems for durum wheat, a very N-demanding crop (up to 300 kg N ha-1
112
for a 8 t ha-1 grain target).
113
The experimental layout for both experiments was a randomized split-plot design with N application as main plots and crops as
114
subplots, with five replicates (4 for wheat sole crops in N0 and intercrops in N180) in Exp. I and three replicates (5 for pea sole
115
crops) in Exp. II. N treatments and replicates were separated by a barley (Hordeum vulgare) strip (6 and 12 m wide in Exp. I and
116
II, respectively) in order to avoid border effects due to N fertilization. Each subplot (5 m x 1.84 m) consisted of 11 rows spaced
117
14.5 cm apart. Seeds were sown using a 6-row pneumatic precision experimental prototype drill with 29 cm row separation.
118
Sowing was done in two passes by moving to the right (14.5 cm) for the second pass and by blocking one row of the drill. The
119
intercrop treatment consisted of 6 rows of wheat and 5 rows of pea spaced 14.5 cm apart, with alternate wheat and pea rows.
120
Fungicide-treated seeds were sown on November 8, 2005 (Exp. I) and on November 9, 2006 (Exp. II). In Exp. II, 20 mm of
121
irrigation water was applied after sowing because of the low water content in the topsoil. Weeds were controlled with a mixture
122
of trifluraline (900 g ha-1) and linuron (450 g ha-1) before emergence. Diseases and green aphids were controlled as much as
123
possible with appropriate pesticides.
124
Measurements and analysis
Crop samples taken from 0.5 m² (7 rows, 1.015 m total width, 0.5 m long) were harvested by cutting plants just above the soil
127
surface at: i) the beginning of pea flowering (BPF) (1104 °C d-1 after wheat emergence (AWE) in Exp. I and 1281 °C d-1 AWE in
128
Exp. II), coinciding with ‘flag leaf visible’ stage of wheat (Zadoks 37) and ii) at wheat flowering (WF; Zadoks 69) coinciding
129
with the end of pea flowering (1401 °C d-1 AWE in Exp. I and 1746 °C d-1 AWE in Exp. II). At maturity, plots were mechanically
130
harvested to determine total grain yield. pea sole crops were harvested at pea physiological maturity (1938 °C d-1 AWE in Exp. I
131
and 2143 °C d-1 AWE in Exp. II) while wheat sole crops and intercrops were harvested at wheat physiological maturity (Zadoks
132
92; 2429 °C d-1 AWE in Exp. I and 2824 °C d-1 AWE in Exp. II). Outside rows (2 rows on each side of the plot) were not
133
harvested in order to avoid border effects.
134
Samples were divided into pea and wheat and into grain and straw and dried at 80 °C for 48 h. At crop maturity, DW, yield, N
135
and 15N excess of straw and grain were determined on 150 wheat straws (ears) and 20 pea plants, allowing the calculation of
136
harvest index, N harvest index and grain protein concentration. 15N excess and total-N accumulated in shoots were also measured
137
at the BPF and at WF. Total N and C were analyzed in sub-samples of finely ground plant material using the Dumas combustion
138
method with a Leco-2000 analyser (LECO Corporation, St. Joseph, USA). 15N concentration was determined using an elemental
139
analyzer (Euro-EA, Eurovector, Milan, Italy) coupled to a mass spectrometer (Delta advantage, Thermo-Electron, Bremen,
140
Germany).
141
Soil samples (0-120 cm depth) were collected with a hydraulic coring device with a 15-mm diameter auger (MCL3, Geonor,
142
Oslo, Norway) a few days after sowing on November 14, 2005 (Exp. I) and on November 15, 2006 (Exp. II) and shortly after
143
harvest on July 8, 2006 (Exp. I) and July 19, 2007 (Exp. II). Soil cores were divided into four layers: 0 to 30, 30 to 60, 60 to 90,
144
and 90 to 120 cm. For each sample, five soil cores were taken at a distance of 1 m from each other to take into account soil
145
variability. The five corresponding cores were then pooled before determining water content and mineral-N analysis. Soil mineral
146
N content was determined after KCl (1 M) extraction by colorimetric reactions (Griess and Berthelot reactions for nitrate and
147
ammonium, respectively) in a continuous flow autoanalyzer (Skalar 5100, Skalar Analytic, Erkelenz, Germany).
148
Calculations
149
The data used to calculate N balances are shown in Table 1. Mineralization of N residues, humus N mineralization and N leaching
150
over the growing period were estimated using the STICS soil-crop model (Brisson et al. 2008) and parameter values recently
151
proposed by Justes et al. (2009) for mineralization of N residues. Mineral N available (Navailable) was estimated for the two
152
experiments as follows:153
FUE
N
Nleaching
n
eralizatio
min
N
min
InitialN
N
available=
+
−
+
×
154
with FUE (apparent Fertilizer-N Use Efficiency) calculated as follows:
(
)
N
Nleaching
n
eralizatio
min
N
min
InitialN
Nac
Nac
FUE
=
W−SC(N)−
W−SC(N0)−
∆
N−N0−
∆
N−N0−
∆
N−N0156
where NacW-SC(N) is the N accumulated by the wheat sole crop with N fertilization and NacW-SC(N0) without N fertilization; ∆ is the
157
difference between fertilizer-N and N0 treatments for: i) initial mineral N in soil (∆InitialNminN-N0), ii) net N mineralization from
158
humus plus residues - which could lead to N immobilization - (∆NmineralizationN-N0) and iii) nitrate leaching below 120 cm
159
depth (∆NleachingN-N0).
160
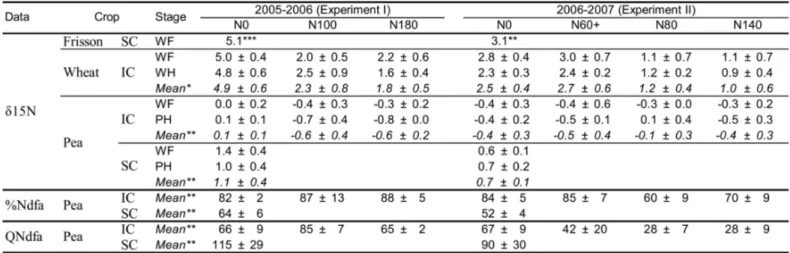
The percentage of plant N derived from N2 fixation (%Ndfa) was determined using the 15N natural abundance method for
un-161
fertilized treatments (Amarger et al. 1979; Unkovich et al. 2008). In N-fertilized intercrops treatments a similar approach was
162
used with some adaptation, i.e. taking into account as a reference crop the durum wheat in the intercrops fertilized at the same
163
rate, making the rather dubious assumption that pea can take up the same mineral N in soil as durum wheat by exploring the same
164
soil volume. The %Ndfa in sole cropped and intercropped pea was calculated using the natural variation in 15N abundance
165
expressed in terms of δ units, which are the parts per thousand (‰) deviation relative to the nominated international standard of
166
atmospheric N2 (0.3663% of 15N), for pea (δ15Npea) and for a reference crop (δ15Nref). The correction factor β reflecting the δ15N of
167
legume shoots that are fully dependent upon N2 fixation was assumed equal to be -1‰ for pea according to Voisin et al. (2002).
168
In this way it is possible to determine the degree of isotopic discrimination between the stable isotopes 14N and 15N to calculate
169
the %Ndfa according to the equation provided by Shearer and Kohl (1986):
170
−
−
×
=
β
δ
δ
δ
ref pea refN
N
N
Ndfa
15
15
15
100
%
171
The calculation assumes that the δ15Nref provides a suitable measurement of the δ15N of soil mineral N available for pea (Peoples
172
et al. 2001; Unkovich et al. 2008). At wheat flowering and pea physiological maturity, the %Ndfa was calculated using as
173
reference the average value between intercropped wheat harvested at wheat flowering and that harvested one month later at wheat
174
physiological maturity. For the unfertilized treatments we also used a non-fixing mutant of pea (P2 cv. Frisson) as reference crop.
175
We considered each N treatment separately in order to take into account the effect of N fertilizer on the δ15N of soil mineral N. To
176
eliminate variations due to soil heterogeneity over short distances we took as δ15Nref the average of all the replicates of the
177
intercropped wheat harvested at wheat flowering and of all the replicates of the intercropped wheat harvested at wheat
178
physiological maturity and only one value for pea Frisson which did not grow very well (and with a developmental shift in
179
comparison with cv. Lucy).
180
Finally, N accumulated from air (QNdfa) was calculated as the product of accumulated shoot N and %Ndfa.
The land equivalent ratio (LER) is defined as the relative land area required when growing sole crops to produce the dry weight
182
or yield achieved in intercrop (Willey 1979a). Dry weight LER for a wheat-pea intercrop is the sum of the partial LER values for
183
wheat (LERDW-W) and pea (LERDW-P), in accordance with De Wit and Van Den Bergh (1965):
184
SC W IC W W DWDW
DW
LER
− − −=
185
SC P IC P P DWDW
DW
LER
− − −=
186
P DW W DW DWLER
LER
LER
=
−+
−187
where DWW-IC and DWP-IC are the intercrops (IC) dry weight per unit area for wheat and pea, respectively; DWW-SC and DWP-SC
188
the dry weight per unit area achieved in sole crops (SC) for wheat and pea, respectively. LERDW was calculated separately for
189
each IC replicate using the replicate values of DW for the numerators and the mean sole crops values across all replicates for the
190
denominators to eliminate the variation in the ratio attributed to sole crop DW variability. Moreover, for LERDW-W we considered
191
the same N treatment for the intercrops and the sole crops while LERDW-P was calculated with the unfertilized pea sole crop as
192
reference because we hypothesized that N is not a limiting resource for legumes and did not affect pea DW. A value of LERDW
193
higher than 1 indicates an advantage to intercrop in terms of improved use of environmental resources (light, carbon, water and
194
N) for plant DW growth. Conversely, when LERDW is lower than 1, it indicates that resources are used more efficiently by sole
195
crops than by intercrops. Moreover, partial LERDW values for wheat and pea can be compared with 0.5 because in intercrop each
196
species is sown at half of the sole crops densities. As a consequence, a partial LERDW above 0.5 indicates that a mixed crop
197
produces more than a sole crop (on a row or plant basis), and vice versa when partial LERDW is below 0.5. By analogy, we
198
calculated the LER by considering the grain yield (Y) and, in order to evaluate the complementary N use between the crops, the
199
accumulated N. We then chose to name them LERY and LERN, respectively.
200
Statistics
201
Analysis of variance was carried out using the AOV procedure of the 2.7.1 version of R software (R development Core Team
202
2007) for each year, considering N treatments as the main factor, crops as a sub-factor and interaction between N treatments and
203
crops. All data were tested for normal distribution using the Shapiro–Wilk test and pairwise comparisons were performed using a
204
two-tailed t-test (P=0.05 or P=0.10) to compare N treatments within crops and crops within N treatments. According to Sheskin
205
(2004), the significance of differences between treatments can be estimated using simple planned comparisons when comparisons
206
have been planned beforehand, regardless of whether or not the omnibus F value is significant. Correlation coefficients calculated
207
from linear regressions were statistically analysed using the table proposed by Fisher and Yates (1938). Finally, confidence
intervals for the means of LER values and partial LER values were calculated from replicates assuming normal distribution
209
according to Sheskin (2004) in order to compare the means of LER with 1 and partial LER values with 0.5.
210
211
Results
211
N availability according to treatments
212
Apparent N available depended greatly on the preceding crops and the differences in their N treatments, experimental N
213
fertilization, N fertilizer efficiency, soil N mineralization (soil + crop residues), initial N mineral content and weather conditions.
214
In Exp. I, soil N mineral content at sowing was 37 kg N ha-1 on average for all N treatments, while in Exp. II it was ca. 30 kg N
215
ha-1 for N0 and N80 and ca. 50 kg N ha-1 for N60+ and N140 (Table 1). Considering the whole growing period, apparent N
216
fertilizer-use efficiency (FUE) was ca. 63% for N100 and N180 in Exp. I and 11%, 58% and 56% for N60+, N80 and N140 in
217
Exp. II, respectively.
218
The mineralization simulated using STICS soil-crop model indicated that ca. 50% of residues and humus net N mineralization
219
would have occurred between sowing and BPF and the other 50% between BPF and harvest due to increasing soil temperature.
220
Throughout the growing period, residues and humus net N mineralization calculated in Exp. I were lower in N0 than in
N-221
fertilized treatments, due to a lower soil organic N content. In Exp. II, net N mineralization calculated was lowest for N0 and
222
N80, highest for N60+ and intermediate for N140.
223
Finally, apparent N available over the whole growing period was lowest for N0 for both experiments (ca. 92 kg N ha-1), highest
224
for N180 (223 kg N ha-1) and intermediate for N60+ and N80 (ca. 147 kg N ha-1) and for N100 and N140 (ca. 170 kg N ha-1). N
225
treatments differed also in the N availability dynamics; indeed, apparent N available calculated from sowing to BPF represented
226
46% of apparent N available over the growing period for N100, 58% for N180, 65% for N0 and N60+ and 90% for N80 and
227
N140.
228
Finally, residual soil mineral N content measured at harvest on 120 cm depth was different between treatments (Table 1). Without
229
N fertilizer, pea sole crop soil mineral N at harvest was significantly higher than that of the intercrop itself higher than that of the
230
wheat sole crop. No difference was found between intercrop and wheat sole crop for N60+ and N80 while mineral N content at
231
harvest was higher by 10 kg N ha-1 on average in intercrop than in wheat sole crop for N100 and N180 (Exp. I) and for N140
232
(Exp. II).
233
N complementarities in intercrop
234
N acquisition and N accumulation in shoots
235
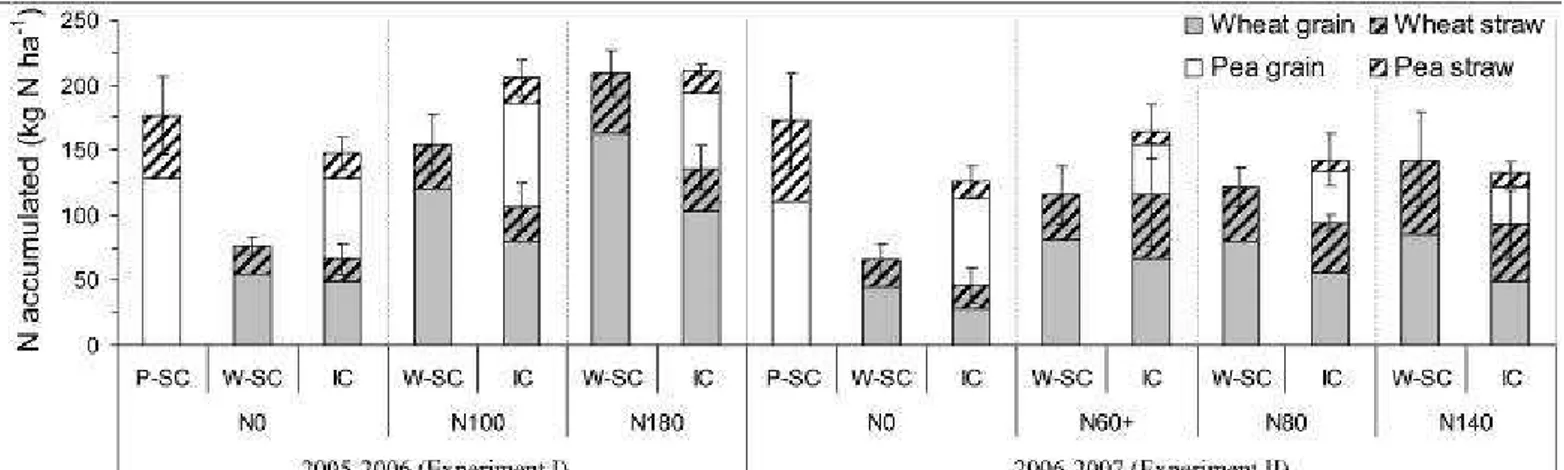
As expected, sole cropped wheat N uptake and then N accumulation in shoots was positively correlated with N fertilization in
236
both experiments (Fig. 1). Similar results were obtained for the intercropped wheat in Exp. I, while in Exp. II the maximum N
uptake was obtained with N60+ and the minimum with N0. Without N fertilizer, sole cropped pea always accumulated
238
significantly (p<0.10) more N than the sole cropped wheat and than the whole intercrop. In N-fertilized plots, the whole intercrop
239
accumulated more N than the sole cropped pea in Exp. I, but less or a similar amount in Exp. II, due to the decrease in the
240
intercropped pea’s apparent accumulated N. The intercrop as a whole always acquired more N than the sole cropped wheat and
241
the difference was reduced and became non-significant with the increase in N availability (N140 and N180). The intercropped
242
wheat accumulated more than 50% as much N as the sole cropped wheat (70% and 78% on average for Exp. I and II,
243
respectively). The higher the N availability, the larger was the difference between intercropped and sole cropped wheat. Finally,
244
intercropped pea N acquisition was reduced with N fertilization compared to N0 except in Exp. I where the maximum was in
245
N100. Moreover, in Exp. II no difference was found between N treatments for pea N accumulated. On average, for all N
246
treatments, crops and years, N harvest index was 0.58 for wheat and 0.76 for pea. In Exp. I, wheat N harvest index was 0.75 for
247
both sole crop and intercrop while in Exp. II it was 0.66 for sole cropped wheat and only 0.58 for intercropped wheat. N harvest
248
index of the intercropped pea was ca. 0.78 whatever the N treatment and experiment while sole cropped pea N harvest index was
249
0.73 and 0.64 for Exp. I and II, respectively.
250
N2 fixation of pea
251
We clearly observed that in our experiments, soil heterogeneity and N-fertilization affected δ15Nref more than the choice of crop
252
reference or stage of sampling (Table 2). Indeed, we found that the non-fixing pea Frisson δ15N was similar to that of the
253
intercropped wheat in N0. No difference was found between intercropped wheat δ15N at flowering and at maturity (Table 2).
254
Moreover, intercropped wheat δ15N was reduced with N fertilization compared with N0, except for N60+ in Exp. II, while no
255
significant difference was found in N-fertilized treatments. The values of sole cropped pea δ15N were slightly lower in Exp. II
256
than in Exp. I and no difference was found between the two sampling dates for both experiments.
257
The calculated percentage of total above-ground N acquisition derived from N2 fixation (%Ndfa) of the intercropped pea
258
calculated was higher than that of the sole cropped pea for all N treatments (on average 85% and 64%, respectively in Exp. I and
259
75% and 52%, respectively in Exp. II). In Exp. I, the %Ndfa of the intercropped pea was almost the same in N-fertilized plots and
260
in N0 while in Exp. II, there was a large difference between the N treatments. A key point is that in Exp. II, N fertilization applied
261
at the ‘visible flag leaf’ wheat stage (N60+), corresponding to the beginning of pea grain filling, seems not to have affected the
262
legume %Ndfa compared with the unfertilized treatment (85 and 84%, respectively). Conversely, N fertilization (80 kg N ha-1)
263
applied earlier at the beginning of wheat stem elongation (N80 and N140 in Exp. II) seems to have reduced the %Ndfa compared
264
with N0 (60% for N80 and 70% for N140)[0].
On the other hand, in Exp. II, the QNdfa of the intercropped pea was the highest for N0, intermediate for N60+ and the lowest for
268
N80 and N140.
269
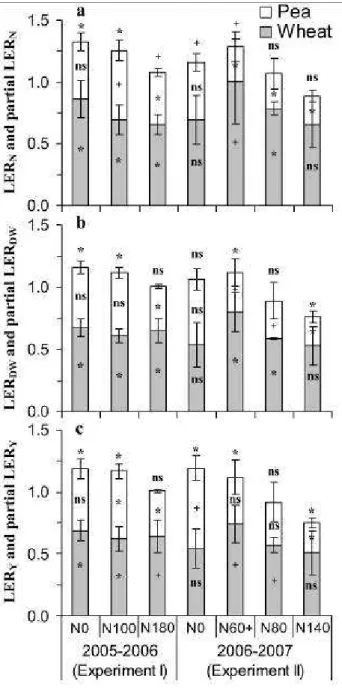
Land equivalent ratio for N accumulated in shoots (LERN)
270
LER values calculated from shoot N accumulation (LERN) were always greater than 1, i.e. 1.15 on average for all N treatments
271
and experiments, indicating an advantage of intercrops compared with sole crops for N accumulation (Fig. 2a). However, LERN
272
were lower when a large amount of N fertilizer was applied (1.08 for N140 in Exp. I, 1.06 for N80 and 0.88 for N140 in Exp. II)
273
compared with N0 (1.32 and 1.16 in Exp. I and II, respectively). Wheat partial LERN values were always greater than 0.5, i.e.
274
0.73 and 0.78 on average for Exp. I and II, respectively. On the other hand, pea partial LERN values were close to or less than 0.5
275
(0.48 and 0.31 on average for Exp. I and II, respectively). Wheat partial LERN values were the highest for N0 in Exp. I and for
276
N60+ in Exp. II and lowest in Exp. I for N100 and N180 and for N0 and N140 in Exp. II. Finally, pea partial LERN values were
277
slightly affected by N fertilization in Exp. I compared with N0 while values were significantly reduced with N fertilization in
278
Exp. II (0.26) compared to N0 (0.46).
279
Intercropping dry weights and yields and wheat grain quality
280
Dry weight (DW) and yield (Y)
281
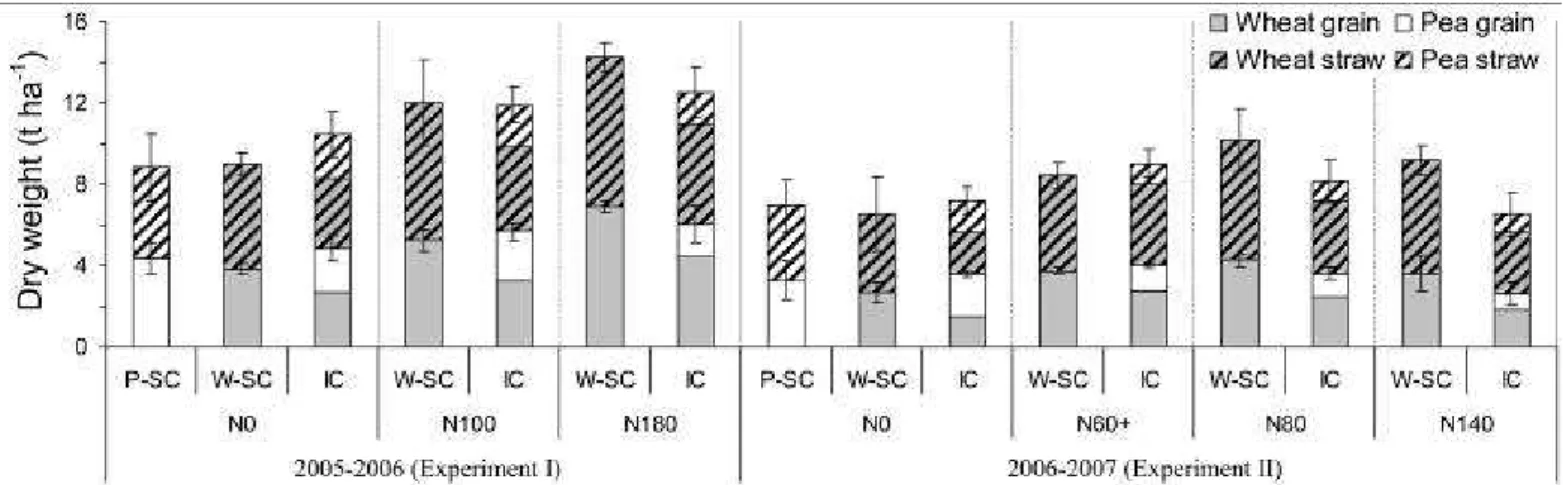
Our results indicate that intercrops shoot biomass dry weight (DW) and yield depended on N availability (Fig. 3). On average, for
282
all N treatments and crops, harvest index was 0.43 for wheat and 0.52 for pea. For both sole cropped and intercropped wheat,
283
harvest index was 0.45 and 0.41 for Exp. I and II, respectively. Sole cropped pea harvest index was 0.49 and 0.47 in Exp. I and II,
284
respectively, while intercropped pea harvest index was 0.52 and 0.54 in Exp. I and II, respectively and on average for all N
285
treatments.
286
The sole cropped and intercropped wheat DW and yield were significantly (p<0.10) increased by fertilizer N in Exp. I (Fig. 3). In
287
Exp. II, sole cropped wheat DW and yield were significantly increased (p<0.10) from N0 to N80, while intercropped wheat DW
288
and yield were highest in N60+ and clearly lowest in N0. For both experiments, intercropped pea DW and yield were
289
significantly reduced with N fertilization (p<0.10), mostly when large amounts were applied (N180 in Exp. I and N140 in Exp.
290
II). Thus, in Exp. I, total intercrop DW and yield were increased when fertilizer N was applied. In Exp. II, total intercrop DW and
291
yield were the highest in N60+ and, surprisingly, the lowest in N140. Finally, wheat and pea sole crops DW and yield were
292
always significantly higher (p<0.10) than their corresponding intercrop DW and yield, but seemed lower than the total intercrop
293
DW and yield for treatments with little or no N fertilizer (N0, N60+ and N100). Conversely, increasing the amount of fertilizer N
(N180 in Exp. I, N80 and N140 in Exp. II), the sole cropped wheat produced significantly more DW and yield than the whole
295
intercrop (p<0.10).
296
Dry weight and yield land equivalent ratios (LERDW and LERY)
297
LER values calculated from shoot biomass dry weight (DW) produced at harvest (LERDW) were approximately 1 or more in all
298
treatments (p<0.05) except for N180 where it was significantly (p<0.05) less than 1 (Fig. 2b). This indicates that resources were
299
used for DW production up to 17% more efficiently in intercrops than in sole crops in low-N conditions. On the whole, LERDW
300
values were reduced with increasing N fertilization, particularly for treatments N180 (Exp. I) and N140 (Exp. II). For all N
301
treatments, wheat partial LERDW values (LERDW-W) were always above 0.5 (p<0.05) and not significantly different from 0.5
302
(p>0.10) for N0 and N140 in Exp. II. On the other hand, LERDW-P values were always equal to or significantly below 0.5
303
(p<0.05).
304
LERY were 1.19, 1.17 and 1.01 for N0, N100 and N180, respectively in Exp. I and 1.19, 1.11, 0.92 and 0.75 for N0, N60+, N80
305
and N140, respectively in Exp. II (Fig. 2c), indicating that resources were finally used more efficiently in intercrops for yield
306
when little or no N fertilizer was applied. Partial LERY-P were 0.49 and 0.64 in N0 in Exp. I and II, respectively and only 0.36 and
307
0.23 for N180 and N140, respectively while partial LERY-W were always about 0.5 or more (p<0.05).
308
The advantage of intercrops over sole crops was greater for N accumulation than for yield or DW, as already mentioned. Indeed,
309
considering all the N treatments and experiments, LER values were 1.15 on average for LERN, but only 1.02 and 1.05 for LERDW
310
and LERY, respectively. On average, wheat partial LER values were higher for N than for DW or yield (0.76, 0.63 and 0.62,
311
respectively), while pea partial LER values were higher for yield (0.43) than for N (0.38) or DW (0.39).
312
Intercropping advantage for wheat grain protein concentration
313
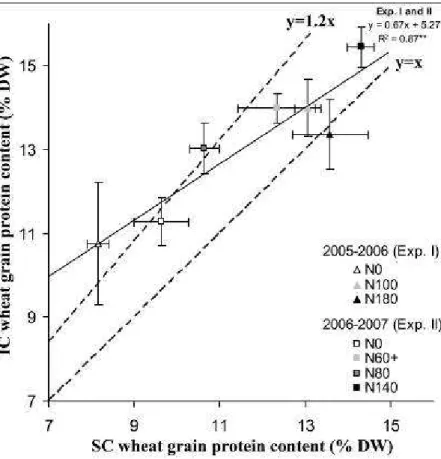
Wheat grain protein concentration was on average 13% (Exp. I) and 15% (Exp. II) higher (p<0.05) in intercrops than in sole crops
314
(Fig. 4) except for N180 (Exp. I). On average for both experiments, the linear regression (Fig. 4) indicates that the lower the sole
315
crop grain protein concentration in N0, the greater was the increase in intercrop wheat grain protein concentration. Both sole
316
cropped and intercropped wheat grain protein concentration were higher in N-fertilized plots compared with N0. The late split of
317
N (N60+) in Exp. II resulted in a large increase in wheat grain protein concentration compared with N0 (28% in sole crop and
318
24% in intercrop) and a similar result was found for N140 in Exp. II (49% in sole crop and 37% in intercrop). On the other hand,
319
the single early split of N (N80) in Exp. II had a small effect on wheat grain protein concentration compared with N0 (10% and
320
16% for sole cropped and intercropped wheat, respectively). In Exp. I, the increase in wheat grain protein concentration compared
Functional relationships
323
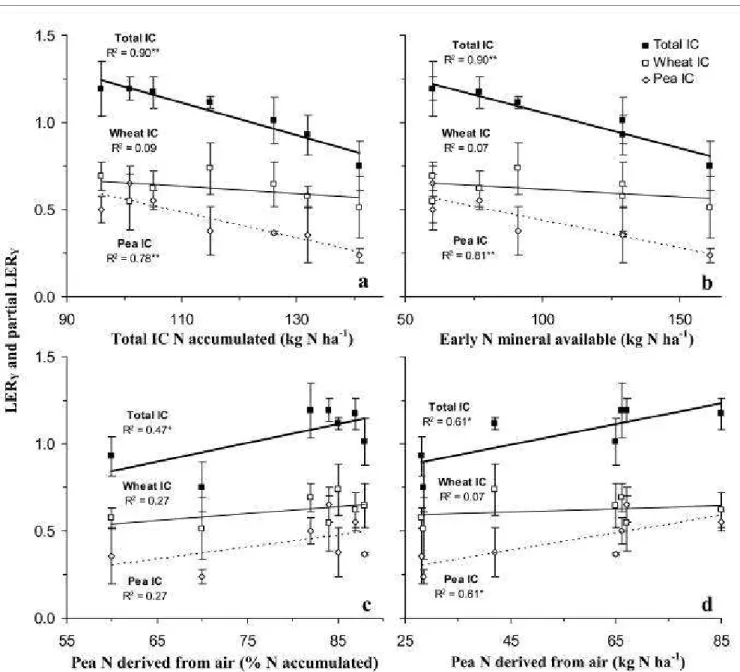
LER values of intercrops for yield (LERY) were strongly negatively correlated (p<0.01) with N accumulated by the whole
324
intercrop at the beginning of pea flowering (Fig. 5a). This was mainly due to the significant reduction of partial LERY values of
325
pea (LERY-P) with N accumulated by the intercrop (p<0.01), while partial LERY values of wheat (LERW-P) remained stable
326
whatever the N accumulated by the whole intercrop (p>0.10). Similar results were found when plotting LERY and partial LERY
327
values with mineral N available until BPF (Fig. 5b). As an interesting result, the two regressions obtained in Figs 5a and 5b
328
indicate that LER exceeded 1 when the N accumulated in intercrop or the early mineral-N available was less than 120 kg N ha-1.
329
On the other hand, LERY was slightly positively correlated (p<0.05) with the percentage of plant N derived from N2 fixation of
330
the legume (Fig. 5c) while LERY-W and LERY-P were not correlated with the %Ndfa (p>0.10). When considering the amount of
331
atmospheric N acquired by pea (Fig. 5d) a significant positive correlation was observed with LERY and LERY-P (p<0.05), but not
332
for LERY-W (p>0.10).
333
Finally, for both experiments and all N treatments, there was a negative correlation between wheat yield and wheat grain protein
334
concentration for a given N level (Fig. 6). In Exp. I, correlations were highly significant for N0 (p<0.05) (Fig. 6a), but not for the
335
N-fertilized treatments (p>0.10). In Exp. II, correlations were significant for N0 (p<0.01), N80 (p<0.01) and N140 (p<0.05) (Fig.
336
6b) and seemed to become weaker as N availability increased.
337
338
Discussion
338
N complementarity in intercrop (IC)
339
As expected, sole cropped wheat N accumulation was positively correlated with N availability (amount of soil mineral N and
340
fertilizer N) and the intercropped wheat accumulated more than 50% more N than the sole cropped wheat. This confirms that the
341
cereal had access to a greater proportion of soil inorganic N when intercropped as compared with the sole cropping situation,
342
supported by the increase in the percentage of plant N derived from N2 fixation (%Ndfa) of pea which agrees with several other
343
studies (e.g. Corre-Hellou 2005; Hauggaard-Nielsen et al. 2003; Corre-Hellou and Crozat 2005). Hence, due to the
344
complementary use of N sources by intercrop components, N accumulated by the whole intercrop was only slightly affected by N
345
fertilization.
346
The calculations of %Ndfa and the choice of reference crop must be analysed carefully (Shearer and Kohl 1986). In order to
347
evaluate the quality of %Ndfa estimation, a sensitivity analysis of the calculation was carried out using i) a non-fixing pea,
348
characterized by very low DW production and early physiological maturity, or ii) the intercropped wheat and iii) two stages of
349
plant sampling. This analysis indicated that the δ15N difference remained the same between intercropped and sole cropped pea
350
and between stages. Thus the %Ndfa of the intercropped pea can be assumed to be always higher than that of the sole cropped pea
351
even if absolute values of calculated %Ndfa are debateable. Indeed, we observed that the variability of δ15N values within a crop
352
stage was similar to that between stages for both wheat and pea in sole crops or intercrops due to i) soil heterogeneity over short
353
distances, ii) crop dynamics and iii) variability in chemical analysis due to sampling. We can assume that the mean of the δ15N
354
values measured at the two stages (wheat flowering and wheat maturity for wheat and WF and pea maturity for pea) was a better
355
estimate of the real value of crop δ15N than when considering stages separately due to spatial heterogeneity and plant sampling
356
bias, as recommended by some authors (e.g. Peoples et al. 2001).
357
A second critical point concerns the calculations of the pea %Ndfa in N-fertilized treatments considering intercropped wheat for
358
the same treatment as the reference plant. This assumption means that wheat and pea used the same proportion of fertilizer-N and
359
soil mineral N. This hypothesis is certainly debatable because of: i) the localization and dynamics of the fertilizer-N in the soil, ii)
360
the interaction between soil mineral N content and symbiotic fixation, iii) soil heterogeneity and iv) differences in crop dynamics.
361
Moreover, δ15N of the N fertilizer is very important; it was -0.4 ± 0.1‰ in Exp. II which agrees with the decrease observed in the
362
δ15N values of wheat in N-fertilized treatments (N applied early) compared with N0. The δ15N of the N fertilizer was not
363
measured in Exp. I, but it must have been negative judging by the decrease in wheat δ15N value in N-fertilized plots; an analysis
%Ndfa were in good agreement with the total N content of plants. A multi-enrichment technique using labelled 15N application
367
must therefore be carried out in these situations for obtaining a more precise estimate of legume %Ndfa (Salon C, pers. comm.).
368
Durum wheat-winter pea intercrops seems to be more efficient than sole crops to improve N use, particularly in low-N systems
369
(Hauggaard-Nielsen et al. 2006), although some other results only showed a small benefit from intercrops (Jensen 1996;
370
Andersen et al. 2004). In particular, intercrops seems more stable over the years than sole crops for N accumulation. Indeed,
371
whatever the N treatments and experiments, N accumulated by the whole intercrop was less variable than by sole crops.
372
Moreover, intercrops appeared more efficient than sole crops for the use of N sources due to the complementary use of soil
373
mineral N and the increase in the %Ndfa of the intercropped pea when the soil mineral N content was low (<30 kg N ha-1 for 0-30
374
cm depth, in agreement with sole cropped pea results obtained by Voisin et al. (2002)) during early intercrop growth (until the
375
booting stage of wheat). Indeed, N fertilization (80 kg N ha-1) applied at the beginning of wheat stem elongation clearly lead to a
376
decrease in %Ndfa. However, when N fertilizer was applied later, at the ‘visible flag leaf’ wheat stage, corresponding to the
377
beginning of pea grain filling, no reduction was observed in the %Ndfa. This is in keeping with: i) the strong decrease in N2
378
fixation activity after the beginning of pea pod filling (Vocanson et al. 2005), ii) the slower N accumulation in later stages of
379
growth (Vocanson et al. 2005) and iii) the increase in weevil damage on nodules observed in Exp. I, also noted by other authors
380
(Corre-Hellou and Crozat 2004).
381
The complementary use of N sources by intercrop components was particularly efficient for the unfertilized treatment indicating
382
that intercropping is well adapted to low-N-input systems. Moreover, the soil mineral N content at harvest was similar for the sole
383
cropped wheat and the intercrops, confirming that intercropping is as efficient as wheat in using soil mineral N. Finally,
384
intercropping could reduce i) nitrate leaching compared to sole cropped pea due to its lower soil mineral N content at harvest and
385
ii) gaseous N losses, by reducing the use of fertilizer N.
386
Intercropping production
387
The LER can be considered as an indicator of crops resource use for plant growth all over the growing season. In our
388
experiments, resources (light, CO2, water, nutrients and N) were used up to 17% more efficiently in intercrops than in sole crops
389
for DW production in low-N conditions. Our results show that wheat took advantage of intercropping by using available
390
resources more efficiently than pea, regardless of N availability. Moreover, wheat benefited from N fertilization indirectly by the
391
increased growth of the wheat improving light and water captures ability and then suppressing pea growth (Ghaley et al. 2005).
392
The yield of wheat depends heavily on N supply as already observed for many cereals (e.g. Gate 1995; Jeuffroy and Bouchard
393
1999; Le Bail and Meynard 2003), and consequently N fertilization increased total grain yield of intercrops due to its strong effect
394
on wheat yield, which exceeded the reduction in pea yield. Hence the yield of the whole intercrop was always at least to the same
as that of the sole crops, except when a large amount of N was applied. LER values calculated from yield (LERY) indicates that
396
resources were used up to 20% more efficiently for yield production in intercrops compared with sole crops when little or no N
397
fertilizer was applied. The negative effect of N fertilization was mainly due to the reduction of pea shoot biomass and yield
398
corresponding to a reduction in N2 fixation. This confirms that intercropping efficiency depends mostly on the complementary
399
use of N between crops and the capacity of the legume to increase the rate of N2 fixation (%Ndfa) for its N nutrition which is
400
enhanced by the fact that the advantage of intercrops compared with sole crops was greater for N accumulation than for yield.
401
Functional relationships
402
The intercrop efficiency for grain production was estimated by LERY and partial LERY values. LERY and LERY-P were negatively
403
correlated with N accumulated by the intercrop at the beginning of pea flowering. This indicates that, in our experiments, the final
404
efficiency for yield of the whole intercrop and of the intercropped pea were already determined at the beginning of pea flowering
405
even when N was applied later on and whatever the weather conditions from the beginning of pea flowering to harvest. This
406
suggests that is possible to predict the final efficiency of the whole intercrop and of the intercropped pea at this stage. However,
407
in order to manage the intercrops, it would be interesting to determine the final efficiency earlier than at the beginning of pea
408
flowering. We hypothesized that N accumulated by the whole intercrop at beginning of pea flowering depends on mineral N
409
available at beginning of pea flowering. This was confirmed by the similar relation observed when plotting LERY and partial
410
LERY against early available N. However, this calculation assumes that apparent N-fertilizer-use efficiency was similar for the
411
sole cropped and the intercropped wheat which seems reasonable since N-fertilizer-use efficiency depended mostly on the
412
weather conditions when N fertilizer was applied which can lead to N losses by volatilization. It is well known that
N-fertilizer-413
use efficiency also depends on crop N demand in relation to physiological stage and varies according to the crop growth rate
414
(Limaux et al. 1999). However, we can assume that N demand of the whole intercrop and of the intercropped wheat were fairly
415
similar in early stages due to row intercropping where plant competition would be almost the same within the row in sole crops
416
and intercrops until stem elongation. Hence, our results confirm that early available N strongly determines the performance of the
417
intercropped pea and of the whole intercrop in comparison with sole cropping situation, but does not significantly modify the
418
growth of intercropped wheat. These results are in keeping with the fact that intercropping efficiency, estimated for total grain
419
production (LERY), was increased when the %Ndfa of pea increased and more specifically when the amount of N derived from
420
air was increased. As a first estimate, in our conditions, early mineral N available or N accumulated in intercrops at beginning of
421
pea flowering must be lower than 120 kg N ha-1 to observe an advantage for yield.
422
It is well known that wheat grain protein concentration depends not only on the amount of N fertilizer but also on N splitting (e.g.
Exp. II which resulted in a large increase in wheat grain protein concentration for both sole crops and intercrops. It has been
425
demonstrated by many authors over the last two decades that for sole wheat crops, yield and grain protein concentration are
426
negatively linearly correlated (e.g. Gate 1995). This was confirmed by the negative correlation between wheat yield and wheat
427
grain protein concentration for a given N level, in particular for low N supplies. This result was also observed for the intercropped
428
wheat. Moreover, as N availability increased the correlation became weaker, indicating that N was not a very limiting resource
429
when a large amount of N was applied. As a consequence, it is likely that the higher grain protein concentration in intercropped
430
wheat than in sole cropped wheat can be mainly explained by the reduction in intercropped wheat yield, which was about 40%
431
lower than that of wheat sole crop. However, it must be assumed that wheat grain protein concentration depends on the
432
interaction with N availability. Indeed, only 15% of the N absorbed by the intercropped pea is unavailable for the intercropped
433
wheat which in our conditions represented only ca. 10 kg N ha-1 on average for both experiments and all N treatments. It seems
434
also that the N dynamics were altered in intercrops because of the changes in the timing of N2 fixation of the legume. Moreover,
435
intercrop allowed a better synchrony of wheat N demand and supply due to the changes in wheat growth as a consequence of
436
inter- and intraspecific competition, leading to a reduced number of ears per square metre for the intercropped wheat. Finally, the
437
wheat grain protein concentration was significantly higher in intercrops than in sole crops, because a larger amount of N was
438
remobilized by each plant and ear due to: i) fewer wheat plants, ears and grains per unit area, but ii) with only slightly less
439
available soil N per square metre than for sole crops, so that more N was available for each grain of wheat.
440
441
Concluding remarks
441
Our results confirm that intercropping is more suited to low-N-input systems than to conventional highly fertilized systems. When
442
N fertilizer is applied, the intercropped legume growth and yield were significantly reduced, while wheat was only slightly
443
affected. On the other hand, when there was a shortage of N during early growth, e.g. when little or no fertilizer was applied late
444
to preceding crops, leaving low residual mineral N, there was a marked complementarity between species, in particular for N
445
acquisition. Intercropping efficiency for N use was greatest with low N availability, due to greater N uptake by wheat. This
446
clearly allowed better wheat grain filling due to: i) the high pea N2 fixation rate in intercrop, making available for the
447
intercropped wheat almost as much soil mineral N per square meter as in the sole crop, ii) fewer wheat plants, ears and grains per
448
unit area in intercrops compared with sole crops and hence iii) a higher efficiency of the cereal to recover N. Our results show
449
that N fertilization of intercrops must be carried out after the end of pea flowering to prevent an adverse effect on N2 fixation.
450
Moreover when the N fertilization occurs after the end of wheat stem elongation (at the booting stage), the N taken up will be
451
largely remobilized to the grain, causing a significant increase in grain protein concentration.
452
Our results must also be related to the species complementarity due to differences in their phenology and physiology. It can be
453
postulated that if there are significant complementarities between the crops for the use of natural resources, particularly N, the
454
optimum N fertilization level for the intercrops is probably lower than that of the average of the individual sole crop. This implies
455
that intercropping may be advantageous when little or no N fertilizer is applied due to a high degree of complementary N use
456
between the two species. Such results have been reported for several cereal-legume intercrops grown in arid, semi-arid, tropical
457
and temperate climates (Fujita et al. 1992; Ofori and Stern 1987; Jensen 1996).
458
Finally, our results confirm that intercropping is a good way to improve the efficiency of N use in agroecosystems, particularly
459
those with a low N availability, because of i) the increase in wheat grain quality, ii) the increase of free atmospheric N input
460
through N2 fixation and iii) the potential reduction of N leaching after legumes. We believe that it is important to investigate the
461
interspecies dynamics that shape the final outcome of intercropping and more precisely inter- and intraspecific competition
462
throughout the whole growing period. This may reveal dynamics in competition, which is critical to determine when the
463
advantage of intercrop begins. Later on, this will be helpful to optimize these innovative agroecosystems, in particular for the
464
choice of durum wheat and pea cultivar traits suited to intercropping, the ideal proportions of species and N fertilization
465
management.
466
467
Acknowledgements
467
This study was supported by the Compte d’Affectation Spéciale du Développement Agricole et Rural (invitation to tender 2005
468
n°431) coordinated by l’Union Nationale Interprofessionnelle des Plantes riches en protéines. The authors would like to thank
469
Alan Scaife and Daniel Wallach for their helpful comments and for English revision. We are also very grateful to the two
470
anonymous reviewers and to Hans Lambers (Editor in chief of Plant and Soil) for their valuable comments on the manuscript.
471
472
References
472
Abad A, Lloveras J, Michelena A (2004) Nitrogen fertilization and foliar urea effects on durum wheat yield and quality and on
473
residual soil nitrate in irrigated Mediterranean conditions. Field Crops Res 87:257-269
474
AGRESTE (2008) Statistique agricole annuelle provisoire - Région Midi-Pyrénées. Ministère français de l’agriculture et de la
475
pêche. http://agreste.agriculture.gouv.fr/IMG/pdf/R7308A03.pdf. Accessed 18 Dec 2008
476
Altieri M (1999) The ecological role of biodiversity in agroecosystems. Agric Ecosyst Environ 74:19-31
477
Amarger N, Mariotti A, Mariotti F, Durr J, Bourguignon C, Lagacherie B (1979) Estimate of symbiotically fixed nitrogen in field
478
grown soybeans using variations in 15N Natural abundance. Plant Soil 52:269-280
479
Andersen M K, Hauggaard-Nielsen H, Ambus P, Jensen E S (2004) Biomass production, symbiotic nitrogen fixation and
480
inorganic N use in dual and tri-component annual intercrops. Plant Soil 266:273-287
481
Anil L, Park J, Phipps R H, Miller F A (1998) Temperate intercropping of cereals for forage: a review of the potential for growth
482
and utilization with particular reference to the UK. Grass Forage Sci 53:301-317
483
Brisson N, Launay M, Mary B, Beaudoin N (2008) Conceptual basis, formalisations and parameterization of the STICS crop
484
model. Quae, Versailles
485
Corre-Hellou G (2005) Acquisition de l’azote dans des associations pois-orge (Pisum sativum L. – Hordeum vulgare L.) en
486
relation avec le fonctionnement du peuplement. Thèse de doctorat en sciences agronomiques de l’école doctorale d’Angers
487
Corre-Hellou G, Crozat Y (2004) N2 fixation and N supply in organic pea (Pisum sativum L.) cropping systems as affected by
488
weeds and peaweevil (Sitona lineatus L.). Eur J Agron 22:449-458
489
Corre-Hellou G, Crozat Y (2005) Assessment of root system dynamics of species grown in mixtures under field conditions using
490
herbicide injection and N-15 natural abundance methods: A case study with pea, barley and mustard. Plant Soil 276:177-192
491
Crozat Y, Aveline A, Coste F, Gillet J, Domenach A (1994) Yield performance and seed production pattern of field-grown pea
492
and soybean in relation to N nutrition. Eur J Agron 3:135-144
Fisher R A, Yates F (1938) Statistical tables for biological, agricultural and medical research. Oliver and Boyd, Edinburg
495
Fujita K, Ofosubudu K G, Ogata S (1992) Biological nitrogen fixation in mixed legume-cereal cropping systems. Plant Soil
496
141:155-175
497
Fukai S, Trenbath B (1993) Processes determining intercrop productivity and yields of component crops. Field Crops Res
34:247-498
271
499
Garrido-Lestache E, López-bellido R J, López-bellido L (2004) Effect of N rate, timing and splitting and N type on bread-making
500
quality in hard red spring wheat under rainfed Mediterranean conditions Field Crops Res 85:213-236
501
Gate P (1995) Ecophysiologie du blé de la plante à la culture. Lavoisier, Paris
502
Ghaley B B, Hauggaard-Nielsen H, Høgh-Jensen H, Jensen E S (2005) Intercropping of wheat and pea as influenced by nitrogen
503
fertilization. Nutr Cycl Agroecosyst 73:201-212
504
Griffon M (2006) Nourrir la planète. Odile Jacob, Paris
505
Hauggaard-Nielsen H, Jensen E S (2001) Evaluating pea and barley cultivars for complementarity in intercropping at different
506
levels of soil N availability. Field Crops Res 72:185-196
507
Hauggaard-Nielsen H, Ambus P, Jensen E S (2001a) Temporal and spatial distribution of roots and competition for nitrogen in
508
pea-barley intercrops - a field study employing P-32 technique. Plant Soil 236:63-74
509
Hauggaard-Nielsen H, Ambus P, Jensen E S (2001b) Interspecific competition, N use and interference with weeds in pea-barley
510
intercropping. Field Crops Res 70:101-109
511
Hauggaard-Nielsen H, Ambus P, Jensen E S (2003) The comparison of nitrogen use and leaching in sole cropped versus
512
intercropped pea and barley. Nutr Cycl Agroecosyst 65:289-300
513
Hauggaard-Nielsen H, Andersen M K, Jørnsgaard B, Jensen E S (2006) Density and relative frequency effects on competitive
514
interactions and resource use in pea-barley intercrops. Field Crops Res 95:256-267
515
Jackson W, Piper J (1989) The necessary marriage between ecology and agriculture. Ecology 70:1591-1593
516
Jensen E (1996) Grain yield, symbiotic N2 fixation and interspecific competition for inorganic N in pea-barley intercrops. Plant
517
Soil 182:25-38