MEMOIRE
PRÉSENTÉ À
L'UNIVERSITÉ DU QUÉBEC À CHICOUTIMI
COMME EXIGENCE PARTIELLE
DE LA MAÎTRISE EN INGÉNIERIE
PAR
SALIHA MELTEM KILIÇ
ÉTUDE EXPÉRIMENTALE DE LA CALCINATION ET DE L’HYDRODÉSULFURISATION COMBINÉES DE COKE DE PETROLE À
HAUTE TENEUR EN SOUFRE
A THESIS SUBMITTED TO
THE UNIVERSITY OF QUÉBEC AT CHICOUTIMI IN PARTIAL FULFILMENT OF THE REQUIREMENTS
FOR THE DEGREE OF MASTERS
IN ENGINEERING
BY
SALIHA MELTEM KILIÇ
EXPERIMENTAL STUDY OF THE COMBINED CALCINATION AND HYDRODESULFURIZATION OF HIGH-SULFUR GREEN PETROLEUM
COKE
ABSTRACT
The primary production of aluminum is done by means of the Hall-Heroult process where large amounts of carbon anodes are required and consumed. The quality of carbon anodes used in electrolysis is one of the most important parameters affecting the production of primary aluminum. The anode quality widely depends on the raw materials, one of which is the petroleum coke. Green petroleum coke is produced from the heavy residual fractions of petroleum. Petroleum cokes produced from sour crude oil sources contain high quantity of sulfur. A certain level of sulfur is needed to reduce the anode reactivities; however, the demand for anode-grade coke with acceptable sulfur content is increasing faster than the available supply. High sulfur levels in carbon anodes would have an adverse effect on environment; hence, the desulfurization of high sulfur green petroleum cokes is necessary. There are different ways of desulfurizing green petroleum cokes: solvent extraction, thermal desulfurization, and hydrodesulfurization. Coke produced by solvent extraction is prone to contamination. The thermal approach requires greater energy consumption and causes an increase in coke porosity.
The global objective of this master project is to find an alternative solution for desulfurization that will produce quality calcined coke with minimum impact on environment. Hydrodesulfurization seems to be a viable option and was investigated in this study. Water was used for the hydrodesulfurization of commercially available high sulfur green petroleum coke. Different experimental systems were tried during the hydrodesulfurization experiments.
A systematic approach was used to investigate the influence of hydrodesulfurization parameters including water injection temperature, duration, and water flow rate as well as coke particle size on the hydrodesulfurization of green petroleum coke. In addition to hydrodesulfurization, a number of thermal desulfurization experiments were carried out with the same green petroleum coke in this study. Sulfur removal as well as weight loss results which were obtained from the two methods were compared. The petroleum coke sulfur content as well as its structure were characterized using C-S analysis equipment, SEM-EDX, XPS, FT-IR, XRD, and helium pycnometer prior to the experiments. Hydrodesulfurized cokes which gave maximum sulfur removal were compared with thermally desulfurized cokes in terms of the degree of desulfurization and coke structure by using the above characterization techniques.
This study has indicated that different parameters affect the rate of desulfurization to different extents. Maximum sulfur removal was obtained when the water was injected to coke surface at 1 ml/min flow rate for 60 min at 650°C and 850°C resulting in the removal of 22.87% and 22.60% sulfur, respectively. Weight loss percentages were 26.07% and 24.34%, respectively, under these conditions. Hydrodesulfurization involves the loss of a small quantity of carbon due to gasification of coke by water.
The characterization of hydrodesulfurized coke with the highest desulfurization rate showed similar structure with its counterpart which was thermally desulfurized to the same maximum temperature. This result, thus, reveals that the hydrodesulfurization does not create a more porous calcined coke compared to that of thermal desulfurization. Therefore, it seems to be a promising method to produce anode-grade
calcined coke with lower sulfur content and suitable structure for carbon anode production.
RÉSUMÉ
La production de l'aluminium primaire se fait par le procédé Hall-Héroult où une grande quantité d'anodes de carbone est consommée. La qualité des anodes en carbone utilisées dans les cuves d’électrolyse est l'un des paramètres les plus importants qui affectent la production de l'aluminium primaire. Cela dépend largement des matières premières qui constituent les anodes, dont l'un est le coke de pétrole. Le coke de pétrole est produit à partir des fractions résiduelles lourdes de pétrole. Le coke de pétrole produit à partir de sources de pétrole brut acides contient une haute teneur en soufre. Un certain niveau de soufre est nécessaire pour réduire les réactivités des anodes; cependant, la demande de coke de qualité à teneur acceptable en soufre pour la production des anodes augmente plus vite que l'offre disponible. Des niveaux élevés de soufre dans les anodes de carbone ont un effet négatif sur l'environnement; par conséquent, la désulfuration des cokes de pétrole à haute teneur en soufre est nécessaire. Il y a différentes façons de désulfurer le coke de pétrole : l'extraction par des solvants chimiques, la désulfuration thermique et l’hydrodésulfuration. Le coke désulfuré par extraction à l’aide de solvants est sujet à la contamination par d’autres produits chimique. L'approche thermique exige une plus grande consommation d'énergie et provoque une augmentation de la porosité de coke.
L'objectif global de ce projet de maitrise est de trouver une solution alternative pour la désulfuration qui permet de produire un coke de pétrole calciné de qualité impliquant un minimum d'impact sur l'environnement. L’hydrodésulfuration semble être une option viable et a été étudiée dans ce projet. L'eau a été utilisée pour
l’hydrodésulfuration du coke de pétrole à haute teneur en soufre disponible dans l’industrie. Différents montages expérimentaux ont été utilisés au cours des expériences de l’hydrodésulfurisation.
Dans ce travail de recherche, une approche systématique a été utilisée pour étudier l'influence des paramètres tels que la température d'injection de l'eau, la durée et le débit de l'eau ainsi que la taille des particules de coke sur l’hydrodésulfuration de coke de pétrole. En plus de l'hydrodésulfuration, la désulfuration thermique du coke de pétrole vert a été faite dans le cadre de la présente étude. L'élimination du soufre ainsi que les résultats de perte de masse qui ont été obtenus à partir de ces deux méthodes ont été comparés. La teneur en soufre du coke de pétrole vert ainsi que la structure a été caractérisée par équipement d'analyse C-S, SEM-EDX, XPS, FT-IR, XRD et le pycnomètre à l'hélium avant les expériences. Les résultats obtenus pour le coke hydrodésulfurisé qui a montré la meilleure élimination de soufre ont été comparés avec les échantillons de coke désulfurisés thermiquement en termes de degré de désulfurisation et de la structure de coke en utilisant les techniques de caractérisation mentionnées précédemment.
Cette étude a indiqué que les paramètres ont divers impactes sur le taux de désulfurisation. Des taux d’élimination maximale de soufre de 22.87% et 22.60% ont été obtenus lorsque l'eau a été injectée avec un débit de 1 ml/min pendant 60 min à des températures de 650°C et 850°C, respectivement. Les pourcentages de perte de masse dans ces conditions étaient de 26.07% et 24.34%, respectivement, ce qui montre une petite quantité de perte de carbone due à la gazéification du coke par l'eau.
La caractérisation de coke hydrodésulfurisé avec le taux d’élimination de soufre le plus élevée montre une structure similaire à son homologue qui a été thermiquement désulfurisé à la même température maximale. Ce résultat révèle donc que l’hydrodésulfurisation ne crée pas un coke calciné plus poreux que celui de la désulfuration thermique. Donc, il semble une méthode prometteuse pour produire un coke calciné de qualité à teneur basse en soufre et garder une structure appropriée pour la production d'anodes en carbone.
ACKNOWLEDGEMENTS
I am using this opportunity to express my gratitude to everyone who supported me throughout the course of this master project.
First of all, I would like to present my sincere gratitude to my supervisor Prof. Duygu Kocaefe for giving me this chance to work in this challenging research project, for her continuous support of my master studies and related research, for her motivation, guidance and immense knowledge. I would like to also thank to my co- supervisor Prof. Yasar Kocaefe for his technical advices and continuous support in all steps of my master project. I would especially like to thank Prof. Dipankar Bhattacharyay for his technical guide and help throughout my master studies including all steps of my research work.
My sincere thanks also go to the technicians of University Centre for Research on Aluminium (CURAL), Dave Girard and Alexandre Morin, for their high quality and limitless technical support inside the laboratory for all the equipment. I would like to express my sincere appreciation to Dr. Xianai Huang for her technical advices as well as for her help at all steps of my project especially in SEM analyses. I thank to Prof. Zhan Zhang, University Centre for Research on Aluminium (CURAL) for providing me the access to SEM-EDX equipment.
I thank to all my colleagues from carbon chair program and my friends from UQAC for all the fun and lovely moments that we have had during these 2 years. My heartfelt gratitude to my dear friends in Turkey some of whom studied abroad and shared the same experiences as me. Although we couldn’t see each other for two years, they have
always stood by me from the day of my departure until now with their great friendship, love and support. Special thanks to Nuriye Çoban, Cem Yıldız and Mislina Yıldız, for their hospitality, sincerity and support from the very first day of my arrival in Québec.
My sincere and deepest thanks to my family, my mother Türkan Kılıç, my father Ali Kemal Kılıç, my brother Merthan Kılıç, my aunts Şükriye Kılıç and Asiye Kılıç Eryılmaz. Words cannot express how grateful I am for all of the sacrifices that you’ve made on my behalf. You gave me all your love, your care, a great education and an open mind. Without your love, your support and your sacrifices, I wouldn’t achieve anything in my life. At last, I would like express appreciation to Mounir Baiteche who opened me his heart and shared my best and worst moments since we have met. He was beside me with his great love and support for all the time.
The technical and financial supports of Aluminerie Alouette Inc. as well as the financial support of the Natural Sciences and Engineering Research Council of Canada (NSERC), Développement Économique Sept-Îles, the University of Québec at Chicoutimi (UQAC), and the Foundation of the University of Québec at Chicoutimi (FUQAC) are greatly appreciated.
TABLE OF CONTENTS
ABSTRACT ... iii
RÉSUMÉ ... vi
ACKNOWLEDGEMENTS ... ix
TABLE OF CONTENTS... xi
LIST OF TABLES ... xiv
LIST OF FIGURES ... xvi
CHAPTER 1 ... 1
INTRODUCTION... 1
1.1 Background... 1
1.2 Statement of the Problem ... 3
1.3 Objectives ... 5
1.4 Methodology... 5
CHAPTER 2 ... 9
LITERATURE REVIEW ... 9
2.1 Green Petroleum Coke and Its Use in Aluminum Industry ... 9
2.2 Sulfur in Petroleum Coke ... 12
2.3. Effects of Sulfur on Environment and Anode Properties ... 14
2.4. Coke Calcination ... 15
2.4.1. Rotary Coke Calcining Kiln ... 15
2.4.2. Vertical Shaft Calciner... 17
2.5. Desulfurization ... 20 2.5.1. Solvent Extraction ... 20 2.5.2. Thermal Desulfurization... 26 2.5.3. Thermochemical Desulfurization ... 40 2.5.4. Hydrodesulfurization ... 45 2.6. Conclusions ... 66 CHAPTER 3 ... 68
EXPERIMENTAL SET-UP AND TEST PROCEDURES... 68
3.1. Materials ... 68
3.2.1. Sulfur Analysis ... 70
3.2.2. Scanning Electron Microscopy (SEM) with Energy Dispersive X-ray Spectroscopy (EDX) ... 71
3.2.3. Fourier Transform Infrared Spectroscopy (FT-IR) ... 71
3.2.4. X-Ray Photoelectron Spectroscopy (XPS)... 71
3.2.5. X-ray Diffraction (XRD) Analysis ... 72
3.2.6. Density and Porosity Analyses ... 73
3.3. Thermal Desulfurization... 73
3.3.1. Experimental Set-up ... 73
3.3.2. Experimental Procedure ... 76
3.4. Hydrodesulfurization ... 76
3.4.1. First Experimental Set-up and Procedure ... 77
3.4.2. Second Experimental Set-up and Conditions ... 79
3.4.3. 2nd Experimental Set-up Coupled with Gas Chromatography (GC) ... 83
3.4.4. Third Experimental Set-up and Conditions ... 88
CHAPTER 4 ... 95
EXPERIMENTAL RESULTS AND DISCUSSION... 96
4.1. Introduction ... 96
4.2. Green Coke Characterization ... 97
4.2.1. FT-IR Analysis Results ... 97
4.2.2. XPS Analysis ... 100
4.2.3. SEM-EDX Analysis... 104
4.3. Thermal Desulfurization... 108
4.4. Hydrodesulfurization ... 109
4.4.1. Sulfur Removal and Weight Loss Results of Experiments Conducted with the First Set-up... 109
4.4.2. Sulfur Removal and Weight Loss Results of Experiments Conducted with the Second Set-up ...111
4.4.3. Sulfur Removal and Weight Loss Results of Experiments Conducted with the Third Set-up ...116
4.5. Comparison of Thermal Desulfurization and Hydrodesulfurization .. 135
4.5.1. Coke Properties ... 136
4.5.3. Surface Functionality with XPS Analysis ... 141
4.5.4. Surface Morphology with SEM... 151
4.6. Summary and Conclusions ... 168
CHAPTER 5 ... 169
CONCLUSIONS AND RECOMMENDATIONS ... 169
5.1. Conclusions ... 169
5.2. Recommendations ... 173
REFERENCES ... 175
APPENDIX A... 184
EXPERIMENTAL RESULTS AND DISCUSSION : THERMAL DESULFURIZATION AND CHARACTERIZATION OF GREEN COKE A, B, C ... 184
A.1. Introduction ... 184
A.2. Green Coke Characterization... 185
A.2.1. FT-IR Analysis Results ... 185
A.2.2. XPS Analysis Results ... 186
A.2.3. SEM Analysis Results ... 190
A.3. Thermal Desulfurization ... 192
A.3.1. SEM Analysis of Cokes after Thermal Desulfurization ... 196
LIST OF TABLES
Table 2.1 Comparison of typical calcination conditions of a shaft kiln and a rotary kiln
... 20
Table 2.2 Previous works on the desulfurization of petroleum coke by solvent extraction ... 23
Table 2.3 Previous works on thermal desulfurization of petroleum coke... 34
Table 2.4 The list of the works on thermochemical desulfurization available in the literature ... 42
Table 2.5 Previous works on hydrodesulfurization of petroleum coke by steam ... 48
Table 2.6 Previous works on Hydrodesulfurization of petroleum coke by hydrogen...58
Table 2.7 Previous works on Hydrodesulfurization of chemically treated petroleum coke ... 61
Table 2.8 Previous works on Hydrodesulfurization of pre-treated petroleum coke .... 64
Table 3.1 Physical and chemical properties of green coke A, B, C and D ... 69
Table 3.2 Real density and proximate analysis of green petroleum coke D (air dried basis) ... 69
Table 3.3 Experimental conditions for the experiments with the 1st set-up ... 79
Table 3.4 Experimental conditions for the experiments with the 2nd set-up ... 82
Table 3.5 The GC analysis conditions for hydrogen and methane ... 84
Table 3.6 Typical GC conditions ... 87
Table 3.7 Experimental conditions for the hydrodesulfurization experiments with the 3rd set-up using green coke D ... 92
Table 3.8 Experimental conditions for the hydrodesulfurization of coke with the 3rd set-up using different particle sizes and green coke D... 95
Table 4.1 List of functional groups in green petroleum coke from the FT-IR analysis ... .99
Table 4.2 Atomic percentages of different elements in green petroleum coke D ... 100
Table 4.3 Peak positions used in CasaXPS for deconvolution ... 101
Table 4.4 Atomic percentages of different components in green petroleum coke D . 102 Table 4.5 Percent sulfur removal of hydrodesulfurization tests conducted with the 1st experimental set-up (temperature of water injection varied keeping all other conditions constant) ... 109
Table 4.7 Sulfur removal percentages of cokes for several hydrodesulfurization tests carried out under different conditions using 1 ml/min water flow rate, -2 mm +1 mm coke particle size ... 123 Table 4.8 Weight loss percentages of cokes for several hydrodesulfurization tests carried out under different conditions using 1 ml/min water flow rate, -2 mm +1 mm particle size... 124 Table 4.9 Effect of varying particle size on hydrodesulfurization for 850°C injection temperature and 1 ml/min water flow rate ... 127 Table 4.10 Sulfur removal and weight loss values of hydrodesulfurized coke D with -2 mm +1 mm particle size at varying injection temperatures using 8 ml/min water flow rate and 6 min injection duration ... 128 Table 4.11 Percent sulfur removal and weight loss values of coke D with different particle sizes hydrodesulfurized using 850C injection temperature, 1 m/min of water flow rate and 37 min injection duration with a 10 g sample ... 132 Table 4.12 Sulfur removal and weight loss values of coke D for different particle sizes hydrodesulfurized using 850C injection temperature, 1 m/min of water flow rate and 37 min injection duration with one layer of sample... 134 Table 4.13 Comparison of density and porosity values of coke D before and after thermal and hydrodesulfurization ... 137 Table 4.14 Lc values of different treated coke samples ... 140 Table 4.15 Atomic percentages of the different components of green, TDS-1080, TDS- 1200, HDS-37, and HDS-60 coke samples ... 144 Table 4.16 Atomic percentages of the different carbon components of green, TDS- 1080, TDS-1200, HDS-37 and HDS-60 coke samples ... 147 Table 4.17 Different sulfur components of green, TDS-1080, TDS-1200, HDS-37 and HDS-60 coke samples ... 151 Table A.1 Atomic percentages of the different components of the three different green petroleum cokes………..….187 Table A.2 Atomic percentages of carbon components of different green petroleum cokes………187 Table A.3 Sulfur removal (%) results of the four petroleum cokes after thermal desulfurization……….192 Table A.4 Weight loss (%) results of the four petroleum cokes after thermal desulfurization……….193
LIST OF FIGURES
Figure 2.1 Coke structures under polarized light A) needle coke, B) isotropic coke, C)
sponge coke D) shot coke ... 11
Figure 2.2 S and V level of GPC Sources in 2000 and 2011 ... 12
Figure 2.3 A schematic description of the rotary kiln... 16
Figure 2.4 Shaft calciner a) Cross section b) Shaft outlets ... 18
Figure 2.5 Shaft furnace concept ... 19
Figure 2.6 Evolution of volatile matter from high sulfur coke (heating rate 4C/min): 1) ethane+ethylene; 2) methane; 3) hydrogen; 4) total ... 27
Figure 2.7 Sulfur remaining in coke as a function of calcination temperature [71] .... 29
Figure 2.8 Sulfur removal at different calcination temperatures for cokes with various initial S% ... 30
Figure 2.9 The change in desulfurization ratio at high calcination temperatures ……31
Figure 2.10 The change in coke sulfur content during thermal treatment ... 31
Figure 2.11 The effect of residence time on the desulfurization... 32
Figure 2.12 Sulfur content versus residence time for several cokes calcined at 1400ºC. Particle size 1 mm ... 32
Figure 2.13 Coke porosity change as a function of calcination temperature ... 40
Figure 2.14 Effect of temperature on the sulfur removal from coke during hydrodesulfurization with steam ... 47
Figure 2.15 Variation of sulfur content of coke with time at different temperatures . 48 Figure 2.16 The effect of temperature on hydrodesulfurization for 60/80 mesh particles and the effect of particle size on hydrodesulfurization at 850ºC ... 49
Figure 2.17 Effect of temperature on hydrodesulfurization in a static bed with H2.. .. 50
Figure 2.18 Hydrodesulfurization of coke at various temperatures ... 51
Figure 2.19 Microphotographs of coke surfaces: a) green coke, b) desulfurized coke at 650ºC, c) desulfurized coke at 950ºC... 52
Figure.2.20 Influence of holding time on hydrodesulfurization at 850ºC and 700ºC . 53 Figure 2.21 Effect of particle size on hydrodesulfurization... 54
Figure 2.22 Influence of particle size and hydrogen flow rate on % desulfurization at 750ºC for 90 min experiments ... 54
Figure 2.23 Effect of hydrogen flow rate on hydrodesulfurization at 850 and 700ºC for 60/80 mesh particles and the influence of particle size at 850ºC (2.5 h): 1st curve, 60/80 mesh - 850ºC; 2nd curve, 60/80 mesh - 700ºC; 3rd curve 20/30 mesh - 850ºC....55
Figure 2.25 Adverse effect of added H2S to petroleum coke during desulfurization.. 57
Figure 3.1 Experimental system for calcination and thermal desulfurization ... 75
Figure 3.2 Graphite crucible ... 75
Figure 3.3 Heating profile used in thermal desulfurization experiments with induction furnace ... 76
Figure 3.4 First experimental set-up for hydrodesulfurization ... 78
Figure 3.5 Second experimental set-up for hydrodesulfurization ... 80
Figure 3.6 Crucible... 81
Figure 3.7 Gas chromatograph equipped with a thermal conductivity detector (GC- TCD) ... 85
Figure 3.8 Gas chromatograph equipped with a pulsed flame photometric detector (GC- PFPD)... 86
Figure 3.9 Vertical cross section of the crucible during water injection ... 89
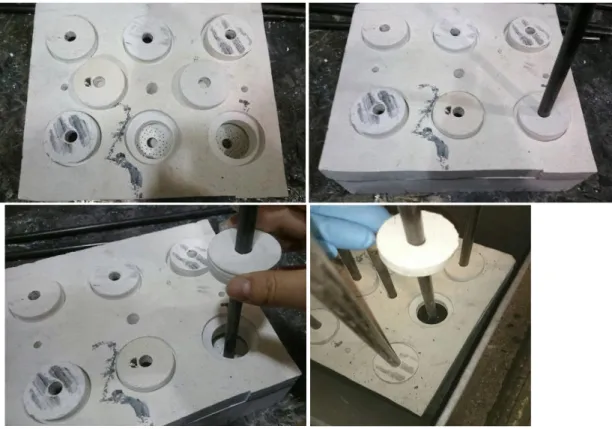
Figure 3.10 The new crucible with 6 sample holders and water connections... 89
Figure 3.11 Schematic representation of the third experimental system including crucible with multiple sample holders and water connections... 91
Figure 3.12 The furnace and the third experimental system including crucible with multiple sample holders and water connections... 91
Figure 3.13 The third experimental system... 92
Figure 3.14 Diffuser plate with horizontal grooves ... 94
Figure 3.15 Single layer of coke particles in samples holders with different particle size... 94
Figure 4.1 FT-IR analysis of green petroleum coke D by DRIFT method at room temperature... 98
Figure 4.2 General spectra from XPS analysis for green petroleum coke D ... 100
Figure 4.3 Deconvoluted C1s spectra of green petroleum coke D from XPS analysis ... 102
Figure 4.4 Deconvoluted S2p spectra of green petroleum coke D from XPS analysis ... 102
Figure 4.5 SEM images of green petroleum coke D at magnifications of (a) x27 (b) x100 (c) x1000 (d) x2000 ... 104
Figure 4.6 SEM-EDX images and EDX patterns of different regions on -2 mm +1 mm green coke D particle 1 ... 106
Figure 4.7 SEM-EDX images and EDX patterns of different regions on -2 mm +1 mm green coke D particle 2 ... 107
Figure 4.8 Weight loss and sulfur removal results of green coke D with thermal desulfurization at 1080, 1200, 1300, and1400ºC ... 108 Figure 4.9 Sulfur removal vs. water injection temperature for tests done using the 1st experimental set-up ... 110 Figure 4.10 Sulfur removal and weight loss results of hydrodesulfurization experiments with the 2nd set-up ... 112 Figure 4.11 Comparison of sulfur peaks during hydrodesulfurization and thermal desulfurization as a function of sample temperature... 114 Figure 4.12 Comparison of H2 peaks during hydrodesulfurization and thermal desulfurization as a function of sample temperature... 115 Figure 4.13 Comparison of CH4 peaks during hydrodesulfurization and thermal desulfurization as a function of sample temperature... 115 Figure 4.14 Percent sulfur removal and weight loss for the hydrodesulfurization experiments with a water flow rate of 1 ml/min, injection duration of 37 min, and coke particle size of -2 mm +1 mm at different water injection temperatures ... 118 Figure 4.15 Percent sulfur removal and weight loss for the hydrodesulfurization experiments with water flow of 1 ml/min, injection duration of 60 min, and coke particle size of -2 mm +1 mm at different water injection temperatures ... 120 Figure 4.16 Percent sulfur removal and weight loss for the hydrodesulfurization experiments with water flow of 1 ml/min, injection duration of 100 min, and coke particle size of -2 mm +1 mm at different water injection temperatures ... 121 Figure 4.17 Variation of sulfur removal from coke D with -2 mm +1 mm particle size with respect to water injection duration for 650°C, 750°C, 850°C and 950°C of water injection temperatures and 1 ml/min water flow... 122 Figure 4.18 Variation of weight loss from coke D with -2 mm +1 mm particle size with respect to water injection duration for 650°C, 750°C, 850°C and 950°C water injection temperatures and 1 ml/min water flow... 123 Figure 4.19 Effect of water flow rate on desulfurization of coke D with -2 mm +1 mm particle size, 850°C injection temperature and 37 min injection duration ... 125 Figure 4.20 Effect of varying particle size on hydrodesulfurization for 850°C injection temperature and 1 ml/min water flow rate ... 126 Figure 4.21 Variation of sulfur removal from coke D with -2 mm +1 mm particle size with respect to water injection temperature using 8 ml/min water flow rate and 6 min injection duration ... 128 Figure 4.22 The effect of temperature on the extent of desulfurization obtained at different reaction times and flow rates (coke particle size -2 mm +1 mm) ... 129 Figure 4.23 The effect of temperature on the coke weight loss obtained at different reaction times and flow rates (coke particle size -2 mm +1 mm) ... 130
Figure 4.24 Percent sulfur removal and weight loss vs different particle sizes of coke D hydrodesulfurized using 850C injection temperature, 1 m/min of water flow rate
and 37 min injection duration with a 10 g sample ... 132
Figure 4.25 Position of coke particles in the slots ... 133
Figure 4.26 Sulfur removal and weight loss vs coke D particle size hydrodesulfurized using 850C injection temperature, 1 m/min of water flow rate and 37 min injection duration with one layer of sample ... 134
Figure 4.27 XRD patterns of thermally desulfurized cokes at 1080°C and 1200°C.. 139
Figure 4.28 XRD patterns of cokes after hydrodesulfurization and thermal desulfurization ... 139
Figure 4.29 XRD patterns of cokes after hydrodesulfurization and thermal desulfurization ... 140
Figure 4.30 General spectra of TDS-1080 coke sample from XPS analysis ... 142
Figure 4.31 General spectra of HDS-37 coke sample from XPS analysis ... 142
Figure 4.32 General spectra of HDS-60 coke sample from XPS analysis ... 143
Figure 4.33 General spectra of TDS-1200 coke sample from XPS analysis ... 143
Figure 4.34 Deconvoluted C1s peak of TDS-1080 coke D sample ... 145
Figure 4.35 Deconvoluted C1s peak of HDS-37 coke D sample... 145
Figure 4.36 Deconvoluted C1s peak of HDS-60 coke D sample... 146
Figure 4.37 Deconvoluted C1s peak of TDS-1200 coke D sample ... 146
Figure 4.38 Deconvoluted S2p peak of TDS-1080 coke D sample ... 149
Figure 4.39 Deconvoluted S2p peak of HDS-37 coke D sample... 150
Figure 4.40 Deconvoluted S2p peak of HDS-60 coke D sample... 150
Figure 4.41 Deconvoluted S2p peak of TDS-1200 coke D sample ... 151
Figure 4.42 SEM images of TDS-1080 sample at magnifications of (a) x20 (b) x50 (c) x100 (d) x250 ... 152
Figure 4.43 SEM images of HDS-37 sample at magnifications of (a) x20 (b) x50 (c) x100 (d) x250 ... 153
Figure 4.44 SEM images of HDS-60 sample at magnifications of (a) x20 (b) x50 (c) x100 (d) x250 ... 153
Figure 4.45 SEM images of TDS-1200 sample at magnifications of (a) x20 (b) x50 (c) x100 (d) x250 ... 154
Figure 4.46 SEM images of 1st particle a) green coke D b) hydrodesulfurized coke D, - 16 mm +12.5 mm particle size x30 and x100 magnifications ... 155
Figure 4.47 SEM-EDX images, EDX patterns and elemental analysis of 1st particle a) green coke D b) hydrodesulfurized coke D-spectrum 1, c) hydrodesulfurized coke D-
spectrum 2, -16 mm +12.5 mm particle size ... 156
Figure 4.48 SEM images of the 1st particle a) green coke D b) hydrodesulfurized coke D, -16 mm +12.5 mm particle size, x30 and x500 magnifications ... 158
Figure 4.49 SEM-EDX images, EDX patterns and elemental analysis of the 1st particle a) green coke D b) hydrodesulfurized coke D, -16 mm +12.5 mm particle size ... 159
Figure 4.50 SEM-EDX images, EDX patterns and elemental analysis of the 1st particle a) green coke D b) hydrodesulfurized coke D, -16 mm +12.5 mm particle size ... 160
Figure 4.51 SEM images of the 2nd particle a) green coke D b) hydrodesulfurized coke D, -16 mm +12.5 mm particle size x30, x100, x500 magnifications ... 162
Figure 4.52 SEM-EDX images, EDX patterns and elemental analysis of the 2nd particle a) green coke D b) hydrodesulfurized coke D, -16 mm +12.5 mm particle size ... 163
Figure 4.53 SEM-EDX images, EDX patterns and elemental analysis of the 2nd particle a) green coke D b) hydrodesulfurized coke D, -16 mm +12.5 mm particle size ... 164
Figure 4.54 SEM images of the 2nd particle a) green coke D b) hydrodesulfurized coke D, -16 mm +12.5 mm particle size x30 and x100 magnifications ... 165
Figure 4.55 SEM-EDX images, EDX patterns and elemental analysis of the 2nd coke D particle a) green coke D b) hydrodesulfurized coke D (area 1), -16 mm +12.5 mm particle size... 166
Figure 4.56 SEM-EDX Images, EDX patterns and elemental analysis of the 2nd particle a) hydrodesulfurized coke D (area 2) b) hydrodesulfurized coke D (area 3), -16 mm +12.5 mm particle size... 167
Figure A.1 FT-IR analysis of green petroleum cokes by DRIFT method at room temperature………..185
Figure A.2 Deconvoluted C1s peak of green coke A………..188
Figure A.3 Deconvoluted C1s peak of green coke B………...……...188
Figure A.4 Deconvoluted C1s peak of green coke C………..189
Figure A.5 SEM images of green coke A at different magnifications (a) x 27 (b) x 100 (c) x1000……….………...………...190
Figure A.6 SEM images of green coke B at different magnifications (a) x 27 (b) x 500 (c) x5000……….………...………...……..191
Figure A.7 SEM images of green coke C at different magnifications (a) x 27 (b) x 75 (c) x1000………..………...191
Figure A.8 Percentage weight loss and sulfur removal for coke A during thermal desulfurization at 1200-1300-1400ºC………...…………..193
Figure A.9 Percentage weight loss and sulfur removal results of coke B during thermal desulfurization at 1200-1300-1400ºC……….194 Figure A.10 Percentage weight loss and sulfur removal results of coke C during thermal desulfurization at 1200-1300-1400ºC……….…...195 Figure A.11 SEM images of coke A after thermal desulfurization up to 1200ºC (x20 x100 x1000 magnifications)………....197 Figure A.12 SEM images of coke A after thermal desulfurization up to 1400ºC (x20 x100 x1000 magnifications)………....197 Figure A.13 SEM images of coke B after thermal desulfurization up to 1200ºC (x20 x100 x1000 magnifications)………....198 Figure A.14 SEM images of coke B after thermal desulfurization up to 1400ºC (x20 x100 x1000 magnifications)………....198 Figure A.15 SEM images of coke C after thermal desulfurization up to 1200ºC (x20 x100 x1000 magnifications)………...….199 Figure A.16 SEM images of coke C after thermal desulfurization up to 1400ºC (x20 x100 x1000 magnifications)………...……….200
CHAPTER 1
INTRODUCTION
This chapter provides an introduction to the anode production in primary aluminum industry, the role of calcined coke as well as the desulfurization of petroleum coke for anode production. The statement of the problem and the objectives of the research project as well as the general methodology used to reach the objectives are outlined in the following sections.
1.1 Background
The production of aluminum is carried out by means of the electrolysis of alumina (Al2O3) in molten cryolite (Na3AlF6) called the Hall-Heroult process. This electrolytic process is represented by the following reaction [1]:
2Al2O3 + 3C 4Al + 3CO2 (1.1)
In the electrolysis cell, aluminum ions within Al2O3 are reduced to Al in its metallic form which accumulates below the electrolyte in liquid form at temperatures around 950°C. CO2 is produced as a result of the reaction of oxide ions with the carbon [1, 2]. Carbon anodes are immersed in the molten electrolyte during electrolysis and are consumed by the electrochemical reaction [1, 3-5]. The anode life in a modern electrolysis cell is between 20 and 30 days, and this duration is directly related to the
quality of anode [6]. Secondary reactions increase the carbon consumption and consequently greenhouse gas (GHG) emissions [4, 7]. Low quality anodes lead to high energy consumption during the electrolytic process, which is directly related to environmental emissions [8, 9]. Thus, the anode quality is highly important for an efficient, economic, and environmentally-sound aluminum production [1, 4].
Typically, prebaked anodes consist of approximately 65% calcined petroleum coke, 15% coal tar pitch, and 20% recycled anodes and butts [1, 10]. The anode production comprises of the following steps: preparation of green paste from raw materials (coke, pitch, butts, rejected anodes), forming of green paste block either by vibro-compaction or hydraulic pressing, cooling and storage of obtained green anodes, baking of green anodes in the furnace at temperatures around 1100°C, and finally rodding prior to their use in the electrolysis cell [1, 11]. To carry out an efficient electrolysis process, the anodes need to have appropriate properties such as high electrical conductivity, high thermal shock resistance, high mechanical strength, low CO2 and air reactivities as well as good homogeneity [1, 11].
It has been shown that the influence of calcined coke properties on anode quality is significant [12]. Therefore, attention should be paid to the quality and the properties of petroleum coke used in the production of carbon anodes for the aluminum industry [13]. These properties include chemical composition (sulfur, sodium, vanadium, etc.), porosity, density, reactivity, etc. Coke morphology plays an important role as well [14].
Calcined coke, which is one of the main raw materials for carbon anodes, is produced from green petroleum coke by the calcination process. The rising demand
for aluminum results in higher demand for green petroleum coke in order to produce calcined coke for carbon anode fabrication [15]. However, the availability of the type of green petroleum coke, which is suitable for the production of high quality calcined coke, has been decreasing during recent years [10]. This latest trend comes about from the significant increase in sour crude oil usage in refining industry due to economic reasons. Sour crude oil leads to the production of high sulfur green coke, [16] and aluminum industry uses such cokes by blending with low sulfur cokes. However, calcined coke which is produced from high sulfur petroleum coke has a negative impact on environment and anode quality, which is undesirable for primary aluminum industry [17, 18]. This master project addresses the problem of sulfur content in coke and its removal with an objective to reduce its impact on environment.
1.2 Statement of the Problem
The growing demand on aluminium requires the increase in the production of carbon anodes [19] and consequently calcined coke. Green petroleum coke, the source of calcined coke, is produced from the heavy residual fractions of petroleum (or crude oil) [20]. The quality of the anode-grade coke widely depends on the raw material used in the petroleum refining as well as the operating conditions during refining, coking, and calcination [1]. Today’s petroleum industry uses crude oil sources containing higher sulfur and impurity levels and produces cokes with higher sulfur content and metal impurities than before [10, 16]. Today, smelters are using more of high sulfur cokes in blends to satisfy the demand for aluminum metal production [21, 22].
A certain amount of sulfur is needed in calcined coke to reduce anode reactivity [11, 23]. However, using calcined coke with a sulfur content higher than necessary in carbon anodes would have a number of adverse effects on environment. High-sulfur anode use in electrolysis results in increase in emissions such as H2S, COS, CS2, and SO2, which are at the heart of environmental problems such as acid rain and GHG. High sulfur content in anodes may also cause sulfur removal during anode baking if the baking is continued above a certain temperature. This would increase anode porosity and specific electrical resistivity, and decrease anode baked density. Such anodes have shorter lives and increase the energy consumption and environmental emissions during electrolysis, which is undesirable for the aluminum industry.
There are several methods for removing sulfur from petroleum coke. Solvent extraction uses chemical solvents [24, 25]. This method is not suitable for the treatment of petroleum coke used in anode manufacturing since it contaminates the coke. Its complexity and its impact on the environment are also part of its unsuitability. Thermal desulfurization must meet several criteria (specific heating rate, maximum temperature, residence time) without affecting the quality of coke [26, 27]. The economic and environmental aspects should not be neglected either. Also, in thermal desulfurization, coke has to be calcined at higher temperatures than that is normally used by the industry, which increases the energy consumption and results in a porous coke structure. Hydrodesulfurization consists of subjecting the coke to a heat treatment (using a suitable heating rate, maximum temperature, and residence time) during calcination in a medium of hydrogen gas or steam, which reacts with sulfur in the coke. This method seems promising for reducing the high sulfur content in green
coke to acceptable levels and adds value to high-sulfur green coke by making its utilization possible in the manufacture of carbon anodes [22, 28].
1.3 Objectives
The main objective of this study is to investigate the simultaneous calcination and hydrodesulfurization of high-sulfur containing sources of green coke to produce low- emission, anode-grade coke that will allow a smelter to maintain anode quality as well as respect environmental regulations. To attain this objective, the effects of various experimental conditions (water injection temperature, water flow rate, etc.) on sulfur removal have been studied. The results will open the way to the utilisation of high sulfur green coke in anode production.
This work aims to develop a method for combining the hydrodesulfurization and calcination of green petroleum coke through an experimental study. The application of this method in a vertical shaft furnace might allow the production of calcined and desulfurized coke with desired quality and appropriate sulfur level for anode fabrication.
1.4 Methodology
Normally, simultaneous hydrodesulfurization and calcination would be carried out in a vertical shaft furnace where coke would be in contact with one or more of the following gases: water gas (CO+H2), CO2, volatiles, and sulfurous gases such as H2S. The vertical shaft furnace is one of the most common technologies used by calcination industry in order to produce calcined coke.
Many phenomena occur simultaneously during the combined hydrodesulfurization and calcination process. A fundamental investigation of the hydrodesulfurization conditions has to be carried out in order to find the favorable conditions to obtain calcined coke with a desired sulfur content and suitable structure. Thus, in the current study, coke was subjected to different water injection conditions during its calcination. To achieve the specified objectives, the work included the following steps:
Hydrodesulfurization of high sulfur petroleum coke was carried out in an electrically heated furnace with a thin layer of particles to ensure their contact with water vapor. During the experiments, tap water was injected into the sample holder at different temperatures and flow rates for different period of times. The contact between the water vapor and the green coke with high sulfur content results in the reaction products H2S, COS, etc. The effect of contact time of green coke with water, quantity and temperature of water injected on the desulfurization has been studied.
Prior to and following the experiments, the sulfur content of the coke and its properties (density, porosity, surface functionality) were measured. These data were correlated with the experimental conditions in order to understand the fundamental processes taking place.
In order to compare the effect of two different desulfurization methods on the removal and the structure of coke, thermal desulfurization of high sulfur green petroleum coke was carried out using a thermogravimetric analyser (TGA) heated by induction. The weight loss of cokes during the experiments was measured with a balance, and the sulfur contents were measured before and after the experiments.
Weight loss and final sulfur content results were compared with the results of hydrodesulfurization.
This study was carried out in the UQAC laboratories. The equipment used for the detailed analysis of coke is as follows: Scanning Electron Microscope (SEM) for surface imaging, Energy-Dispersive X-ray Spectroscopy (EDX) for chemical analysis of surface, X-ray Photoelectron Spectroscopy (XPS) and Fourier Transform Infra-Red (FT-IR) spectroscopy to determine chemical composition of surfaces, X-ray Powder Diffraction to determine the crystallinity of coke samples, helium and water pycnometers for real density and apparent density measurements, respectively.
1.5. Scope
The thesis is organized in five chapters as follows:
Chapter 1 presents a summary of the role of carbon anodes in the production of primary aluminum, the problem of high-sulfur content in petroleum cokes and its usage in carbon anodes, desulfurization methods as a solution to this problem as well as a general introduction of this research work including the research objectives, the methodology, and the scope.
Chapter 2 provides a review of the available literature and the background information on different green petroleum cokes available in industry, sulfur in green petroleum coke, and the use of high-sulfur petroleum coke in carbon anodes, the calcination process as well as different desulfurization methods to solve the sulfur problem in coke such as solvent extraction, thermal desulfurization, and hydrodesulfurization. The concepts and explanations provided in this chapter make it
possible to understand the principles of the tests and the reasons for choosing hydrodesulfurization method in this research. This chapter also summarizes previous studies and results obtained related to the topic of desulfurization.
Chapter 3 explains the experimental procedures for thermal desulfurization and hydrodesulfurization of high-sulfur green petroleum coke. It also provides a description of the facilities and techniques used for the characterization of coke samples, e.g., Scanning Electron Microscope (SEM), Energy-Dispersive X-ray Spectroscopy (EDX), X-ray Photoelectron Spectroscopy (XPS), Fourier Transform Infra-Red (FT-IR) spectroscopy, helium and water pycnometer, etc.
Chapter 4 presents the experimental results obtained from the thermal desulfurization and hydrodesulfurization of high sulfur petroleum coke as well as the characterization of coke samples before and after the treatment. Sulfur removal and weight loss results obtained after the treatment under different conditions are discussed in detail in this chapter. The changes in coke structure are presented and compared to understand the effects of two different desulfurization methods.
Chapter 5 gives the general conclusions as well as recommendations for future works based on this research study.
Appendix A includes the characterization results of different high sulfur green petroleum cokes and the application of thermal desulfurization method on these cokes under different conditions.
CHAPTER 2
LITERATURE REVIEW
2.1 Green Petroleum Coke and Its Use in Aluminum Industry
Green coke, which is one of the raw materials of carbon anodes, is produced from the heavy residual fractions of petroleum (crude oil) by a process known as delayed coking [23]. The quality of anode-grade coke widely depends on the feed material used in petroleum refining as well as the operating conditions of refining, coking, and calcination processes. Structure, density, and volatile matter content can vary significantly as can the sulfur, metals, and ash contents [1, 11].
The origin of the crude oil determines its composition which could vary significantly from one region to another. For instance, the crude oil from North America typically contains high S and is known as sour whereas in North Africa crude oil with low sulfur is called sweet crude [1, 11]. Four different kinds of products, gas, naphtha, gas oil and green coke, are produced by delayed coking process. One of the uses of green coke fraction is the production of carbon anodes for aluminum smelting. The production of different sorts of coke is influenced by the unit feedstock and operating conditions [11, 23].
The main types of green delayed petroleum coke can be classified as shot coke, sponge/fuel coke, sponge/honeycomb coke (also called anode-grade coke), and needle coke [11, 29]. They are explained in the following paragraphs.
Shot coke which is currently used as a fuel is a form of isotropic coke which shows identical properties in all directions [23, 30]. It is obtained from highly asphaltenic coker feedstock. It has a fine texture with uniform properties, and the shape of particles tend to be spheroidal with sizes ranging from buckshot to basketballs. The structure can also be layered like an onion. The aluminum industry has avoided using highly isotropic cokes, especially shot cokes, because of their high coefficients of thermal expansion (CTE) and low open porosity [11, 31].
Fuel grade cokes have a less optimal macrostructure and a high coefficient of thermal expansion. Millions of tonnes of these cokes are burned directly for power generation and cement production. Sponge (honeycomb) coke has a heterogeneous, porous, and amorphous structure with a mixture of coarse and fine textures. It contains 10 to 15 percent of volatile hydrocarbons together with impurities such as sulfur, vanadium, nickel, and nitrogen. If green coke contains sufficiently low levels of sulfur and metals, it may be suitable for calcination to produce feedstock for carbon anodes for aluminum smelters. This higher quality green sponge coke is often described as anode-grade coke. Its pore structure is more prominent, and the coefficient of thermal expansion is lower compared to that of fuel coke. [11, 16, 23, 27, 29, 30].
While sponge coke is used in aluminum industry, needle coke is a premium product for steel industry [16, 23]. It seems similar to sponge coke in terms of porosity and has a characteristic layered structure which is referred to as anisotropic in general. It is chemically produced through cross linking of condensed aromatic hydrocarbons during coking reactions. The use of needle coke in steel industry is in graphite electrodes for electric arc furnaces. It has a low sulfur content (<0.5%) and a low coefficient of thermal expansion [16, 23, 29, 30]. The surface structures of four different types of cokes are given in Figure 2.1.
Figure 2.1 Coke structures under polarized light A) needle coke, B) isotropic coke, C) sponge coke D) shot coke [27]
Global aluminum production has increased by about 10 million tonnes since 2009 and is estimated to reach about 61 million tonnes per year by 2016. The increase in aluminum production has increased the demand for anode-grade coke. The calcination industry is trying to produce the required quality of calcined coke to meet this demand. However, due to crude oil and refinery economics, the production of coke with higher sulfur and metal contents has been increasing. Refineries use heavy, sour crudes and produce coke with higher sulfur and metal (Ni, V) contents. Although light, sweet crudes are easier to process and give higher proceeds of liquid fuels, elevated price of light sweet crude drives refineries to process cheaper crudes and adapt their technologies accordingly. This results in a general shortage of low sulfur coke. The needs of aluminum industry for low sulfur coke due to environmental reasons are not necessarily supported by the refining industry. Cokes, considered as inconvenient for anode production in the past, are being used regularly in blends at varying levels today, and this trend is likely to continue [16, 31]. This has been also the subject of several papers and presentations since 2001 [32-34].
The difference in the sulfur level of cokes used in classical anode blends by smelters has not increased significantly due to environmental constraints. However, broader range of cokes is
being used in anode blends today. The greater range particularly applies to sulfur and vanadium levels. For instance, a sulfur level of 1-2% may be blended with cokes with sulfur levels up to 4- 6% to achieve a smelter anode coke specification of 2.5-3.0%. A good illustration of the range of S and V in green petroleum cokes (GPC) supplied by Rain CII for anode blends from 2000 to 2011 is given in the Figure 2.2 [16, 27, 35].
Figure 2.2 S and V level of GPC Sources in 2000 and 2011 [16] 2.2 Sulfur in Petroleum Coke
Sulfur is recognized as the most tightly bound to green coke among the four elements (H, O, N, S) and is released in large quantities above 1400°C [36]. The sulfur content of green petroleum coke is a good indicator of its properties, which is important for its application. It can vary from less than 0.5% to more than 10% and mainly depends on the sulfur content of the feedstock [37]. Sulfur in the petroleum coke is a function of sulfur in the charge as well as the origin of crude oil from which the coker feedstock is prepared. Sulfur can be present in the petroleum coke in different forms [38]:
It can be attached to the aromatic skeleton between the aromatic rings.
It can be present on the surface of the structure, but attached to the aromatic skeleton.
It can be in lateral chains.
It was reported that it is more difficult to remove the first two forms of sulfur than the last one [38].
It was demonstrated by several authors that the nature of sulfur in green petroleum coke is mostly organic [39-41]. Specifically, sulfur may exist in the form of aromatic and aliphatic sulfides, thiophenes, and mercaptans [26, 41-43]. According to some works, sulfur can also be present as sulfates and pyritic sulfur. Elemental sulfur may occasionally be present, too [26, 44].
Although the exact form of organic sulfur in a petroleum coke is difficult to determine, according to the literature, thiophenes appear to be the most common forms of sulfur present in these cokes. It was reported that since thiophenes are stable compounds, the thiophenic form of sulfur in petroleum coke is difficult to remove without selectively breaking the C-S bonds, which may necessitate thermal, chemical, or thermochemical treatments [42].
The work of Hay et al. (2004) [45] deserves a special mention as they studied sulfur specification in petroleum cokes and aluminum smelter anodes. XANES (X-ray absorption near- edge structure) spectroscopy was used to determine the sulfur species in different petroleum cokes from major suppliers and anodes with different thermal histories. It was found that organic sulfur comprising of five- and six-membered ring structures were the dominant sulfur species in these cokes. These species were stable during anode baking and usage. In addition to the dominant existence of thiophenic and other cyclic sulfur, small quantities of sulfoxides and elemental sulfur were also detected by semi-quantitative analysis in some samples. Lesser
amounts of inorganic sulfides (S 2-) and sulfates were usually detected in the petroleum cokes. It was also reported that organic sulfur ring structures were the dominant sulfur species in petroleum cokes from different sources with slight variations from one supplier to the next.
2.3. Effects of Sulfur on Environment and Anode Properties
The general specification for the sulfur content of petroleum coke used in carbon anode production is around 2.5-3%. Today’s aluminum industry uses blends of high and low sulfur cokes to obtain a suitable sulfur level for carbon anodes. The background of this application was explained in the first section.
The presence of high amounts of sulfur in carbon anodes used in alumina reduction cells negatively affects the performance of the electrolysis process. It was mentioned by many authors that carbon anode consumption during electrolysis increases with increasing anode sulfur content [17, 18, 46, 47]. It was reported that net anode consumption increases 2-3% per S% in the anode between 1-4% total sulfur [46]. Sulfur in anodes also results in a significant loss of current efficiency in the electrolysis cell [18, 47] as well as an increase of emissions such as hydrogen sulfide (H2S), carbonyl sulfide (COS), carbon disulfide (CS2) and sulfur dioxide (SO2) which can create significant environmental problems [17, 46, 48]. High sulfur content in anodes also causes loss of sulfur during the baking step if it reaches a certain temperature resulting in an increase in anode porosity and a decrease in baked anode density. Less dense anodes will reduce the efficiency of electrolysis cell operation and increase the environmental emissions, which are not desired by the aluminum industry [49].
2.4. Coke Calcination
Calcination is a heat treatment process during which green coke is heated to a specific temperature in order to remove moisture, drive off volatile matter, and produce anode-grade coke at the desired level of real density with the highest purity, high physical strength and electrical conductivity, minimum porosity and reactivity [50-53]. It was stated that the degree of coke calcination influences chemical, physical, and mechanical properties of carbon anodes [51]. Calcination is carried out at temperatures up to 1200-1400ºC, and the contact time varies from 0.5 h to 48 h, depending on the nature of the petroleum coke and the process. The calcination process also enables the arrangement of coke structure, i.e. transformation of the amorphous structure into a crystalline structure [53]. These properties along with low metal and ash contents make calcined petroleum coke the best material presently available for making carbon anodes for the production of aluminum [52].
Calcination process is important for the production of good quality anodes. There are three kinds of primary processes for the continuous calcination of petroleum coke: rotary kiln, rotary hearth and vertical shaft furnace. Rotary kiln and vertical shaft furnace processes will be explained in more detail.
2.4.1. Rotary Coke Calcining Kiln
Rotary kiln calciners are widely used for calcined petroleum coke production in the world while the vertical shaft calciners are used mostly in Chinese calcined petroleum coke plants [54]. In a rotary kiln, enough heat is provided to solids to raise their temperatures to desired level and to promote an efficient mixing of these solids in order to ensure uniformity of heat transfer [53]. The rotary kiln is a long cylinder rotating about its axis and operating basically as a counter- current heat exchanger. The cylinder is slightly tilted along its axis by an angle of about 2-5 to
facilitate the axial motion of the coke bed along the kiln by means of gravity, and the rotary action of the cylindrical walls helps increase the solid-gas contact while the hot gas flows upwards. A typical kiln is 60 m in length, 2-3 m in diameter and rotates at 2 to 4 rpm. A typical green coke contains 8-12 wt% moisture and about the same weight percentage in volatiles [55- 57]. Figure 2.3 gives a schematic description of the kiln.
Figure 2.3 A schematic description of the rotary kiln [52]
In the calcination process, first green coke is fed to the system. As the coke flows down the kiln countercurrent to the hot combustion gases, the temperature increases to a maximum value that is reached around 13 to 20 m before the discharge end of the kiln. In the first zone of the kiln, which is called “Heat-Up Zone”, moisture is driven off from the coke structure at temperatures between 25-400C. Devolatilization takes place mostly between 400C and 1000C in the “Calcining Zone”. Further dehydrogenation, desulfurization, and shrinkage of coke structure (densification) occur in the “Calcined Coke Zone” from 1000 to 1400C [52].
Air (primary and secondary) for combustion is injected through the burner at the coke discharge end of the kiln. A tertiary air is injected into the calcining zone to burn the volatiles evolving from the bed in that section [53].
The necessary energy for the calcination process is provided by the partial combustion of volatile compounds and coke dust. As a result, the system is energy self-sufficient under normal conditions [56].
2.4.2. Vertical Shaft Calciner
A shaft calciner has multiple vertical refractory shafts surrounded by flue walls. The green coke is continuously fed on the top and travels down through the shafts by gravity and exits through water cooled jackets at the bottom. The process is illustrated in Figure 2.4. The movement of coke is controlled by the opening of a slide gate or a rotary valve at the bottom to discharge a small amount of coke. The discharge is intermittent (~every 20 min) and green coke is added to the top to maintain the feed. The volatile matter (VM) in a shaft furnace travels up through the coke bed and enters flue wall cavities at the top of the furnace. It is mixed with air at this point and then drawn down through a set of horizontally orientated flues. VM is combusted inside the flue walls and heat is conducted to the coke indirectly from the flue walls in a manner similar to an anode baking furnace [58]. The residence time of coke in shaft furnace is 24 to 36 h, resulting in a heating rate of ~1°C/min (compared to about 40-50°C/min in a rotary kiln). Due to this very slow heating rate, green coke with high VM (12 – 16%) can be calcined, and anode- grade coke with desired properties can be produced [59].
A B
Figure 2.4 Shaft calciner a) Cross section b) Shaft outlets [60]
Green coke (crushed to size < 70 mm) primarily passes through the preheating zone in order to remove moisture and some part of the volatiles during the calcination process in the shaft calciner. Devolatilization takes place between about 400°C and 1000°C. In the calcining zone, where the highest temperatures in the flue reaches 1250 – 1400°C, further dehydrogenation, some desulfurization, and coke shrinkage (densification) occurs. The coke moves through the heated part of the calciner in 18 – 30 h and finally reaches the cooling zone. In the cooling zone, a coke discharge temperature of 60°C is reached with indirect water cooling [59]. Figure 2.5 shows the zones of calcination process in a vertical shaft calciner.
Figure 2.5 Shaft furnace concept [59]
The differences between two processes have a significant impact on some calcined coke quality parameters. The most universally reported difference is the higher bulk and apparent density achieved with a shaft calciner. This is due to the slower heat up rate of green coke. The loss of VM creates porosity in coke. Lower VM gives lower porosity (and higher density) so lower VM green coke is always preferred. Porosity is also a function of the heat-up rate of the coke. Faster heat-up rates create higher porosity and lower bulk density [15, 58, 60]. Shaft- calcined coke has high levels of -75 μm fines. This can result in significant dusting problems. It also necessitates high refractory volume and mass, which results in higher refractory cost. The level of automation is one of the advantages of rotary kilns. Labor requirement is higher for shaft calciner operation [60]. In Table 2.1 the major process parameters of a shaft kiln are compared with those of a rotary kiln.
Table 2.1 Comparison of typical calcination conditions of a shaft kiln and a rotary kiln [59]
1250
1350
Yield:dryfeed calcined
1000
2.5. Desulfurization
It is known from the previous studies that the temperatures at which the calcination of high- sulfur green petroleum coke is traditionally carried out are not sufficient to reduce the sulfur content of coke to an acceptable value for aluminum smelters. Hence, the desulfurization of high sulfur coke is necessary [61]. The process which involves the breaking of C-S bonds in organic groups and the subsequent separation of sulfur is called desulfurization, and this can be achieved in several ways: calcination at higher temperatures, hydrodesulfurization, and chemical treatment with different agents, solvents, and acids [43].
2.5.1. Solvent Extraction
In solvent extraction, coke is treated with different solvents to selectively dissolve sulfur. Based on the fact that similar chemical structures have greater tendency to be reciprocally soluble in one another, solvents including aromatic and similar organic compounds might be used for the extractive desulfurization of petroleum cokes where the sulfur is mostly in organic form and exists as thiophenes [62]. Extractive desulfurization experiences with coal showed that weak organic acids like phenols are more effective than other organic solvents [63].
Many studies have been carried out on solvent extraction of petroleum coke by a large variety of solvents by several researchers [64-68]. It was found that while no sulfur removal was seen with the use of petroleum ether, dioxane or hydrochloric acid; o-chlorophenol, pyridine, phenol, furfural, chlorex, aqua regia, molten NaOH, naphthalene, p-cresol, xylene, benzene, nitrobenzene, ethanolamine, toluene, and acetone led to 1-25% sulfur removal from the petroleum coke [39, 66, 67, 69]. The two highest sulfur removals of 20% and 19% were found at 160°C in 2 h with the use of o-chlorophenol and pyridine as solvent, respectively. It was observed that sulfur removal increased with extraction temperature and time while it decreased with increasing coke particle size [69].
Agarwal et al. (2011) [42] applied the organodesulfurization technique using a potential solvent system of N-methyl-2-pyrolidone (NMP) containing small amounts of ethylenediamine (EDA). They also used morpholine, o-chlorophenol, and several other solvents for the desulfurization of petroleum coke. When high sulfur coke sample was subjected to organorefining using N-methyl-2-pyrolidone (NMP) containing small amounts of ethylenediamine (EDA), almost 34-41% sulfur removal was found within 2 h extraction time at room temperature. With the separate treatment of o-chlorophenol, tetrachloroethylene, trichloroethylene, and morpholine solvents, almost 28-50% of sulfur was removed from the coke structure in an optimum extraction time of 2 h. Among these solvents, trichloroethylene was found to be the most effective. Morpholine is also known to be used to remove organic S from coal or oil. It gave more than 40% desulfurization in 2 h with petroleum coke [42].
When ferric chloride and benzene were used consecutively, more than 35% sulfur removal was obtained by Aly et al. (2003) [37]. In this work, Egyptian petroleum coke was treated with ferric chloride and benzene one after another, and more than 35% desulfurization was achieved. It
was found that when the concentration of ferric chloride increases, desulfurization degree increases up to a certain residence time which was found as 45 min. Effect of solvent-to-feed ratio (S/F) and coke particle size on sulfur removal was also examined in this work. It was observed that the desulfurization increases with increasing S/F ratio and decreasing particle size [37].
Pre-oxidation and chemical oxidation treatments were applied to petroleum cokes prior to solvent extraction by Ibrahim (2011) [62] and Philips et al. (1977) [69]. It was reported that pre- oxidation at a moderate temperature (327°C) and chemical oxidation make petroleum coke more suitable for solvent extraction. O-chlorophenol and pyridine solvents were used to extract sulfur, and 76% and 69% desulfurization were achieved, respectively. It was found that, with oxidation, the coke porosity and surface area of coke increased due to the creation of micro and macro porosity [62]. In the work of Philips (1977) [69], about 40% sulfur removal was obtained when coke was treated consecutively with nitric acid and o-chlorophenol. When the order of these two treatments was reversed, about 35% sulfur removal has been achieved [69]. Extraction of sulfur in petroleum coke using a large variety of solvents, which were done by different workers, was summarized in Table 2.2.
Table 2.2 Previous works on the desulfurization of petroleum coke by solvent extraction Solvent S (wt %) in coke Solution-to- coke ratio (vol:wt) Reaction time (min) Reaction Temperature (°C) Particle size (µm) Max desulf. (%) Reference Air oxidation+ o-chlorophenol 7.8 N/A 15-120 327-25 -250 76 Ibrahim (2011) [62] Air oxidation+ pyridine 7.8 N/A 15-120 327-25 -250 69 Ibrahim (2011) [62] N-methyl-2- pyrrolidone + ethylenediamine 6.8 17:1 120 25 -250+125 41.4 Agarwal et al. (2011) [42] Trichloroethylene 6.8 17:1 120 25 -250+125 41 Agarwal et al.(2011) [42]
Morpholine 6.8 17:1 120 25 -250+125 40 Agarwal et al.
(2011) [42]
Tetrachloroethylene 6.8 17:1 120 25 -250+125 35 Agarwal et al.
(2011) [42] Ferric chloride+ benzene 5-5.2 10:1 45 80 100-200 35 Aly et al. (2003) [37] Nitric acid+
o-chlorophenol 7.5 N/A N/A N/A -55 40
Philips et al. (1977) [69]
Solvent S (wt %) in coke Solution-to- coke ratio (vol:wt) Reaction time (min) Reaction Temperature (°C) Particle size (µm) Max desulf. (%) Reference
Nitric acid (HNO3- 14%) + N-methyl-2-
pyrrolidone+ ethylenediamine
6.8 N/A N/A 25 -250+125 38.5 Agarwal et al.
(2011) [42]
Nitric acid 7.5 6 N of Nitric
acid 240 102 -55 30 Philips et al. (1977) [69] o-chlorophenol 6.8 17:1 360 25 -250+125 28.5 Agarwal et al. (2011) [42] 7.5 5:1 120 160 -55 19 Philips et al. (1977) [69]
NaOH-10% aq. 6.8 N/A 360 522 -250+125 26.74 Agarwal et al.
(2011) [42] Nitric acid (HNO3-
14%) 6.8 N/A 360 25 -250+125 25.5
Agarwal et al. (2011) [42]
Molten NaOH 1.26 N/A 90 25 -250+210 24 Sabott (1952) [67]
Pyridine 1.26 N/A 240 25 -250+210 19 Sabott (1952) [67] 5.8 250 ml of solvent 2880 25 -841+177 8.8 Parmar et al. (1977) [66]
Aqua regia 1.26 - 120 25 -250+210 14 Sabott (1952) [67]
![Figure 2.1 Coke structures under polarized light A) needle coke, B) isotropic coke, C) sponge coke D) shot coke [27]](https://thumb-eu.123doks.com/thumbv2/123doknet/7615348.234380/32.918.226.702.112.389/figure-coke-structures-polarized-light-needle-isotropic-sponge.webp)
![Figure 2.7 Sulfur remaining in coke as a function of calcination temperature [71]](https://thumb-eu.123doks.com/thumbv2/123doknet/7615348.234380/50.918.224.675.241.577/figure-sulfur-remaining-coke-function-calcination-temperature.webp)
![Figure 2.9 The change in desulfurization ratio at high calcination temperatures [50]](https://thumb-eu.123doks.com/thumbv2/123doknet/7615348.234380/52.918.262.646.111.351/figure-change-desulfurization-ratio-high-calcination-temperatures.webp)
![Figure 2.14 Effect of temperature on the sulfur removal from coke during hydrodesulfurization with steam [40]](https://thumb-eu.123doks.com/thumbv2/123doknet/7615348.234380/68.918.229.676.368.683/figure-effect-temperature-sulfur-removal-coke-hydrodesulfurization-steam.webp)
![Figure 2.15 Variation of sulfur content of coke with time at different temperatures [66]](https://thumb-eu.123doks.com/thumbv2/123doknet/7615348.234380/69.918.278.628.104.516/figure-variation-sulfur-content-coke-time-different-temperatures.webp)
![Figure 2.17 Effect of temperature on hydrodesulfurization in a static bed with H 2 [65]](https://thumb-eu.123doks.com/thumbv2/123doknet/7615348.234380/71.918.276.631.108.400/figure-effect-temperature-hydrodesulfurization-static-bed-h.webp)
![Figure 2.22 Influence of particle size and hydrogen flow rate on % desulfurization at 750ºC for 90 min experiments [98]](https://thumb-eu.123doks.com/thumbv2/123doknet/7615348.234380/75.918.291.615.697.1009/figure-influence-particle-size-hydrogen-flow-desulfurization-experiments.webp)
![Figure 2.24 Effect of temperature and flow rate on % desulfurization for 90 min [98]](https://thumb-eu.123doks.com/thumbv2/123doknet/7615348.234380/77.918.274.632.200.525/figure-effect-temperature-flow-rate-desulfurization-min.webp)
![Figure 2.25 Adverse effect of added H 2 S to petroleum coke during desulfurization [100]](https://thumb-eu.123doks.com/thumbv2/123doknet/7615348.234380/78.918.206.721.112.630/figure-adverse-effect-added-h-petroleum-coke-desulfurization.webp)