Cooking and co-ingested polyphenols reduce in vitro methylmercury
1
bioaccessibility from fish and may alter exposure in humans
2 3
Catherine Girarda, Tania Charetteb,c, Maxime Leclercb,c, B. Jesse Shapiroc, Marc Amyota,b,c
4 5
a. Center for Northern Studies (CEN), Département de sciences biologiques, Université de
6
Montréal, 90 Vincent-d’Indy, Montreal, H2V2S9, Canada.
7
b. ÉcoLac, Département de sciences biologiques, Université de Montréal, 90
Vincent-8
d’Indy, Montreal, H2V2S9, Canada.
9
c. Groupe de recherche interuniversitaire en limnologie et en environnement aquatique
10
(GRIL), Département de sciences biologiques, Université de Montréal, 90 Vincent-d’Indy,
11
Montreal, H2V2S9, Canada.
12 13
#Address correspondence to Marc Amyot, m.amyot@umontreal.ca, 514-343-7496. Université
14
de Montréal, Département de sciences biologiques. Pavillon Marie-Victorin, C.P. 6128, succ
15
Centre-ville, Montreal (Quebec) H3C3J7 Canada.
16 17
Running title
18
MeHg bioaccessibility is reduced by food preparation
19 20
Acknowledgments
21
The authors thank Dominic Bélanger, Shirley Atoche, Fei Tao Zhou, Valérie de Munck and
22
Mélissande Gaucher for assistance in the laboratory, and Antoine Caron and Maikel Rosabal for
23
advice. Research was funded through NSERC Discovery grant (217099-2012) and the Canada
24
Research Chair program (950-230679) to MA. Student funding was provided by FRQNT and
25
NSERC doctoral scholarships to CG.
26 27
Competing financial interests
28
All authors declare they have no actual or potential competing financial interest.
29 30
Key Words
31
Methylmercury, bioaccessibility, cooking, polyphenols, tea, risk assessment
Abstract
33 34
Fish consumption is a major pathway for mercury exposure in humans. Current guidelines and
35
risk assessments assume that 100% of methylmercury (MeHg) in fish is absorbed by the human
36
body after ingestion. However, a growing body of literature suggests that this absorption rate may
37
be overestimated. We used an in vitro digestion method to measure MeHg bioaccessibility in
38
commercially-purchased fish, and investigated the effects of dietary practices on MeHg
39
bioaccessibility. Cooking had the greatest effect, decreasing bioaccessibility on average to 12.5
40
± 5.6%. Polyphenol-rich beverages also significantly reduced bioaccessibility to 22.7 ± 3.8% and
41
28.6 ± 13.9%, for green and black tea respectively. We confirmed the suspected role of
42
polyphenols in tea as being a driver of MeHg’s reduced bioaccessibility, and found that
43
epicatechin, epigallocatechin gallate, rutin and cafeic acid could individually decrease MeHg
44
bioaccessibility by up to 55%. When both cooking and polyphenol-rich beverage treatments were
45
combined, only 1% of MeHg remained bioaccessible. These results call for in vivo validation, and
46
suggest that dietary practices should be considered when setting consumer guidelines for MeHg.
47
More realistic risk assessments could promote consumption of fish as a source of fatty acids,
48
which can play a protective role against cardiovascular disease.
1. Introduction
50 51
A large proportion of the world’s population depends on fish. Indeed, fish are estimated to
52
provide 17% of animal proteins consumed by humans (and 6.7% of all proteins consumed
53
worldwide) (Food and Agriculture Organization, 2016), and are an important source of vitamins,
54
minerals and fatty acids, which can protect from cardiovascular disease (Mahaffey et al., 2011).
55
However, fish consumption is one of the major pathways of human exposure to mercury (Hg)
56
(Committee on Toxicological Effects of Methylmercury, National Research Council of the United
57
States, 2010), which in its organic form of methylmercury (MeHg) is a potent neurotoxin (Clarkson
58
and Magos, 2008). To protect at-risk populations, Hg blood guidelines have been established,
59
derived from large-scale studies defining lowest adverse effect doses (Chapman and Chan, 2000;
60
Legrand et al., 2010).
61
However, there is also a growing body of evidence suggesting that our understanding of
62
Hg absorption in the body is incomplete. Current recommendations on fish consumption consider
63
that the ingested dose of Hg from fish is equal to MeHg’s – this assumes that 100% of Hg in fish
64
is in the form of MeHg, and that MeHg’s absorption rate is of 100% (Committee on Toxicological
65
Effects of Methylmercury, National Research Council of the United States, 2010; Ha et al., 2016).
66
This stems from older studies performed on human volunteers (Aberg et al., 1969) and on rats
67
(Miettinen et al., 1971) with methylmercuric nitrate (MeHgNO3). However, this may not be
68
representative of MeHg speciation in fish, which is more likely bound to thiol groups included in
69
proteins (Clarkson and Magos, 2008; Harris, 2003). Indeed, assuming that nearly all of Hg in fish
70
is bioavailable may overestimate intake by 50% (Ha et al., 2016): while the absorption rate of
71
solubilized MeHg may be high, not all MeHg is necessarily freed from the fish matrix into digestive
72
fluids (i.e. made bioaccessible) and made available for absorption by the body following
73
metabolism in the intestine by the gut microbiome or in the liver (bioavailable) (Afonso et al.,
74
2015a). Thus, to postulate near total MeHg bioavailability overlooks processes that may occur
75
before absorption and into systemic circulation. This is supported by studies reporting that Hg
76
bioaccessibility is not positively correlated to concentration in the consumed food (Laird and Chan,
77
2013; Laird et al., 2009a). While biomarkers like blood or hair Hg show robust relationships to Hg
78
intake (Abdelouahab et al., 2008; Cole et al., 2004; Kosatsky et al., 2000; Legrand et al., 2005;
79
Mahaffey and Mergler, 1998), in most of these studies, Hg intake is estimated from food frequency
80
questionnaires and the literature on the consumed fish species, rather than direct Hg
81
measurements (Abdelouahab et al., 2008; Sunderland, 2007), meaning that exact Hg intake is
82
frequently unknown. Furthermore, there is evidence that populations exhibit toxicological
responses to Hg in different ways (Canuel et al., 2006a; Chapman and Chan, 2000). As Hg
84
remains a contaminant of major concern (Mergler et al., 2007), it is critical we better understand
85
its fate in the body. A cost-effective and non-invasive way of doing so is through in vitro
86
bioaccessibility studies, to first investigate the fate of Hg in the gastrointestinal tract.
87
Many factors could be responsible for altering MeHg bioaccessibility from ingested food.
88
Food matrix composition may affect the fate of MeHg in the body, with one study reporting that
89
Hg from the flesh of a salmonid may be 6-fold more bioaccessible than that from marine
90
mammalian organs (Laird et al., 2009a). Different levels of Hg bioaccessibility have also been
91
reported for various fish species (H.-S. Wang et al., 2013). Fish handling by industries and by
92
consumers could also alter bioaccessibility. While freezing can induce physicochemical changes
93
to meat (Farouk et al., 2004; Sanza et al., 1999), it is widely used in fish processing to prevent
94
spoilage (George, 1993), which could change MeHg bioaccessibility before fish become available
95
on the market for purchase. Consumer-based food preparation can significantly transform meat,
96
with cooking and drying reducing moisture, crude protein content and total lipids (Toyes-Vargas
97
et al., 2016). Indeed, cooking has been found to reduce Hg and MeHg bioaccessibility (Afonso et
98
al., 2015b; He and W.-X. Wang, 2011; Jadán Piedra et al., 2016; Ouédraogo and Amyot, 2011;
99
Torres-Escribano et al., 2011; 2010). In vitro studies have also suggested that foods rich in plant
100
polyphenols (such as tea) may reduce MeHg bioaccessibility (He and W.-X. Wang, 2011;
101
Ouédraogo and Amyot, 2011; Shim et al., 2009). Dietary practices may thus alter the way MeHg
102
is solubilized from food (bioaccessibility), and ultimately change its bioavailability. A better
103
understanding of these processes could lead to easily implementable guidelines and
104
recommendations to reduce Hg loading in fish-consuming populations.
105
The goal of this study was to explore how dietary practices can alter MeHg bioaccessibility,
106
using an in vitro digestion model. We explored how various cooking techniques and the
co-107
ingestion of polyphenol-rich foods could alter MeHg solubilization from food. We also investigated
108
the role of specific polyphenols in driving this effect which had been hypothesized in the literature,
109
but never confirmed. We also assessed the potential effect of combined dietary practices on
110
MeHg bioaccessibility. Finally, we report how these dietary practices can affect MeHg intake and
111
loading in the body, and propose ways to use this information to inform future research and
112 guidelines. 113 114 115 116
2. Methods
117118
2.1. Food items, co-ingested foods and polyphenols 119
Experiments were performed on swordfish, grouper, tuna and salmon filets obtained from
120
fish markets in Montreal. These species were selected to reflect fish readily available to Canadian
121
consumers year-round. Blueberries, coffee (Nescafé, Maxwell) and green and black teas of
122
various brands (Twinnings, Stash, Green Sail, Salada) were purchased in Montreal supermarkets
123
as were corn oil (Mazola) used for cooking treatments, and cornstarch (Ideal), used as a
non-124
polyphenol control. Pure polyphenols (gallic acid (>97.5%), catechin >98%), epigallocatechin
125
gallate (>80%), theaflavin (>80%), rutin (>94%)) were obtained from Sigma-Aldrich.
126 127
2.2. Food preparation methods 128
Three cooking methods were tested: grilling, frying and boiling. Grilling was performed on
129
a Teflon-coated pan, at 100 and 150 C for 1 min. Frying treatments were conducted in 1 mL of
130
corn oil, in glass vials heated on a burner for 1 min. Samples were boiled in 2 mL of ultrapure
131
MilliQ water (> 18.2 M cm-1) (EMD Millipore) in glass vials for 5 or 10 min. Temperature was
132
monitored throughout cooking. For freezing, fish samples were subsampled immediately following
133
their purchase and placed in glass vials, and kept at -20, -80 C or flash frozen in liquid nitrogen
134
(then kept at -80 C). Glassware was rinsed with distilled water, soaked in a 45% HNO3, 5% HCl
135
(Fisher Scientific, ACS-pure) bath overnight and rinsed 3 times with MilliQ water before use.
136
For co-ingestion experiments, fish samples were digested simultaneously with either
137
beverages or pure polyphenols. Beverages (tea, coffee, instant coffee) were prepared as per the
138
manufacturer’s instructions, and lyophilized overnight into a powder (Freezone6, Labconco).
139
Powdered beverages were solubilized in 2 mL of MilliQ water, in two different doses: 40 mg or
140
120 mg, and were added to fish at the start of in vitro digestion experiments. In these experiments,
141
controls were amended with 2 mL of MilliQ water to adjust the volume. Pure polyphenols were
142
solubilized in 2 mL of dimethyl sulfoxide (DMSO), in amounts of 5 or 10 mg, and used in in vitro
143
digestions. Controls with no polyphenols were also amended with 2 mL of DMSO, to account for
144
volume increase.
145 146 147
2.3. Physiologically-based extraction test 148
Many in vitro digestion protocols exist to assess bioaccessibility of nutrients and dietary
149
compounds (Dong et al., 2016; Minekus et al., 2014; Van de Wiele et al., 2007). We selected the
150
Physiologically-based extraction test (PBET), adapted from Ruby et al. (1996) and Ouédraogo
and Amyot (2011), to perform digestive simulations, as it has been used frequently for metals and
152
Hg (Calatayud et al., 2012; Ouédraogo and Amyot, 2011; Siedlikowski et al., 2016). All digestive
153
simulations were performed on 1.0 ± 0.1 g of fresh fish sample, in triplicate. Experimental solutions
154
were prepared in acid-washed Teflon bottles prior to each PBET digestion. The gastric phase was
155
prepared by combining 1.25 g porcine pepsin (>400 units/mg), 0.50 g sodium citrate (>99%), 0.50
156
g malic acid (>99%), 420 L lactic acid (>85%) and 500 L of acetic acid (99.7%) (purchased
157
from Sigma-Aldrich and Fisher Scientific) in ultrapure MilliQ water in a final volume of 1 L, and pH
158
was adjusted to 2 with HCl (OmniTrace Ultra, EMD). The intestinal phase contained 0.60 g bile
159
salts and 0.15 g pancreatin (4 x USP grade, lipase >24 units/mg, protease >400 units/mg)
(Sigma-160
Aldrich), in a final volume of 250 mL 1 M NaHCO3.
161
Briefly, samples were placed in Falcon tubes with 40 mL of gastric solution, and were
162
incubated at 37 C with agitation (100 rpm) for 1 hour. pH was then adjusted to 7 using 5 M NaOH.
163
Nine mL of intestinal solution were added to all samples, which were incubated at 37 C with
164
agitation (100 rpm) for 2 hours. Following incubation, samples were centrifuged for 15 minutes at
165
3,000 g. The supernatant, considered to contain the bioaccessible (solubilized) fraction of MeHg,
166
was isolated and used for MeHg analyses.
167 168
2.4. Bioaccessibility 169
Bioaccessibility was calculated after PBET simulations with the following equation:
170 171 [Equation 1] 172 % 𝑏𝑖𝑜𝑎𝑐𝑐𝑒𝑠𝑠𝑖𝑏𝑖𝑙𝑖𝑡𝑦 =[𝑀𝑒𝐻𝑔] 𝑖𝑛 𝑃𝐵𝐸𝑇 (𝑛𝑔 𝐿)⁄ 𝑥 𝑃𝐵𝐸𝑇 𝑣𝑜𝑙𝑢𝑚𝑒 (𝐿) [𝑀𝑒𝐻𝑔] 𝑖𝑛 𝑓𝑖𝑠ℎ (𝑛𝑔 𝑔) 𝑥 𝑓𝑖𝑠ℎ 𝑚𝑎𝑠𝑠⁄ (𝑔) 𝑥 100 173 174
with [MeHg] in PBET being MeHg measured in the extract of the simulated digestion, PBET
175
volume being PBET digestive fluids volume, [MeHg] in fish is [MeHg] in initial fish sample, and 176
fish mass is the mass of fresh fish used as input into the PBET simulation. 177
Multiple bioaccessibility experiments were also performed using the same
commercially-178
purchased fish filet over different days (stored at 4 C between experiments). Bioaccessibility
179
values for controls were compared across runs, and we found no statistical differences within a
180
single fish filet (with the number of experimental days performed on each fish individual varying
181
from 2 to 5) (Kruskal-Wallis, P > 0.05) (Figure S2). This showed us that we could use multiple
182
samples from one individual fish filet over several days with minimal impact on bioaccessibility.To
183
compare different sets of experiments, we normalized results within each experiment to raw
untreated fish muscle (using Equation 2), giving a percent of bioaccessible MeHg compared to
185
controls (now normalized to 100%).
186 187 [Equation 2] 188 % 𝑏𝑖𝑜𝑎𝑐𝑐𝑒𝑠𝑠𝑖𝑏𝑖𝑙𝑖𝑡𝑦 𝑐𝑜𝑚𝑝𝑎𝑟𝑒𝑑 𝑡𝑜 𝑐𝑜𝑛𝑡𝑟𝑜𝑙 = 𝑎𝑣𝑒𝑟𝑎𝑔𝑒 𝑡𝑟𝑒𝑎𝑡𝑒𝑑 % 𝑎𝑣𝑒𝑟𝑎𝑔𝑒 𝑐𝑜𝑛𝑡𝑟𝑜𝑙 % 𝑥 100 189 190
where average treated % refers to the mean bioaccessibility obtained across triplicates of a given
191
treatment, and average control % refers to mean bioaccessibility calculated in untreated triplicates
192
of raw fish muscle from the same run. Non-normalized control values are presented in Table 1.
193 194
2.5. MeHg analyses 195
MeHg in fish was measured in freeze-dried samples (Freezone6, Labconco), while MeHg
196
following simulated digestion was analyzed in PBET fluids. Prior to analysis, both dried fish
197
samples and PBET fluids were extracted overnight in 5 mL of 4 M HNO3 (Fisher Scientific,
ACS-198
pur) at 60 C. MeHg in fish and PBET solutions was measured by gas chromatography and
cold-199
vapor fluorescence spectrometry (CVAFS) (Tekran 2700, Tekran Instruments Corporation),
200
according to U.S. EPA method 1630 (detection limit of 0.01 ng L-1, defined as three times the
201
standard deviation calculated on 10 ultrapure MilliQ blanks).
202 203
2.6. Fish matrix characterization 204
Lipids were quantified by gravimetry, using a method adapted from Folch et al., 1957.
205
Nitrogen was used as a proxy for protein content and was quantified with a CHN Element Analyzer
206
1108 (Thermo Fisher). Moisture content in fish muscle was quantified by subtracting sample dry
207
weight from wet weight after drying. Full methods on fish matrix characterization are presented in
208 Supplementary Information. 209 210 2.7. Polyphenol analyses 211
Polyphenols were quantified by ultra-performance liquid chromatography with tandem
212
mass spectrometer (UPLC-MSMS) at the Institute of Nutrition and Functional Foods (Quebec,
213
Canada) using a Waters Acquity Ultra-Performance LC system (Waters). The full method is
214
presented in Supplemental Information. The seven polyphenols that were quantified in
co-215
ingested foods and subsequently tested in their purified form are presented in Table S2. Complete
216
profiles of the 56 polyphenols analyzed in co-ingested foods are presented in Table S3.
218
2.8. Risk assessment 219
We estimated a probable daily intake (PDI) (ug kg-1) for an average adult for each of the
220
fish tested in this study, using the following equation:
221 222 [Equation 3] 223 𝑃𝐷𝐼 =[𝑀𝑒𝐻𝑔 𝑖𝑛 𝑓𝑖𝑠ℎ ](𝑢𝑔 𝑔⁄ ) 𝑥 𝑎𝑣𝑒𝑟𝑎𝑔𝑒 𝑑𝑎𝑖𝑙𝑦 𝑓𝑖𝑠ℎ 𝑖𝑛𝑡𝑎𝑘𝑒 (𝑔) 𝑎𝑣𝑒𝑟𝑎𝑔𝑒 𝑎𝑑𝑢𝑙𝑡 𝑏𝑜𝑑𝑦 𝑤𝑒𝑖𝑔ℎ𝑡 (𝑘𝑔) 224 225
where [MeHg in fish] is the MeHg concentration measured in the fish sample tested; average daily
226
fish intake is based on fish consumption values from the Bureau of Chemical Safety of Canada 227
(22 g for an adult) (Bureau of Chemical Safety Health Canada, 2004); and the average adult body
228
weight is based on values from Nutrition Canada (60 kg for an adult) (Health Canada, 2004). PDIs 229
represent average exposure to MeHg, if an adult consumed each fish daily over a long period of
230
time. We then calculated a bioaccessibility-corrected PDI (PDIBA):
231 232 [Equation 4] 233 𝑃𝐷𝐼𝐵𝐴= 𝑃𝐷𝐼 𝑥 % 𝑏𝑖𝑜𝑎𝑐𝑐𝑒𝑠𝑠𝑖𝑏𝑖𝑙𝑖𝑡𝑦 234 235
where the % bioaccessibility is the soluble fraction calculated from our experiments. This PDIBA
236
accounts for the bioaccessibility of MeHg in the in vitro model and the effect of food preparation
237
and co-ingestion treatments.
238 239
2.9. Statistical analyses 240
Statistical analyses were performed with R software (R Development Core Team) using
241
nonparametric methods, as normality and homoscedasticity were not respected (tested with
242
shapiro.test() and bartlett.test() functions). Differences in bioaccessibility across treatments were
243
compared with Kruskal-Wallis analysis of variance (kruskal() in the agricolae{} package) (De
244
Mendiburu, 2012), and Bonferonni corrections were used to correct for multiple hypothesis
245
testing. Linear regressions were used to model bioaccessibility and lipid content, and ordinations
246
was calculated on log-transformed data. Plots were prepared using the ggplot2{} (Wickham, 2009)
247
and ggbiplot{} (Vu, 2011) packages. Letters on plots denote significantly different treatments (P <
248
0.05), bars present averages from triplicate PBET digestions and error bars show standard
249
deviation of triplicates.
3. Results
251 252
3.1. Fish sample characterization and inter-fish and inter-simulation variation 253
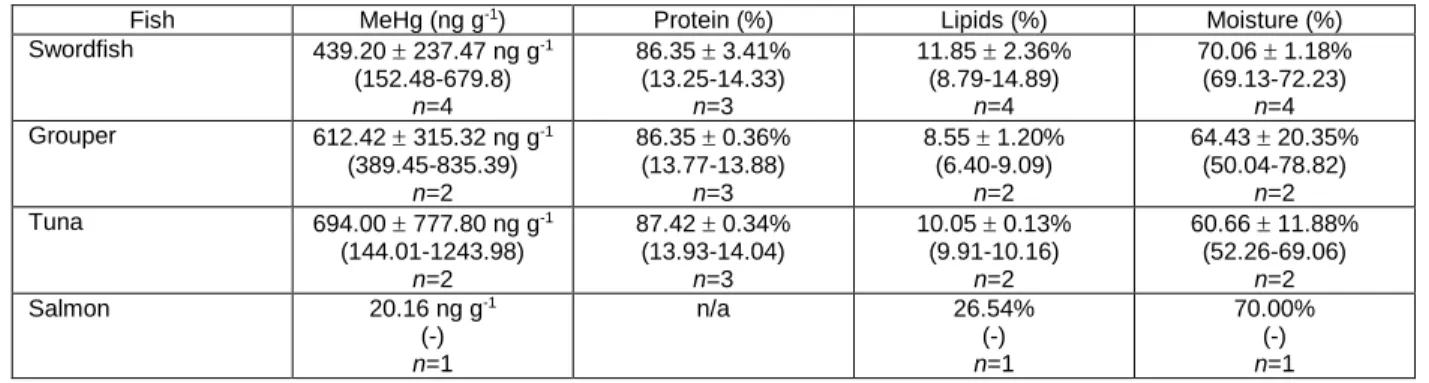
Mean MeHg concentrations in fish samples tested were below Health Canada guidelines
254
(Food Directorate Bureau of Chemical Safety, Health Canada) (500 ng g-1 for retail fish, 1000 ng
255
g-1 for swordfish and tuna) (average concentration in swordfish = 439 237 ng g-1; in grouper:
256
612 315 ng g-1; in tuna = 694 778 ng g-1 and in salmon = 20.1 ng g-1), except for one grouper
257
(835 ng g-1) and one tuna (1244 ng g-1) (Table S1). Protein, lipid and moisture content did not vary
258
across fish species (Kruskal-Wallis, P > 0.05) (Table S1), and we found no correlation between
259
MeHg bioaccessibility and lipid content in fish (P > 0.05) (Figure S1).
260
Multiple fresh filets from different individual fish were tested for each species. For grouper
261
and tuna, we observed significant differences in MeHg bioaccessibility among individual fish
262
(Kruskal-Wallis, P < 0.05) (Figure S2). Differential lipid content in the muscles tested did not
263
account for this variation, as we observed no relationship between lipids and raw bioaccessibility
264
percentages when considering the four fish species tested in this study (Figure S2). The use of
265
only one salmon in this study may mask potential variation between fish, and inter-individual
266
absolute bioaccessibility may vary in ways similar to grouper and tuna. However, this study does
267
not aim to report absolute bioaccessibility values, and trends from treatments experiments were
268
robust across individuals for all species (see Sections 3.2 & 3.3).
269 270 271
3.2. Effects of cooking and freezing on MeHg bioaccessibility 272
Cooking had a significant impact on MeHg bioaccessibility compared to raw controls in all
273
fish species tested. In swordfish (Kruskal-Wallis, P < 0.05) (Figure 1A), on average, MeHg
274
bioaccessibility was reduced to 12.6 5.6% of control values across all cooking treatments.
275
Grilling and frying at maximal temperatures (150 and 160 C) reduced bioaccessibility to 18.0
276
5.6 and 7.1 1.2% respectively, while boiling decreased bioaccessibility to 8.4 3.0% of control
277
values (Figure 1A). Lower temperatures or cooking times did not yield significantly greater
278
bioaccessibility losses (P > 0.05). The effect of cooking was consistent for grouper (18.6 10.3%),
279
tuna (12.2 5.5%) and salmon (10.9 6.7%) (P < 0.05) (Figure 1B-D). In all fish species, frying
280
tended to be the most effective at reducing MeHg bioaccessibility, but this trend was not significant
281
(P > 0.05) (Figure 1).
When swordfish samples were frozen, decreasing freezing temperatures, from -20 to -80
283
C and flash freezing did not lead to significantly different MeHg bioaccessibility levels (P > 0.05)
284
(Figure S3).
285 286
3.3. Effects of co-ingested foods and polyphenols on MeHg bioaccessibility 287
We tested the effects of co-ingested foods on MeHg bioaccessibility in swordfish and in
288
tuna compared to unamended raw controls (Figure 2). As previous reports have suggested that
289
polyphenols were responsible for altered MeHg bioaccessibility from fish (He and W.-X. Wang,
290
2011; Ouédraogo and Amyot, 2011; Shim et al., 2009), we selected several polyphenol-rich foods
291
and beverages, and one food not enriched in polyphenols (cornstarch). Our results show that
292
green tea led to the lowest MeHg bioaccessibility values in swordfish (22.7 3.8% when 120 mg
293
was used) (Figure 2A-B) and in tuna (34.8 5.6% with 120 mg of tea) (P < 0.05) (Figure 2C).
294
Black tea also significantly decreased MeHg bioaccessibility in swordfish (28.6 13.9% with 120
295
mg of tea) (P < 0.05). The effect of tea was greater when 120 mg of dried tea (equivalent to
296
approximately 375 mL of prepared tea) was used compared to 40 mg (approximately 125 mL).
297
As expected, cornstarch, which contained negligible amounts of polyphenols (Table S2) had no
298
effect on MeHg bioaccessibility (Figure 2B). Coffee and instant coffee had a slight, yet
non-299
significant effect, while blueberries had no detectable impact (P > 0.05) (Figure 2C). Therefore, it
300
appears only some polyphenol-rich beverages can alter MeHg bioaccessibility.
301
To identify which compounds may be responsible for this effect, we quantified 56
302
polyphenols in the foods that were used in bioaccessibility experiments. Of these, we found that
303
gallic acid and flavonoids (including flavanol quercetins such as rutin, and flavon-3-ol catechins
304
and theaflavins) were abundant in green and black tea, and in small or undetectable amounts in
305
the other tested co-foods (Table S2). Multivariate analysis showed that treatments with the
306
greatest decreases in bioaccessibility in this experiment were positively associated with certain
307
polyphenol groups such as catechins, quercetins, thearubigins and kaempferols (Figure S4).
308
To verify the hypothetical role of these polyphenols on MeHg bioaccessibility, we repeated
309
PBET simulations using individual purified polyphenol compounds. First, we observed that the
310
effect of polyphenols increased with the amount added to digestion experiments, from 5 to 10 mg
311
(Figure 3). However, while catechin is cited in the literature as a hypothetical driver of reduced
312
MeHg bioaccessibility (He and W.-X. Wang, 2011), we found its purified form had no significant
313
effect (P > 0.05) (Figure 3A). Other forms of catechin, including cis-configuration epicatechin and
314
epigallocatechin gallate (EGCG) did significantly limit MeHg bioaccessibility to 61.7 4.5 and 47.0
315
15.5% of unamended control, respectively (P < 0.05). Another flavon-3-ol (rutin) and a
hydroxycinnamic acid (cafeic acid) also significantly reduced bioaccessibility to 55.6 1.9%, and
317
44.8 12.5%, respectively (P < 0.05) (Figure 3).
318 319
3.4. Effects of multiple dietary practices on MeHg bioaccessibility 320
Applied separately, cooking and polyphenols (as beverages or purified compounds) both
321
impacted MeHg bioaccessibility compared to raw, unamended controls (Figures 1-3). We tested
322
these treatments together within the same experiment, to assess their combined effects. Cooking
323
swordfish (by grilling, frying or boiling) and digesting it with 120 mg of green or black tea led to
324
less than 1% of MeHg remaining bioaccessible (P < 0.05, Figure 4A and B). Combining cooking
325
and 10 mg of purified gallic acid or catechin also significantly decreased MeHg bioaccessibility,
326
to 2-17% of bioaccessible MeHg compared to raw unamended controls (Figure 4C and D) (P <
327
0.05). The combined effects of cooking and co-ingested polyphenols (as beverages or purified
328
extracts) were also observed in grouper (P < 0.05, Figure S6) and tuna (P < 0.05, Figure S7). In
329
all cases, boiling combined with green or black tea were the most effective combination to reduce
330
MeHg bioaccessibility, decreasing bioaccessibility by 99% compared to raw, unamended controls
331
(P < 0.05, Figure 4, S6 and S7).
332 333
3.5. Bioaccessibility and risk assessments 334
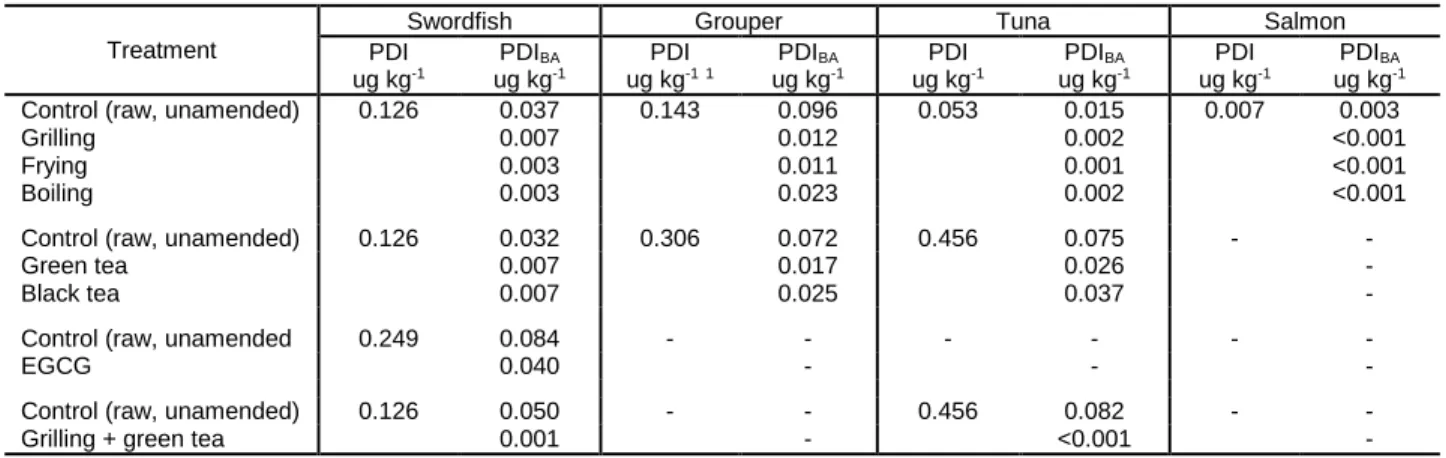
Finally, we compared PDIs for an average adult calculated with the MeHg concentration
335
measured in tested fish, to corrected PDIBAs considering bioaccessibility and the effect of dietary
336
practices. This is a theoretical exercise in the absence of in vivo-validated results, and is
337
presented here only to compare the impact of different treatments, rather than to estimate realistic
338
PDIs. Table S4 shows that the estimated daily intake for an adult is greatly reduced when
339
bioaccessibility is considered. All values calculated from MeHg concentrations were below the
340
provisional tolerable daily intake (the maximum amount of MeHg that can be ingested daily over
341
a lifetime without increasing risk of health effects) established by the World Health Organization
342
(0.23 ug kg-1 d-1) (Joint FAO/WHO Expert Committee on Food Additives, 2007).
343 344
4. Discussion
345 346
4.1. Cooking reduces MeHg bioaccessibility from fish; freezing has no effect 347
Several studies have shown that cooking increases Hg concentrations in fish (Burger et
348
al., 2003; Morgan et al., 1997; Perelló et al., 2008). It has been suggested that this may be due
to weight loss due to moisture and fat loss during cooking (Morgan et al., 1997). When considering
350
bioaccessibility however, studies consistently show a reduction of solubilized Hg (Ouédraogo and
351
Amyot, 2011; Torres-Escribano et al., 2011) and MeHg (He and W.-X. Wang, 2011) from cooked
352
fish muscle. Our results on MeHg bioaccessibility were consistent with these earlier findings
353
(Figure 1). Here we expanded on these studies by comparing multiple temperatures and cooking
354
times for each cooking treatment, and we found no significant differences between 100 and 150
355
C for grilling, 100 and 160 C and frying, nor for 5 and 10 minutes for boiling (Figure 1). All
356
temperatures tested were greater than 70 C, the safe internal cooking temperature
357
recommended by Health Canada (Health Canada First Nations Branch, Government of Canada,
358
2016). However, while fish cooked by consumers may reach this safe internal threshold, higher
359
temperatures are typically used when preparing meals. Indeed, temperatures greater than 100
360
C are typically used in studies measuring the effects of cooking on metals (Devesa et al., 2001;
361
Ersoy et al., 2006) and heterocyclic amines (Oz et al., 2007). It is likely that the impact of heat on
362
MeHg solubilization increases until a given temperature (below 100 C), and further increases
363
have no effect on MeHg bioaccessibility within the range of temperatures commonly used in
364
cooking. Protein aggregation induced by high temperatures, leading to lowered pepsin
365
digestibility, may explain these results. Cooking has also been found to induce the formation of
366
disulfide bonds in proteins, which may further limit digestibility (Duodu et al., 2002; He et al., 2010;
367
Kulp et al., 2003). This is supported by observations that heat induces structural changes to meat:
368
at temperatures greater than 100 C, oxidation can cause protein aggregation, slowing enzymatic
369
digestion by pepsin (Bax et al., 2012).
370
It is important to note that these experiments were performed on small (1 g) sub-samples
371
of fish muscle, which were thoroughly cooked during treatments. It is likely that in a thicker and
372
larger fish filet more representative of an adult portion (150 g as per Health Canada) (Bureau of
373
Chemical Safety Health Canada, 2007), cooking has more heterogeneous effects: temperature
374
may not be even throughout the portion, and structural protein changes that might control MeHg
375
bioaccessibility may vary across filet thickness. Nonetheless, these experiments on small test
376
meals do provide insight into the effect of temperature on MeHg solubilization from proteins.
377
Future experiments on cooking and MeHg should include portion-sized fish for a more realistic
378
portrait of bioaccessibility.
379
Freezing can induce protein denaturation and physicochemical changes to meat (Farouk
380
et al., 2004; Sanza et al., 1999). In a study of 27 samples of frozen swordfish, Torres-Escribano
381
et al. suggested that variations in Hg bioaccessibility from 38-83% (64 14%) may be attributable
382
to protein denaturation caused by different freezing and thawing rates, or varying storage
temperatures (Torres-Escribano et al., 2010). In this study, we observed no relationship between
384
bioaccessibility and colder temperatures. However, since all the fish tested in this study were
385
purchased commercially, they had all likely been frozen before, as freezing is widely used in fish
386
processing to prevent spoilage (George, 1993). While this industrial freezing performed after
387
catch to conserve fish may alter bioaccessibility, our results suggest that a second freezing has
388
no impact. Therefore, consumers who freeze commercially-purchased fish are unlikely to further
389
impact MeHg bioaccessibility (Figure S3).
390 391
4.2. Plant polyphenols found in tea can limit MeHg solubilization 392
As plant metabolites present in all plant organs, polyphenols are an important component
393
of human diets (Bravo, 2009), and dietary intake of flavonoids alone (which include the different
394
catechins) has been estimated at 187 mg d-1 in the US (Chun et al., 2007). While they are of great
395
interest in nutrition due to their ability to bind and precipitate certain molecules, and for their
396
antioxidant effects in humans (Bravo, 2009), it is likely their role in metal chelation (Graham, 1992;
397
Hider et al., 2001; Ragan et al., 1979; T. Wang et al., 2009) that drives their impact on MeHg
398
bioaccessibility. We found that certain polyphenol-rich foods, such as green and black tea, could
399
significantly reduce MeHg bioaccessibility, and that the effect increased with the amount of tea
400
added (Figure 2). However, not all foods limited bioaccessibility: blueberries (rich in
401
anthocyanidins) (Table S3), had no significant impact on MeHg bioaccessibility, suggesting that
402
not all polyphenols have metal chelating properties.
403
The amounts of dried tea used in our experiments roughly reflect the ratio of one cup of
404
tea consumed with one portion (150 g) of fish. The polyphenol molecules found in tea are
405
suspected to reduce MeHg and Hg bioaccessibility (He and W.-X. Wang, 2011; Ouédraogo and
406
Amyot, 2011; Shim et al., 2009) but the causal role of polyphenols was not directly investigated.
407
Here, we tested a wide range of purified polyphenols to confirm their role in decreasing MeHg
408
bioaccessibility, and to identify which compounds may be responsible for the effects of tea. Our
409
results suggest that EGCG, caffeic acid and rutin likely have the greatest chelating properties
410
(Figure 3), possibly forming insoluble complexes with MeHg and decreasing bioaccessibility.
411
Indeed, metals chelated to polyphenols are considered to have low bioavailability: in humans,
412
consumption of large amounts of tea or polyphenols is associated with poor iron absorption and
413
anemia (Baynes and Bothwell, 1990). Our findings from fish and polyphenols support the results
414
of Jadan Piedra et al., who tested the effects of catechin and tannic acids on bioaccessibility in
415
standard MeHg aqueous solutions (Jadán Piedra et al., 2016). Other polyphenols that were
416
measured in co-foods (Table S3) but that were not tested in their purified form could also
contribute to the effect of tea. Indeed, kaempferols, thearubigins or quercetins other than rutin
418
may have a similar effect as EGCG for example (Figure S4). Their role should be investigated,
419
by testing more compounds in bioaccessibility assays. Furthermore, tea may include other
420
compounds that could limit MeHg bioaccessibility. Tea leaves growing in certain areas of China
421
has been found to be enriched in selenium (Molan et al., 2009), and selenium can interfere with
422
Hg toxicity and bioaccessibility (Cabañero et al., 2006; 2004). While our results from purified
423
polyphenols suggest that these compounds are the main drivers of the effects of tea on MeHg
424
bioaccessibility, other molecules in the beverage may also have a role to play.
425
426
Tea polyphenols may also have other impacts on the fate of MeHg in the body: in vivo
427
assays have suggested that tea could accelerate enterohepatic cycling of MeHg in the body
428
(Canuel et al., 2006b) or that tea extracts may limit oxidative stress induced by MeHg in rats and
429
alter its pharmacokinetics (Black et al., 2011). Green tea has also been found to increase Hg load
430
in blood after consumption of MeHg-contaminated fish (Janle et al., 2015). These mechanisms
431
should be further investigated through controlled in vivo experiments.
432 433
4.3. Bioaccessibility studies can be used to inform current guidelines 434
Studies performed on Hg and MeHg bioaccessibility in fish report values that range from
435
9-100%, with large variations often seen within a single species (Table 1). However, over half of
436
the values reported in Table 1 are below 50%, suggesting that only a fraction of mercury is
437
solubilized (bioaccessible) during simulated digestion, and thus potentially available for
438
absorption and metabolism in the intestine and liver (bioavailable) (Afonso et al., 2015a). Current
439
guidelines and recommendations assume that 100% of MeHg in fish is readily absorbed by the
440
gastrointestinal tract (Committee on Toxicological Effects of Methylmercury, National Research
441
Council of the United States, 2010; Ha et al., 2016). This value is based on early work on the
442
excretion of an orally administered radio-labelled MeHg nitrate solution from the human body
443
(Aberg et al., 1969). However, mercury in fish is more typically bound to sulfur-rich groups such
444
as thiols (Clarkson and Magos, 2008; Harris, 2003), and may behave differently. This suggests
445
that the form of Hg and its complexation to food or other elements may reduce its absorption, and
446
that the 100% MeHg absorption rate likely overestimates what is bioavailable from fish. When
447
considering raw tuna, our PDI estimate which accounts for incomplete bioaccessibility (PDIBA) is
448
71.7% lesser than PDI (Table S4).
449
These results are amplified when considering not only bioaccessibility, but also dietary
450
practices. Indeed, when the effects of cooking are included in PDI calculations,
corrected PDIBAs are reduced by 70.6 – 98.1% across all fish species (Table S4). As most fish
452
consumed in North America is cooked (with the exception of sushi as well as traditional practices
453
in indigenous communities), not including this factor in guidelines leads to overestimating MeHg
454
exposure in most populations. If PDIs are corrected for green and black tea consumption, the
455
bioaccessibility-corrected PDIBA is reduced by 74.6 – 94.4% (Table S4). Finally, when correcting
456
PDI for bioaccessibility data from a meal that is both cooked and consumed with a cup of tea,
457
PDIBA drops by 99%, to less than 1 ng kg-1 (Table S4). All PDIs presented here, calculated from
458
commercially-purchased fish, were below the WHO’s maximal provisional tolerable daily intake
459
(PTDI) (0.23 ug kg-1) (Joint FAO/WHO Expert Committee on Food Additives, 2007).
460
It is important to note that these PDIBAs are calculated from the results of a simplified in
461
vitro system. While these estimates do not replace in vivo or epidemiological studies, they provide 462
valuable insight into the ways Hg is solubilized from food in the gut, and may explain
population-463
based variations in Hg toxicological responses (Canuel et al., 2006a; Chapman and Chan, 2000).
464
These bioaccessibility-based results can be used to guide more informative, but more costly in
465
vivo studies, and in vitro assays may be of particular relevance to populations who frequently 466
consume fish that are more heavily contaminated than commercially-monitored species. This
467
includes recreational fishermen, coastal populations who often depend heavily on fish
(Cisneros-468
Montemayor et al., 2016), and indigenous groups like the Inuit who’s reliance on marine mammals
469
and fish exposes them to higher dietary MeHg intake (Laird et al., 2013). In communities where
470
food insecurity is a major public health issue, such as in the Canadian Arctic, advisories can have
471
negative outcomes (Laird et al., 2013). If validated by in vivo studies, cooking and polyphenol-rich
472
foods could thus be easily implementable recommendations to reduce exposure to Hg. This could
473
promote safe consumption of fish as a source of fatty-acids, which could protect from
474
cardiovascular disease (Mahaffey et al., 2011; Rideout and Kosatsky, 2017).
475
While in vitro bioaccessibility assays suggest that guidelines may overestimate MeHg
476
exposure from fish, it is important to consider that these guidelines are designed to be overly
477
conservative, in order to to protect especially vulnerable groups. These individuals, including
478
children and pregnant women, are particularly sensitive to MeHg-induced health risks (Committee
479
on the Toxicological Effects of MeHg). Criticism of guidelines should thus keep in mind the specific
480
needs of vulnerable sub-groups.
481 482
4.4. Other factors may alter MeHg bioaccessibility 483
Other factors may also impact MeHg bioaccessibility, that were not taken into account
484
here. The majority of bioaccessibility studies performed on MeHg in fish use
purchased filets, hence the type of muscle and the area of the fish sampled are unknown. Fish
486
muscles are diverse in terms of physiological function and cellular composition (Sänger and
487
Stoiber, 2001). Furthermore, other elements found in fish could influence bioaccessibility, such
488
as selenium and its ratio to Hg (Cabañero et al., 2006; 2004). Future research into
within-489
individual variations of MeHg bioaccessibility should include gradients along muscle tissues, and
490
perform full characterizations of muscles, to further our understanding of how Hg binds fish
491
muscle tissue in fish.
492
MeHg bioaccessibility has also been found to be limited by co-ingested plant products
493
such as dietary fibers (Shim et al., 2009) and plant cell walls compounds (lignin, methylcellulose,
494
pectin) (Jadán Piedra et al., 2016). Studies conducted on rats fed with intrinsically
MeHg-495
contaminated food matrices also show that plant compounds can limit absorption (Yannai and
496
Sachs, 1993). Current guidelines do not take into consideration complex diets, accounting only
497
for MeHg measured in fish muscle. Our results combined with others from the literature suggest
498
that ignoring plant-based co-foods, which contain polyphenols and dietary fiber may lead to
499
overestimations of Hg intake from fish. Risk assessments also overlook cooking and the
500
combined effect of different processes involved in preparing a meal, contributing to this lack of
501
realism.
502
Host genetics, including the gut microbiome could also potentially alter the fate of Hg in
503
the body, as has been observed with other metals. For example, toxic species of arsenic and
504
bismuth can be produced by gut bacteria prior to absorption by the epithelial lining (Diaz-Bone
505
and Van de Wiele, 2010; Van de Wiele et al., 2010), and Laird et al. observed increased arsenic
506
bioaccessibility in the presence of a simulated gut microbiome community, compared to sterile
507
conditions (Laird et al., 2009b). While in vivo methylation would increase Hg toxicity, this pathway
508
has not yet be observed in primates (Gilmour et al., 2013; Martín-Doimeadios et al., 2017).
509
Evidence for MeHg demethylation by the microbiome has been reported from mice models,
510
producing poorly-absorbed inorganic Hg (Rowland, 1988). Meanwhile the mer operon,
511
responsible for mercury resistance and cell membrane transport, is frequent: a study of 800
512
antibiotic-resistance plasmids from Gram- bacteria have been found to carry the operon (Schottel
513
et al., 1974). This may allow it to alter Hg cycling in the gut. Lactic acid bacteria have been found
514
to reduce Hg bioaccessibility in mushrooms and aqueous solutions, but not in seafood
(Jadán-515
Piedra et al., 2017a; 2017b). Interactions between dietary Hg and the microbiome are thus
516
unclear, and should be explored further.
517 518
4.5. In vitro findings must be validated to improve current risk assessments
In vitro gastrointestinal models are useful to understand the fate of food components and 520
contaminants in the human body, as they are inexpensive and easy to use. They allow for
521
screening high numbers of samples in a controlled setting, can be validated with reference
522
materials, and avoid ethical considerations of using model animals, which can be more or less
523
relevant to humans (Fernández-García et al., 2009).
524
Bioaccessibility assays have been suggested as a way to improve risk assessments
525
(Cardoso et al., 2014) and guidelines (Ángeles García et al., 2016). However, in vitro models are
526
rarely validated because of the lack of in vivo experiments using consumer products in
527
contaminant studies (Brandon et al., 2006; Hur et al., 2011). In vitro studies could be improved
528
by integrating cell cultures such as Caco-2, to account for membrane transport (Hur et al., 2011;
529
Moreda-Piñeiro et al., 2011), but this does not take into account whole-body processes that could
530
alter the fate of Hg, such as stimulation of the enterohepatic cycle (Canuel et al., 2006b) or
531
interactions with the gut microbiome, which are also determinants of bioavailability. Future work
532
should involve in vivo experiments, to validate the effects of dietary practices and co-foods on Hg
533
bioaccessibility. In vitro investigations remain useful, as they offer insight into the structural and
534
complexation changes that Hg undergoes during food preparation and digestion, and provide
535
evidence that it would be worthwhile to embark on costly and ethically-loaded in vivo assays. We
536
recommend that further work on the fate of MeHg in the body should be performed in animal
537
models such as swine, which are considered appropriate for human health risk assessments
538
(Moreda-Piñeiro et al., 2011).
539
Culturally-specific guidelines may also be necessary: for example, current
540
pharmacokinetic models are poor predictors of Hg burden in Canadian indigenous populations
541
(Canuel et al., 2006a), who have a different genetic background, but who also have specific
542
dietary practices regarding food preparation and co-foods. This supports observations made by
543
a European study on MeHg risk assessment, which showed that guidelines should be population
544
and country-specific (Jacobs et al., 2016). While smaller, low-trophic level fish could be
545
recommended over more contaminated species to promote fish intake, this solution may not be
546
implementable in developing countries or coastal populations who rely on high-trophic level
547
organisms. Risk assessments based from validated bioaccessibility data could provide specific
548
recommendations for various populations, who are exposed to dietary MeHg in different ways.
549
This may lead to easily applicable, non-invasive guidelines that allow a population to adapt its
550
food preparation to limit exposure to Hg in culturally important foods. This could be of critical
551
importance for coastal indigenous populations, which have a per capita fish consumption 15 times
552
greater than non-indigenous peoples (Cisneros-Montemayor et al., 2016). Altering MeHg
bioaccessibility through dietary practices in these populations could have important
554
consequences on Hg absorption and health. Since fish are an excellent source of protein,
555
vitamins, fatty acids and minerals which feed a significant portion of the world’s population and
556
are associated with cardiac health, it is critical to better understand the risk that Hg in fish
557
represents to human health.
558 559
References
560
Abdelouahab, N., Vanier, C., Baldwin, M., Garceau, S., Lucotte, M., Mergler, D., 2008.
561
Ecosystem matters: Fish consumption, mercury intake and exposure among fluvial lake
562
fish-eaters. Science of the Total Environment 407, 154–164.
563
doi:10.1016/j.scitotenv.2008.09.004
564
Aberg, B., Ekman, L., Falk, R., Greitz, U., Persson, G., Snihs, J.O., 1969. Metabolism of methyl
565
mercury (203Hg) compounds in man. Archives of Environmental Health: An International
566
Journal 19, 478–484. doi:10.1080/00039896.1969.10666872
567
Afonso, C., Costa, S., Cardoso, C., Bandarra, N.M., Batista, I., Coelho, I., Castanheira, I.,
568
Nunes, M.L., 2015a. Evaluation of the risk/benefit associated to the consumption of raw and
569
cooked farmed meagre based on the bioaccessibility of selenium, eicosapentaenoic acid
570
and docosahexaenoic acid, total mercury, and methylmercury determined by an in vitro
571
digestion model. Food Chemistry 170, 249–256. doi:10.1016/j.foodchem.2014.08.044
572
Afonso, C., Costa, S., Cardoso, C., Oliveira, R., Lourenço, H.M., Viula, A., Batista, I., Coelho, I.,
573
Nunes, M.L., 2015b. Benefits and risks associated with consumption of raw, cooked, and
574
canned tuna (Thunnus spp.) based on the bioaccessibility of selenium and methylmercury.
575
Environmental Research 1–8. doi:10.1016/j.envres.2015.04.019
576
Ángeles García, M., Núñez, R., Alonso, J., Melgar, M.J., 2016. Total mercury in fresh and
577
processed tuna marketed in Galicia (NW Spain) in relation to dietary exposure. Environ Sci
578
Pollut Res 1–10. doi:10.1007/s11356-016-7634-9
579
Bax, M.-L., Aubry, L., Ferreira, C., Daudin, J.-D., Gatellier, P., Rémond, D., Santé-Lhoutellier,
580
V., 2012. Cooking temperature is a key determinant of in vitro meat protein digestion rate:
581
investigation of underlying mechanisms. J. Agric. Food Chem. 60, 2569–2576.
582
doi:10.1021/jf205280y
583
Baynes, R.D., Bothwell, T.H., 1990. Iron Deficiency. Annu. Rev. Nutr. 10, 133–148.
584
doi:10.1146/annurev.nu.10.070190.001025
585
Black, P., Niu, L., Sachdeva, M., Lean, D., Poon, R., Bowers, W.J., Chan, H.M., Arnason, J.T.,
586
Pelletier, G., 2011. Modulation of the effects of methylmercury on rat neurodevelopment by
587
co-exposure with Labrador Tea (Rhododendron tomentosum ssp. subarcticum). Food and
588
Chemical Toxicology 49, 2336–2342. doi:10.1016/j.fct.2011.06.035
589
Brandon, E.F.A., Oomen, A.G., Rompelberg, C.J.M., Versantvoort, C.H.M., van Engelen,
590
J.G.M., Sips, A.J.A.M., 2006. Consumer product in vitro digestion model: Bioaccessibility of
591
contaminants and its application in risk assessment. Regulatory Toxicology and
592
Pharmacology 44, 161–171. doi:10.1016/j.yrtph.2005.10.002
593
Bravo, L., 2009. Polyphenols: Chemistry, dietary sources, metabolism, and nutritional
594
significance. Nutrition Reviews 56, 317–333. doi:10.1111/j.1753-4887.1998.tb01670.x
595
Bureau of Chemical Safety Health Canada, 2007. Human health risk assessment of mercury in
596
fish and health benefits of fish consumption.
597
Bureau of Chemical Safety Health Canada, 2004. Fish consumption: Review and
598
recommendation of current intake figures for Canadian consumers.
599
Burger, J., Dixon, C., Boring, S., Gochfeld, M., 2003. Effect of deep-frying fish on risk from
600
mercury. Journal of Toxicology and Environmental Health, Part A 66, 817–828.
601
doi:10.1080/15287390306382
602
Cabañero, A.I., Madrid, Y., Cámara, C., 2006. Selenium long-term administration and its effect
603
on mercury toxicity. J. Agric. Food Chem. 54, 4461–4468. doi:10.1021/jf0603230
604
Cabañero, A.I., Madrid, Y., Cámara, C., 2004. Selenium and mercury bioaccessibility in fish
605
samples: an in vitro digestion method. Analytica Chimica Acta 526, 51–61.
606
doi:10.1016/j.aca.2004.09.039
607
Calatayud, M., Devesa, V., Virseda, J.R., Barberá, R., Montoro, R., Vélez, D., 2012. Mercury
608
and selenium in fish and shellfish: Occurrence, bioaccessibility and uptake by Caco-2 cells.
Food and Chemical Toxicology 50, 2696–2702. doi:10.1016/j.fct.2012.05.028
610
Canuel, R., de Grosbois, S.B., Atikessé, L., Lucotte, M., Arp, P., Ritchie, C., Mergler, D., Chan,
611
H.M., Amyot, M., Anderson, R., 2006a. New Evidence on Variations of Human Body Burden
612
of Methylmercury from Fish Consumption. Environ. Health Perspect. 114, 302–306.
613
doi:10.1289/ehp.7857
614
Canuel, R., de Grosbois, S.B., Lucotte, M., Atikessé, L., Larose, C., Rheault, I., 2006b. New
615
evidence on the effects of tea on mercury metabolism in humans. Archives of
616
Environmental & Occupational Health 61, 232–238. doi:10.3200/AEOH.61.5.232-238
617
Cardoso, C., Afonso, C., Lourenço, H., Costa, S., Nunes, M.L., 2014. Bioaccessibility
618
assessment methodologies and their consequences for the risk-benefit evaluation of food.
619
Trends in Food Science & Technology 1–19. doi:10.1016/j.tifs.2014.08.008
620
Chapman, L., Chan, H.M., 2000. The influence of nutrition on methyl mercury intoxication.
621
Environ. Health Perspect. 108, 29–56.
622
Chun, O.K., Chung, S.J., Song, W.O., 2007. Estimated dietary flavonoid intake and major food
623
sources of U.S. adults. The Journal of Nutrition 137, 1244–1252.
624
Cisneros-Montemayor, A.M., Pauly, D., Weatherdon, L.V., Ota, Y., 2016. A global estimate of
625
seafood consumption by coastal Indigenous peoples. PLoS ONE 11, e0166681–16.
626
doi:10.1371/journal.pone.0166681
627
Clarkson, T.W., Magos, L., 2008. The toxicology of mercury and its chemical compounds.
628
Critical Reviews in Toxicology 36, 609–662. doi:10.1080/10408440600845619
629
Cole, D.C., Kearney, J., Sanin, L.H., LeBlanc, A., Weber, J.-P., 2004. Blood mercury levels
630
among Ontario anglers and sport-fish eaters. Environmental Research 95, 305–314.
631
doi:10.1016/j.envres.2003.08.012
632
Committee on Toxicological Effects of Methylmercury, National Research Council of the United
633
States, 2010. Toxicological effects of methylmercury. National Academies of Science.,
634
Washington.
635
De Mendiburu, F., 2012. R package agricolae: Statistical Procedures for Agricultural Research.
636
Devesa, V., Martínez, A., Súñer, M.A., Vélez, D., Almela, C., Montoro, R., 2001. Effect of
637
cooking temperatures on chemical changes in species of organic arsenic in seafood. J.
638
Agric. Food Chem. 49, 2272–2276. doi:10.1021/jf0013297
639
Diaz-Bone, R.A., Van de Wiele, T., 2010. Biotransformation of metal(loid)s by intestinal
640
microorganisms. Pure and Applied Chemistry 82, 1–19. doi:10.1351/PAC-CON-09-06-08
641
Dong, Z., Yan, K., Liu, Y., Naidu, R., Duan, L., Wijayawardena, A., Semple, K.T., Rahman,
642
M.M., 2016. A meta-analysis to correlate lead bioavailability and bioaccessibility and predict
643
lead bioavailability. Environment International 92-93, 139–145.
644
doi:10.1016/j.envint.2016.04.009
645
Duodu, K.G., Nunes, A., Delgadillo, I., Parker, M.L., Mills, E.N.C., Belton, P.S., Taylor, J.R.N.,
646
2002. Effect of grain structure and cooking on sorghum and maize in vitro protein
647
digestibility. Journal of Cereal Science 35, 161–174. doi:10.1006/jcrs.2001.0411
648
Ersoy, B., Yanar, Y., Küçükgülmez, A., Çelik, M., 2006. Effects of four cooking methods on the
649
heavy metal concentrations of sea bass fillets (Dicentrarchus labrax Linne, 1785). Food
650
Chemistry 99, 748–751. doi:10.1016/j.foodchem.2005.08.055
651
Farouk, M.M., Wieliczko, K.J., Merts, I., 2004. Ultra-fast freezing and low storage temperatures
652
are not necessary to maintain the functional properties of manufacturing beef. Meat Science
653
66, 171–179. doi:10.1016/S0309-1740(03)00081-0
654
Fernández-García, E., Carvajal-Lérida, I., Pérez-Gálvez, A., 2009. In vitro bioaccessibility
655
assessment as a prediction tool of nutritional efficiency. Nutrition Research 29, 751–760.
656
doi:10.1016/j.nutres.2009.09.016
657
Folch, J., Lees, M., Sloane Stanley, G.H., 1957. A simple method for the isolation and
658
purification of total lipides from animal tissues. Journal of Biological Chemistry 226, 497–
659
509.
Food and Agriculture Organization, 2016. The State of World Fisheries and Aquaculture
661
(SOFIA). Department of Food and Agriculture Organization of the United Nations.
662
Food Directorate Bureau of Chemical Safety, Health Canada, n.d. Canadian standards
663
(maximum levels) for various chemical contaminants in foods.
664
George, R.M., 1993. Freezing proceseses used in the food industry. Trends in Food Science &
665
Technology 4, 134–138. doi:10.1016/0924-2244(93)90032-6
666
Gilmour, C.C., Podar, M., Bullock, A.L., Graham, A.M., Brown, S.D., Somenahally, A.C., Johs,
667
A., Hurt, R.A., Jr., Bailey, K.L., Elias, D.A., 2013. Mercury methylation by novel
668
microorganisms from new environments. Environ. Sci. Technol. 47, 11810–11820.
669
doi:10.1021/es403075t
670
Graham, H.N., 1992. Green tea composition, consumption, and polyphenol chemistry.
671
Preventive Medicine 21, 334–350. doi:10.1016/0091-7435(92)90041-F
672
Ha, E., Basu, N., Bose-O’Reilly, S., Dórea, J.G., McSorley, E., Sakamoto, M., Chan, H.M.,
673
2016. Current progress on understanding the impact of mercury on human health.
674
Environmental Research 152, 419–433. doi:10.1016/j.envres.2016.06.042
675
Harris, H.H., 2003. The chemical form of mercury in fish. Science 301, 1203–1203.
676
doi:10.1126/science.1085941
677
He, M., Ke, C.-H., Wang, W.-X., 2010. Effects of cooking and subcellular distribution on the
678
bioaccessibility of trace elements in two marine fish species. J. Agric. Food Chem. 58,
679
3517–3523. doi:10.1021/jf100227n
680
He, M., Wang, W.-X., 2011. Factors affecting the bioaccessibility of methylmercury in several
681
marine fish species. J. Agric. Food Chem. 59, 7155–7162. doi:10.1021/jf201424g
682
Health Canada, 2004. Canadian Community Health Survey, cycle 2.2.
683
Health Canada First Nations Branch, Government of Canada, 2016. Fish and Shellfish Safety -
684
Food Safety: Information for First Nations.
685
Hider, R.C., Liu, Z.D., Khodr, H.H., 2001. Metal chelation of polyphenols, in: Flavonoids and
686
Other Polyphenols, Methods in Enzymology. Elsevier, pp. 190–203.
doi:10.1016/S0076-687
6879(01)35243-6
688
Hur, S.J., Lim, B.O., Decker, E.A., McClements, D.J., 2011. In vitro human digestion models for
689
food applications. Food Chemistry 125, 1–12. doi:10.1016/j.foodchem.2010.08.036
690
Jacobs, S., Sioen, I., Jacxsens, L., Domingo, J.L., Sloth, J.J., Marques, A., Verbeke, W., 2016.
691
Risk assessment of methylmercury in five European countries considering the national
692
seafood consumption patterns. Food and Chemical Toxicology 1–9.
693
doi:10.1016/j.fct.2016.10.026
694
Jadán Piedra, C., Sánchez, V., Vélez, D., Devesa, V., 2016. Reduction of mercury
695
bioaccessibility using dietary strategies. LWT - Food Science and Technology 71, 10–16.
696
doi:10.1016/j.lwt.2016.03.015
697
Jadán-Piedra, C., Alcantara, C., Monedero, V., Zuniga, M., Vélez, D., Devesa, V., 2017a. The
698
use of lactic acid bacteria to reduce mercury bioaccessibility. Food Chemistry 228, 158–
699
166. doi:10.1016/j.foodchem.2017.01.157
700
Jadán-Piedra, C., Baquedano, M., Puig, S., Vélez, D., Devesa, V., 2017b. Use of
701
Saccharomyces cerevisiae to reduce the bioaccessibility of mercury from food. J. Agric. 702
Food Chem. acs.jafc.7b00285–33. doi:10.1021/acs.jafc.7b00285
703
Janle, E.M., Freiser, H., Manganais, C., Chen, T.-Y., Craig, B.A., Santerre, C.R., 2015. Green
704
tea increases the concentration of total mercury in the blood of rats following an oral fish
705
tissue bolus. BioMed research international 2015, 1–6. doi:10.1155/2015/320936
706
Joint FAO/WHO Expert Committee on Food Additives, 2007. Evaluation of certain food
707
additives and contaminants, WHO technical report series no. Rome, Italy.
708
Kosatsky, T., Przybysz, R., Armstrong, B., 2000. Mercury exposure in Montrealers who eat St.
709
Lawrence River sportfish. Environmental Research 84, 36–43. doi:10.1006/enrs.2000.4073
710
Kulp, K.S., Fortson, S.L., Knize, M.G., Felton, J.S., 2003. An in vitro model system to predict the