©2014
Landes
Bioscience.
Do
not
distribute.
Autophagy 10:6, 986–1003; June 2014; © 2014 Landes Bioscience BAsic ReseARch PAPeR
BAsic ReseARch PAPeR
Introduction
The GABARAPL1/GEC1 (GABA[A] receptor-associated protein like 1) gene was discovered during the search for new early estrogen-induced genes in a model of guinea-pig glandular
epithelial cells.1 The encoded protein is conserved
through-out evolution from C. elegans to humans, with 100% identical
protein sequence from yeast to mammals.2 This protein also
shares a high degree of homology with the GABARAP protein,
which expresses a GABAA receptor-associated protein.3 The
*Correspondence to: Jianhua Zhang; Email: zhanja@uab.edu; Michaël Boyer-Guittaut; Email: michael.boyer-guittaut@univ-fcomte.fr Submitted: 01/17/2013; Revised: 02/18/2014; Accepted: 02/28/2014; Published Online: 04/01/2014
http://dx.doi.org/10.4161/auto.28390
The role of GABARAPL1/GEC1 in autophagic flux
and mitochondrial quality control in MDA-MB-436
breast cancer cells
Michaël Boyer-Guittaut,1,2,3,* Laura Poillet,1 Qiuli Liang,2,3 elodie Bôle-Richard,1,† Xiaosen Ouyang,2,3,4 Gloria A Benavides,2,3
Fatima-Zahra chakrama,1,‡ Annick Fraichard,1 Victor M Darley-Usmar,2,3 Gilles Despouy,1 Michèle Jouvenot,1
Régis Delage-Mourroux,1 and Jianhua Zhang2,3,4,*
1Université de Franche-comté; Laboratoire de Biochimie; eA3922 estrogènes; expression Génique et Pathologies du système Nerveux central; sciences et Techniques;
Besançon, France; 2Department of Pathology; University of Alabama at Birmingham; Birmingham, AL UsA; 3center for Free Radical Biology; University of Alabama
at Birmingham; Birmingham, AL UsA; 4Department of Veterans Affairs; Birmingham VA Medical center; Birmingham, AL UsA
current affiliation: †eFs B/F-c; iNseRM; interactions hôte-Greffon-Tumeurs & ingénierie cellulaire et Génique; Besançon, France; ‡Université de Lyon; inserm U1052;
centre de Recherche en cancérologie de Lyon; centre Léon Bérard; Lyon, France
Keywords: autophagy, breast cancer, GABARAP, GABARAPL1, GEC1, LAMP1, LC3, lysosome, MDA-MB-436, mitochondria,
mitophagy
Abbreviations: ATG, autophagy-related; CQ, chloroquine; BafA1, bafilomycin A1; DNM1L/Drp1, dynamin 1-like; ECAR, extracellular acidification rate; FCCP, carbonyl cyanide 4-(trifluoromethoxy)phenylhydrazone; GABA,
gamma-aminobutyric acid; GABAAR, gamma-aminobutyric acid type A receptor; GABARAP, GABA(A)receptor-associated protein;
GABARAPL1/GEC1, GABA(A) receptor-associated protein like 1; GABARAPL2/GATE-16, GABA(A) receptor-associated protein-like 2; GFP, green fluorescent protein; GSH, glutathione; HNE, 4-hydroxynonenal; KD, knockdown;
MAP1LC3, microtubule-associated protein 1 light chain 3; MFN1, mitofusin 1; MTT, 3-(4,5-dimethylthiazol-2-yl)-2,5-diphenyl tetrazolium bromide; NBR1, neighbor of BRCA1 gene 1; OCR, oxygen consumption rate; PBS, phosphate-buffered saline; PBS-T, PBS-Triton-X; PFA, paraformaldehyde; PPARGC1A, peroxisome proliferator-activated receptor gamma, coactivator 1alpha; PINK1, PTEN-induced putative kinase 1; PVDF, polyvinylidenedifluoride; RCR, respiratory control ratio; SDS, sodium dodecylsulfate; SQSTM1/p62, sequestosome 1; TBS-T, Tris buffered saline-Tween; TMRM, tetramethylrhodamine methyl ester
perchlorate; VDAC1, voltage-dependent anion channel 1; WT, wild type
GABARAPL1/GEC1 is an early estrogen-induced gene which encodes a protein highly conserved from C. elegans to
humans. Overexpressed GABARAPL1 interacts with GABAA or kappa opioid receptors, associates with autophagic vesicles, and inhibits breast cancer cell proliferation. however, the function of endogenous GABARAPL1 has not been extensively studied. We hypothesized that GABARAPL1 is required for maintaining normal autophagic flux, and plays an important role in regulating cellular bioenergetics and metabolism. To test this hypothesis, we knocked down GABARAPL1 expres-sion in the breast cancer MDA-MB-436 cell line by shRNA. Decreased expresexpres-sion of GABARAPL1 activated procancer responses of the MDA-MB-436 cells including increased proliferation, colony formation, and invasion. in addition, cells with decreased expression of GABARAPL1 exhibited attenuated autophagic flux and a decreased number of lysosomes. Moreover, decreased GABARAPL1 expression led to cellular bioenergetic changes including increased basal oxygen con-sumption rate, increased intracellular ATP, increased total glutathione, and an accumulation of damaged mitochondria. Taken together, our results demonstrate that GABARAPL1 plays an important role in cell proliferation, invasion, and auto-phagic flux, as well as in mitochondrial homeostasis and cellular metabolic programs.
©2014
Landes
Bioscience.
Do
not
distribute.
2 proteins share 87% sequence identity, a common
tridimen-sional structure similar to the one described for ubiquitin,4 and
serve a similar function in GABAA receptor transport.5 In
addi-tion, GEC1 was shown to interact with tubulin and promote
tubulin assembly and microtubule bundling in vitro.5 GEC1 was
later renamed GABARAPL1. The role of GABARAPL1 in the
transport of receptors is not restricted to the GABAA receptor
since it interacts with human OPRK1 (opioid receptor, kappa 1)
and enhances its trafficking to the plasma membrane.6
In rodents, GABARAPL1 is highly expressed in the brain,
and restricted to neurons.7-9 In muscle or cardiomyocytes, it
is activated after glucose deprivation, oxidative stress or
ultra-endurance exercise.10,11 In most tumor cell lines or cancer
tis-sues tested, GABARAPL1 expression is lower than noncancerous
tissues or cells.12,13 Inhibition of GABARAPL1 expression has
also been observed in muscles of Duchenne muscular dystrophy
patients,14,15 in the skeletal muscle of patients presenting an upper
motor neuron lesion15 or in the substantia nigra of Parkinson
disease patients.16 Whether the changes of GABARAPL1
expres-sion are contributing to the disease pathogenesis or compensa-tory responses to various pathological conditions is currently unclear.
Recently, we have demonstrated that GABARAPL1, like GABARAP, can associate with autophagic vesicles and is
involved in the autophagy process.2 The autophagy pathway is
a cellular degradation pathway involved in the degradation of
long-lived proteins and organelles.17-21 This is in contrast to the
proteasome pathway which is involved in the specific
degrada-tion of ubiquitinated short-lived proteins.22 Autophagy requires
more than 30 AuTophaGy-related (ATG) proteins, and the regulated formation of a double-membrane structure known as the phagophore. Following its initiation, this structure elon-gates and engulfs part of the cytoplasm containing organelles, aggregates or soluble proteins, to form a closed vesicle called the autophagosome. This vesicle will later fuse with the lysosomes, to form an autolysosome, and induce the degradation of its con-tent, a process that is involved in maintaining mitochondrial
quality and in the responses to oxidative stress.23-25 The initiation
and the elongation of this structure requires several ATG pro-teins, including orthologs of yeast Atg8, which are conjugated to phospholipids of the elongating double-membrane structure via a cycle similar to the one described for the ubiquitination of
proteins.22 These Atg8 orthologs are divided into 2 subfamilies:
the MAP1LC3 (microtubule-associated protein 1 light chain 3) family, usually abbreviated as LC3, and the GABARAP family which together comprises LC3A, B, B2 and C and GABARAP, GABARAPL1, and GABARAPL2, respectively. These proteins were initially thought to serve redundant functions in the forma-tion of the autophagosome.
Recent studies have shown that in HeLa cells, the proteins of the LC3 family are indispensable for the elongation of the dou-ble-membrane structure while the GABARAP family members
are required for the late maturation of the autophagosomes.26 In
the course of these experiments, siRNA directed against each of the 7 ATG8 orthologs inhibited SQSTM1/p62 degradation. However, cross-regulation among individual siRNAs was not
examined. Out of the 7 ATG8 family genes, Lc3b and Gabarap genes have been knocked out in mice. Mice with disruption of the Gabarap or the Lc3b gene alone are viable and without an
apparent change in phenotype.27,28 It is noteworthy that
altera-tions of the autophagy pathway have not been reported with the
Gabarap knockout mice. The fact that these animals are viable,
fertile, and do not exhibit any noticeable phenotype is in favor of the redundancy theory. Recent studies, however, have shown that Lc3b KO mice exhibited decreased autophagic vesicles in the lung after chronic exposure to cigarette smoke, suggesting that in response to a specific stimulus, individual ATG8 ortholog
genes may play important and distinct roles in autophagy.29
Consistent with these observations, one recent hypothesis to explain the high number of Atg8 orthologs in mammals is their possible involvement in different types of selective autophagy (e.g., aggrephagy, mitophagy, pexophagy, ribophagy, or
xenoph-agy).30 Adaptor proteins, such as SQSTM1, NBR1 (neighbor of
BRCA1 gene 1), and BNIP3L/NIX, interact with ubiquitinated aggregates or organelles via their ubiquitin associated domains and recruit cargos to the autophagosomes by interacting with different ATG8 members via their LC3-interacting region (W/YxxL/I). Several studies have indicated that the distinct Atg8 family members have different affinities for the specific cargos and therefore might be the missing link to explain the selectivity of the autophagy process. For example, it has been shown that all Atg8 members can bind BNIP3L in vitro but only GABARAPL1 is preferentially recruited to damaged mito-chondria in a BNIP3L-dependent manner in cells treated with
the mitochondrial uncoupler CCCP.31 Another study showed
that GABARAPL1 can specifically bind to STBD1 (starch-binding domain 1)/genethonin1 and induce glycogen
degra-dation by autophagy in a process now known as glycophagy.32
This process is also dependent on the STBD1 LC3-interacting
region and seems to be specific to GABARAPL1.33 A third
study recently demonstrated that GABARAPL1 inhibits Wnt-CTNNB1/β-catenin signaling in MCF-7 cells via the selective degradation of DVL2 (dishevelled segment polarity protein 2),
an activator of the WNT-CTNNB1 pathway.34 In addition,
overexpression of GABARAPL1 inhibits MCF-7 cell
prolifera-tion and the formaprolifera-tion of tumors in nude mice.34 Whether the
role of GABARAPL1 in regulating cell proliferation and tumor formation is linked to the degradation of DVL2 or the auto-phagy pathway has not been determined. These observations suggest that different Atg8 members may be involved in selec-tive autophagy processes linked to the degradation of specific cargos, occurring in distinct cell types or tissues or in response to different stressors.
Since GABARAPL1 is involved in glycogen degradation, relo-calizes to damaged mitochondria and interacts with BNIP3L, we hypothesized that GABARAPL1 may play an essential role in cell metabolism and in particular in energy production. This function may also explain the fact that overexpression of this protein inhibits MCF-7 breast cancer cell proliferation
and tumor formation.13,34 Indeed, it is known that highly
pro-liferating breast cancer cells need increased levels of ATP and that tumor formation requires an active autophagy pathway to
©2014
Landes
Bioscience.
Do
not
distribute.
survive under hypoxic and oxidative stress before the
vascular-ization of a solid tumor.35
In this study, we stably expressed 5 different shRNAs target-ing GABARAPL1 in the MDA-MB-436 cell line, which is the only breast cancer cell line, to our knowledge, that has detectable levels of the protein. This protocol allowed us to select cell lines targeting only GABARAPL1, without affecting GABARAP or LC3B, and study the function of this knockdown on the pheno-type of breast cancer cells. Our data showed that several shRNAs specific to GABARAPL1 decreased mRNA expression but only 2 significantly decreased levels of the GABARAPL1 protein. These stable cell lines exhibited increased cell growth, decreased autophagic flux, and decreased lysosome number. Furthermore, decreased GABARAPL1 led to increased glutathione (GSH) and ATP, increased basal respiration as well as increased numbers of mitochondria. These observations support the hypothesis that
the lower levels of GABARAPL1 in cancer cells inhibit auto-phagic flux and thereby the turnover of mitochondria leading to their accumulation and an increase of basal respiration, levels of ATP, and GSH. This increased energetic and antioxidant capac-ity in response to the suppression of GABARAPL1 could then contribute to more aggressive phenotypes in cancer cells.
Results
Establishment of GABARAPL1 knockdown stable cell lines
MDA-MB-436 cells were transfected with 5 different shRNA-GABARAPL1-expressing vectors (directed against the open reading frame of the gene) and a shRNA-control-express-ing vector, and we selected 5 antibiotic-resistant clones for each shRNA. Cells with stable transfection of shRNA-GABARAPL1
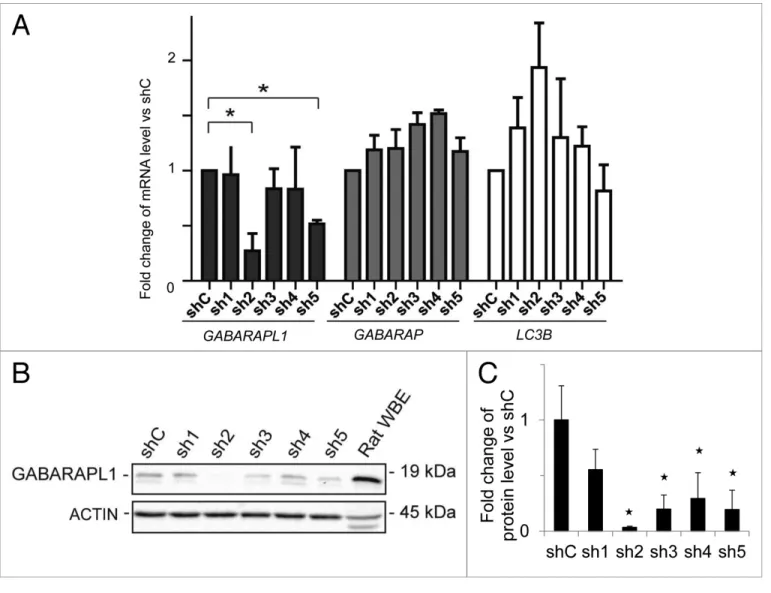
Figure 1. GABARAPL1 mRNA and protein expression are significantly decreased in the MDA-MB-436-sh2 clone. (A) GABARAPL1, GABARAP, and LC3B
mRNA expression was analyzed by qRT-PcR in the different MDA-MB-436 stable cell lines. The different stable cell lines, expressing 1 of the 5 shRNAs directed against the GABARAPL1 gene (sh1 to sh5), were compared with the stable MDA-MB-436 cell line expressing a control shRNA (shc). *P < 0.05, vs shc (n = 3). (B) GABARAPL1 expression levels in the MDA-MB-436 stable cell lines were determined by western blotting. Total proteins (40 µg) were separated on a 15% sDs-PAGe gel and immunoblotted using anti-GABARAPL1 and anti-AcTiN antibodies and the ecL Plus reagent. A representative experiment of 3 performed is shown. Rat whole brain extract (WBe) was used as a positive control of GABARAPL1 expression. (C) Quantification of the signals observed on the western blot in (B). *P < 0.05, vs shc (n = 3).
©2014
Landes
Bioscience.
Do
not
distribute.
Figure 2. GABARAPL1 knockdown promotes cell growth, colony formation, and invasion. (A) MDA-MB-436-shc, sh2 and sh5 cell growth was
deter-mined using a MTT assay over an 8-d period. All data were normalized to the number of cells at d 1 for each cell line. *P < 0.05, vs shc (n = 24). (B) MDA-MB-436-shc and sh2 cells (3,000 in 6-well plates) were grown for a period of 12 d then fixed and stained with crystal violet. The number of colonies was then determined using the Vision-capt software (VilberLourmat). A representative experiment of 3 performed is shown. *P < 0.05, vs shc (n = 3). (C) MDA-MB-436-shc and sh2 cells were grown in modified Boyden chambers coated with ecM gel. After a 24 h incubation at 37 °c, cells in the upper chamber were swabbed while cells in the lower chamber were fixed, stained with crystal violet and counted using a light microscope at a high magnification (×400). A representative experiment of 3 performed is shown. *P < 0.05, vs shc (n = 3).
sh2 exhibited the greatest decrease in the mRNA (80%) (Fig. 1A) and protein expression (96%) levels (Fig. 1B and
C) compared with the control cell line expressing the shRNA
control (shC), without changing GABARAP and LC3B mRNA levels. In a second cell line, cells with stable transfec-tion of shRNA-GABARAPL1 sh5 exhibited a 50% decrease of GABARAPL1 mRNA (Fig. 1A) and an 80% decrease in pro-tein levels (Fig. 1B and C).
GABARAPL1 regulates MDA-MB-436 proliferation, col-ony formation ability, and cell invasion
We investigated whether the decrease of GABARAPL1 expression in the MDA-MB-436 cell line would alter its tumor cell-linked features such as proliferation, colony formation, and invasion. We first performed an MTT assay over an 8-d period to determine whether GABARAPL1 regulated cell pro-liferation. We observed that the sh2 and sh5 cell lines exhibited
an increased proliferation rate compared with the shC control cell line (Fig. 2A). We also confirmed that this increase was not due to a decrease in cell death (data not shown). That the sh5 cell line exhibited a lower increase in proliferation com-pared with the sh2 cells is consistent with the observation that
GABARAPL1 is decreased by 80% in sh5 compared with 96%
in sh2 cells (Fig. 1C). We then assessed the ability of the sh2 cell line to form new colonies. As shown in Figure 2B, after 14 d, we found a significantly higher number of colonies formed with the sh2 cell line compared with the shC cell line. Furthermore, using a modified Boyden chamber, we found that the sh2 cells exhibited a substantially higher capacity for migration (Fig. 2C). We have also tested the ability of the sh5 cells to form new colonies and migrate in a Boyden chamber but did not detect any significant change compared with the control cells (Data not shown). This can be explained by the
©2014
Landes
Bioscience.
Do
not
distribute.
fact that the decrease of GABARAPL1 in the sh5 cells is less than that observed in the sh2 cells.
GABARAPL1 knockdown inhibits autophagic flux
We have previously shown that GABARAPL1 associates with
autophagosomes.2 To investigate whether loss of GABARAPL1
alters autophagic flux, we quantified the levels of LC3-II, the autophagosome-associated form of the protein, in the absence and presence of the lysosomal inhibitor chloroquine, in the 3 cell lines, shC, sh2 and sh5. We found that the basal levels of LC3-II were not significantly changed by suppressing the levels of GABARAPL1 in sh2 but were increased in sh5 cells (Fig. 3A, comparing lanes 1 to 3 and 7 to 9, P < 0.05 compar-ing LC3-II/ACTIN between shC and sh5 cells). We calculated the ratio between the LC3-II levels with and without
chlo-roquine as an index of overall autophagic flux,36 and observed
a decrease of this ratio in the sh2 and sh5 cell lines compared with the control cells (Fig. 3B). These data indicate that a loss of GABARAPL1 results in a decrease in autophagic flux. To
determine whether this attenuation of autophagic flux was due to an inhi-bition of autophagy induction or the degradation of autophagosomes, we first examined MTOR activation. We found that MTOR and RPS6KB/ p70S6K phosphorylation levels were similar in the shC and sh2 cell lines (Fig. 3C and D). Moreover, both shC and sh2 cells increase autophagic flux in response to rapamycin, a MTOR-dependent inducer, as indicated by an increase of LC3-II levels (Fig. S1A–
S1C). Autophagic flux as defined
by the ratio LC3-II in response to rapamycin+CQ/LC3-II in response to rapamycin is similar in shC and sh2 cells (Fig. S1D). However the flux in the presence of rapamycin and in the absence of rapamycin is similar in shC cells, and significantly increased in sh2 cells (Fig. 3B, which is also included in Fig. S1D for direct comparison). In contrast, sh2 cells exhibited a greater increase in LC3-II in response to trehalose, a MTOR-independent autophagy inducer, com-pared with shC cells, and no further increase in LC3-II when both treha-lose and chloroquine were present (Fig. S2A–S2C). Hence, the sh2 cell line exhibited a lower increase of auto-phagic flux in response to trehalose compared with shC cells (Fig. S2D). These data suggest that GABARAPL1 knockdown does not change MTOR signaling, but changes the autophagic response to rapamycin.
Both rapamycin and trehalose inhibited sh2 cell proliferation
(Fig. S3A and S3B). As shown in Figure S1 and Figure S2,
auto-phagic flux was increased in sh2 cells in response to rapamycin, whereas it was unchanged in response to trehalose. Therefore, the inhibition of proliferation by rapamycin or trehalose cannot be simply attributed to an increase in autophagic flux. Consistent with this interpretation, we found no change in cell prolifera-tion for sh2 cells following transfecprolifera-tion of ATG7 or nontargeting
siRNA (Fig. S3C and S3D), despite a significant knockdown
of ATG7, suggesting that further inhibition of autophagy in sh2 cells does not affect proliferation.
GABARAPL1 knockdown increases SQSTM1 mRNA, SQSTM1 protein, as well as BECN1 protein levels
Since we did not detect any change in MTOR sig-naling associated with GABARAPL1 knockdown, we examined the levels of other key proteins in the autopha-gic-lysosome pathway and found an increase of BECN1/ Beclin 1 and SQSTM1 protein levels in the sh2 and sh5 cells
Figure 3. GABARAPL1 knockdown inhibits autophagic flux without changing MTOR signaling. (A)
MDA-MB436-shc, sh2, and sh5 cells were cultured for 5 h in the presence (lanes 4 to 6 and 10 to 12) or absence (lanes 1 to 3 and 7 to 9) of the lysosome inhibitor chloroquine (40 µM). Total proteins (25 µg) were separated on 12% sDs-PAGe gels followed by immunoblotting with anti-Lc3 and anti-AcTiN antibod-ies and the ecL Plus reagent. A representative experiment of 3 performed is shown. (B) The autophagy flux was determined as the levels of Lc3-ii in the presence of chloroquine divided by the levels of Lc3-ii in absence of chloroquine. *P < 0.05, vs shc (n = 3). (C) MDA-MB436-shc and sh2 cells were cultured for 24 h at 37 °c and 5% cO2 then total proteins (25 µg) were separated on 12% sDs-PAGe gels followed by
immunoblotting with phospho-MTOR, MTOR, phospho-RPs6KB, RPs6KB, and anti-AcTiN antibodies and the ecL Plus reagent. A representative experiment of 3 performed is shown. *P < 0.05, vs shc (n = 3). (D) Quantification of the signals observed on the western blot in (C) (n = 3).
©2014
Landes
Bioscience.
Do
not
distribute.
(Fig. 4A and B). Since the transcription of genes encoding these
proteins may change according to the stress status of the cells,37
we performed quantitative real-time RT-PCR, and found a sig-nificant increase in SQSTM1 (about 4-fold) but not BECN1 mRNA levels (Fig. 4C). Therefore, increased transcription of SQSTM1 in response to the loss of GABARAPL1 may have con-tributed to the changes in its protein levels. Nevertheless, the loss of GABARAPL1 also attenuated autophagic flux. To determine whether SQSTM1 protein also accumulates in sh2 cells inde-pendent of transcription, we transfected shC and sh2 cells with a pCMV-HA-SQSTM1 construct, in which SQSTM1 expression is under the control of a constitutive CMV promoter. Our data showed a 50% increase in HA-SQSTM1 levels in the sh2 cells compared with the shC cells (Fig. 4D and E). These results sug-gest that both an increase of transcription and a decrease of auto-phagic flux contribute to the higher levels of SQSTM1 in sh2 cells.
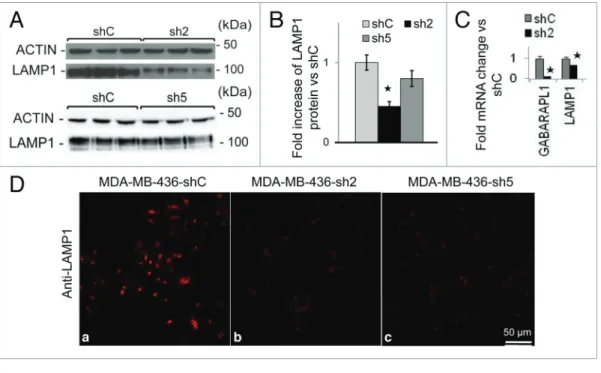
GABARAPL1 knockdown decreases LAMP1 mRNA and protein levels
Next we examined lysosome protein levels in shC, sh2, and sh5 cells. We found a significant decrease of LAMP1 (by 50%) in sh2 cells but not sh5 cells (Fig. 5A and B). The decreased
LAMP1 protein in sh2 cells may be due to decreased transcrip-tion as LAMP1 mRNA levels were also decreased by 30% in sh2 cells (Fig. 5C). Interestingly, both sh2 and sh5 cells exhibited significant decrease of LAMP1 immunostaining compared with shC cells (Fig. 5D). This discrepancy between LAMP1 western blot analyses and LAMP1 immunostaining may be due to a dif-ference in protein denaturation procedure in western blotting and in immunostaining. Intriguingly, a decrease of LAMP1 pro-tein level is not associated with a decrease of lysosomal protease activities. We found that lysosomal CTSB (cathepsin B) activity and protein levels are unchanged, whereas CTSD (cathepsin D) activity and protein levels are increased, in sh2 cells compared with shC cells (Fig. S4A–S4C). This increase of CTSD may be a compensatory response to a decrease of LAMP1, as prior stud-ies report that a decrease in lysosome number leads to the
induc-tion of cathepsin activities.38,39
GABARAPL1 knockdown increases mitochondrial mem-brane potential and the demand for mitochondrial bioenergetics
To determine the effects of GABARAPL1 on mitochon-drial membrane potential we used TMRM staining and found a significant increase in the sh2 cells compared with shC cells, and that it decreased to the same levels by FCCP as expected
Figure 4. GABARAPL1 knockdown leads to increased sQsTM1 and BecN1 proteins.(A) MDA-MB436-shc, sh2, and sh5 cells were cultured for 24 h at 37
°c and 5% cO2 then total proteins (25 µg) were separated on 12% sDs-PAGe gels followed by immunoblotting with BecN1, sQsTM1, and anti-AcTiN antibodies and the ecL Plus reagent. A representative experiment of 3 performed is shown. (B) Quantification of the signals observed on the western blot in (A). *P < 0.05, vs shc (n = 3). (C) GABARAPL1, GABARAP, LC3B, BECN1, and SQSTM1 mRNA expression was analyzed by qRT-PcR in the MDA-MB436-shc and sh2 cells. *P < 0.05, vs shc (n = 3). (D) MDA-MDA-MB436-shc and sh2 cells were cotransfected with the vectors expressing hA-sQsTM1 and peGFP-N1 (ratio 10:1). Forty-eight hours after transfection, total proteins (25 µg) were separated on 12% sDs-PAGe gels, followed by immunoblotting with anti-hA, anti-GFP, and anti-AcTiN antibodies and the ecL Plus reagent. A representative experiment of 3 performed is shown. (E) Quantification of the signals observed on the western blot in (D). *P < 0.05, vs shc (n = 3).
©2014
Landes
Bioscience.
Do
not
distribute.
(Fig. 6A). In addition, MitoTracker Red staining (Fig. 6B) was also increased in the sh2 cell line, consistent with either an increase in mitochondrial membrane potential or mitochondrial number. Similarly, MitoTracker Red intensity is higher in both sh2 and sh5 cells compared with shC cells as assessed by confo-cal microscopy (Fig. 6C and D).
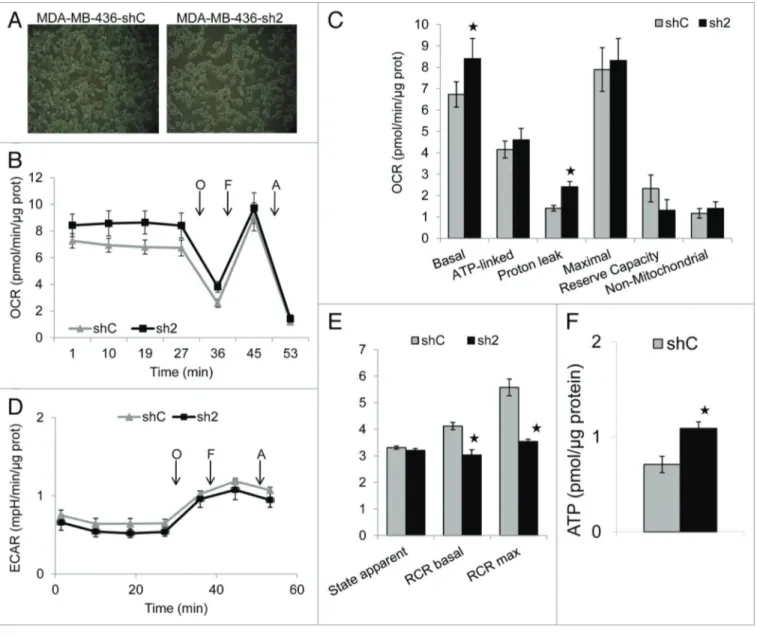
We then used the Seahorse XF24 analyzer to determine whether GABARAPL1 knockdown changed mitochondrial
function.24,40 The shC and sh2 cells were plated at similar
confluency (Fig. 7A). We then monitored the basal levels of oxygen consumption rate (OCR), and OCR following injec-tion of oligomycin, an inhibitor of ATP synthase, FCCP, an uncoupler, and antimycin A, an inhibitor of mitochondrial complex III (Fig. 7B). We were then able to calculate basal, ATP-linked, proton leak (non-ATP linked), maximal, reserve
capacity, and nonmitochondrial OCR (Fig. 7C).24,40,41 We
found an increase in basal OCR in sh2 cells, which was largely due to an increase in non-ATP linked proton leak respiration, consistent with a higher membrane potential. We also deter-mined the extracellular acidification rate (ECAR), which can be ascribed to glycolysis and other proton-generating processes in the cells, but did not detect differences between the 2 cell lines (Fig. 7D). Furthermore, we did not observe any changes of maximal OCR or reserve capacity (Fig. 7C), nor the state apparent (Fig. 7E), in response to GABARAPL1 knockdown, however, the RCR basal and maximal were decreased in sh2 cells compared with shC cells (Fig. 7E). Interestingly, we found that GABARAPL1-suppressed cells had higher amounts
of ATP compared with the control cells, which suggests that the mitochondrial population in these cells is capable of meet-ing the increased demands for proliferation through increased metabolic activity (Fig. 7F).
GABARAPL1 knockdown leads to an increase of mitochon-drial protein levels and an increase of damaged mitochonmitochon-drial DNA
An altered autophagy-lysosome pathway may result in an increased mitochondrial number in GABARAPL1 knockdown cells. Therefore, we then examined whether the levels of proteins involved in mitochondrial biogenesis or homeostasis would be altered in sh2 cells. We found that levels of both PPARGC1A,
which is involved in mitochondria biogenesis,42 and VDAC1,
which is involved in the flux of metabolites to and from the
mitochondria,43 were upregulated in sh2 cells compared with
shC cells (Fig. 8A and B). Levels of MFN1 (mitofusin 1), which
is involved in mitochondria fusion,44 DNM1L/Drp1 (dynamin
1-like), which is involved in mitochondria fission,45 PINK1 and
PARK2/PARKIN, which are involved in mitophagy,46 were
unchanged. Our data support the hypothesis that GABARAPL1 is important in maintaining mitochondrial homeostasis by pro-moting autophagic flux, independent of mitochondrial fission/ fusion or selective mitophagy.
As an additional index of mitochondrial number we measured mtDNA copy number relative to the genomic DNA. As shown in Figure 8C, we found increased levels of mtDNA in sh2 cells compared with shC cells. These data also suggest that both an attenuation of autophagic flux and an increase in mitochondrial
Figure 5. GABARAPL1 knockdown leads to decreased LAMP1 protein levels and immunocytochemistry staining.(A) MDA-MB436-shc, sh2, and sh5 cells
were cultured for 24 h at 37 °c and 5% cO2 then total proteins (25 µg) were separated on 12% sDs-PAGe gels followed by immunoblotting with anti-LAMP1 antibodies and the ecL Plus reagent. A representative experiment of 3 performed is shown. (B) Quantification of the signals observed on the western blot in (A). *P < 0.05, vs shc (n = 3). (C) GABARAPL1 and LAMP1 mRNA expression was analyzed by qRT-PcR in the MDA-MB436-shc and sh2 cells. *P < 0.05, vs shc. (D) MDA-MB436-shc, sh2 and sh5 cells were cultured for 24 h at 37 °c and 5% cO2, fixed, permeabilized, blocked with 5% BsA, incubated with a monoclonal anti-mouse LAMP1 overnight at 4 °c and then with an Alexa Fluor 555 goat anti-mouse for 1 h. The cells were then analyzed using a confocal microscope. each picture is representative of a typical cell staining observed in 10 fields chosen at random.
©2014
Landes
Bioscience.
Do
not
distribute.
biogenesis via PPARGC1A increase42 may contribute to an
increased MitoTracker staining, mtDNA copy number, mito-chondrial membrane potential, and VDAC1 protein levels. To further assess mitochondrial health, we measured mtDNA damage, and found that sh2 cells exhibited significantly higher mtDNA damage compared with shC cells (Fig. 8D). mtDNA copy number is increased in sh5 cells compared with shC but mtDNA damage in sh5 is comparable to shC, this may reflect an incomplete GABARAPL1 knockdown in sh5 cells (data not shown).
The accumulation of mitochondria and the changes of mito-chondrial quality suggest a defect in mitomito-chondrial clearance in sh2 cells. To quantify mitochondrial clearance, we have per-formed costaining of mitochondria and lysosomes in the pres-ence or abspres-ence of FCCP (Fig. S5). We found a slight increase of MitoTracker Red and LysoTracker Green colocalization in sh2 cells compared with shC cells; this may be due to an increase of mitochondrial number, and is not consistent with an attenuated selective mitophagy. We did not find a significant difference of
FCCP-induced colocalization of mitochondria and lysosomes in shC or sh2 cells. Similarly, we did not find colocalization of GFP-PARK2 with mitochondria in shC or sh2 cells (data not shown) but it is conceivable that the potential defects in mito-chondrial clearance in sh2 cells are independent of PARK2 translocation to the mitochondria. The exact mechanism of how accumulation of underperforming mitochondria occurs in sh2 cells remains unclear.
GABARAPL1 knockdown promoted cell survival in response to HNE
We incubated shC and sh2 cells with increasing concen-trations of HNE, a product of lipid peroxidation previously
described to decrease mitochondrial activity,40,41,47 through its
modification of proteins including ATP5B (ATP synthase, H+
transporting, mitochondrial F1 complex, β polypeptide)48 or
SIRT3.49 As shown in Figure 9A, after 16 h, the viability of sh2
cells was higher than shC cells after incubation with different concentrations of HNE, indicating that GABARAPL1 knock-down enhances cell survival in response to HNE.
Figure 6. GABARAPL1 knockdown increases TMRM and MitoTracker Red staining. (A) TMRM staining (AU, arbitrary units) normalized to total protein.
MDA-MB436-shc and sh2 cells (40,000) were cultured in 96-well plates for 24 h at 37 °c and 5% cO2. cells were then incubated with 100 nM TMRM for 45 min before being washed with PBs. TMRM fluorescence was measured at 590 nm using a Victor3V Perkinelmer Wallace 1420 Multilabel counter. FccP
as a control decreased mitochondrial membrane potential to ~750 in both shc and sh2 cells. *P < 0.05, vs shc (n = 3). (B) MitoTracker Red fluorescence values (AU) for the 2 cell lines shc and sh2. cells (600,000) were cultured in 6-well plates for 24 h at 37 °c and 5% cO2, stained with 50 nM MitoTracker Red for 45 min at 37 °c, trypsinized, washed with PBs and resuspended in 500 µl PBs. intracellular fluorescence was then assessed using the LsR-ii Becton Dickinson flow cytometer. *P < 0.05, vs shc (n = 3). (C) MDA-MB436-shc and sh5 cells (100,000) were cultured in Labtek 4-well plates for 24 h at 37 °c and 5% cO2, stained with 50 nM MitoTracker Red for 45 min at 37 °c and washed with PBs. Mitochondria were imaged using the Zeiss LsM 710 confocal microscope and the Zen 2008 software. MitoTracker intensity was quantified by image J for 25 cells for each cell line in 5 different fields of view chosen at random. *P < 0.05, vs shc. (D) MDA-MB436-shc and sh2 cells (100,000) were cultured in Labtek 4-well plates for 24 h at 37 °c and 5% cO2, stained with 50 nM MitoTracker Red for 45 min at 37 °c and washed with PBs. similarly, MDA-MB436-shc and sh5 cells (100,000) were cultured, stained with MitoTracker Red, and imaged. The pictures were taken with the Zeiss LsM 710 confocal microscope.
©2014
Landes
Bioscience.
Do
not
distribute.
To determine effects of HNE on autophagic flux in sh2 cells, we assessed the LC3-II levels (Fig. 9B and C). We found that LC3-II levels were significantly increased in the shC cells (~1.4-fold) but unchanged in sh2 cells following HNE exposure. Consequently, the ratio of LC3-II with HNE vs. LC3-II without
HNE was also lower in the sh2 cells. Basal HNE-protein adducts were higher in sh2 cells compared with shC cells (Fig. 9D and
E) (compare lanes 1 to 3 and 4 to 6). After exposure to
exog-enous HNE, HNE-protein adduct levels increased to 1.5-fold in the shC cells but did not change in the sh2 cells (Fig. 9D
Figure 7. GABARAPL1 knockdown increases basal and proton-leak oxygen consumption rate (OcR), increases intracellular ATP levels, and decreases
basal and maximal respiratory control ratio (RcR). MDA-MB436-shc and sh2 cells (60,000) were cultured for 24 h in 24-well XF24 seahorse Biosciences V7 microplates and then bioenergetic function was assessed using the seahorse XF24 analyzer. Both OcR and ecAR were measured. The ATP syn-thase inhibitor oligomycin (O; 1 µM), uncoupler FccP (F; 0.75 µM), and complex iii inhibitor antimycin A (A; 10 µM) were injected at the indicated times to determine different parameters of mitochondrial function. (A) Pictures showing similar confluency of the shc and sh2 cells before the start of the seahorse analysis. (B) OcR values shown as pmol O2/min/µg protein. (C) histogram showing the comparison of basal, ATP-linked, proton leak-linked, maximal, and non-mitochondrial OcR of shc and sh2 cells. Nonmitochondrial OcR was determined as the OcR after antimycin A treatment. Basal OcR was determined as OcR before oligomycin minus OcR after antimycin A. ATP-linked OcR was determined as OcR before oligomycin minus OcR after oligomycin. Proton leak was determined as basal OcR minus ATP-linked OcR. Maximal OcR was determined as the OcR after FccP minus nonmitochondrial OcR. Reserve capacity was defined as the difference between maximal OcR after FccP minus basal OcR. *P < 0.05, vs shc (n = 4). (D) extracellular acidification rate (ecAR) values were plotted as mph/min/µg protein for shc and sh2 cells (n = 4). (E) histogram showing the com-parison of state apparent, RcR basal and RcR maximal of shc and sh2 cells. state apparent was determined as the value corresponding to the following formula: 4-[(Basal-Oligo)/(Basal-FccP)]. RcR basal was determined as the value corresponding to the following formula: (Basal-AntiA)/(Oligo-AntiA). RcR maximal was determined as the value corresponding to the following formula: (FccP-AntiA)/(Oligo-AntiA). *P < 0.05, vs shc (n = 4). (F) histogram showing intracellular ATP values (pmoles/µg protein) for shc and sh2 cells. MDA-MB436-shc and sh2 cells (40,000) were cultured in 96-well plates for 24 h at 37 °c and 5% cO2. The intracellular ATP concentration was then determined using the ATPlite kit from Perkinelmer according to the manufac-turer’s instructions. Luminescence was measured using a Victor2V Perkinelmer Wallace 1420 Multilabel counter. *P < 0.05, vs shc (n = 3).
©2014
Landes
Bioscience.
Do
not
distribute.
and E). Next we determined the levels of GSH in
the 2 cell lines, since the formation of HNE-protein adducts could be attenuated by intracellular cellular glutathione (GSH) which can detoxify HNE through
the action of glutathione transferases.50 As shown in
Figure 9F, GSH levels were significantly higher in
the sh2 cell lines, suggesting that the decreased HNE-induced cell death in sh2 cells may be partially pro-vided by the higher levels of GSH.
Discussion
Recent studies have shown that GABARAPL1
is associated with autophagic vesicles2 and the
GABARAPL1 gene may be a tumor-suppressor
gene and a prognostic biomarker in breast cancer.13
GABARAP, the closest homolog of GABARAPL1, is expressed at low levels in invasive ductal and invasive lobular carcinomas compared with normal breast tis-sue, and the overexpression of GABARAP in CAL51 decreases their proliferation rate as well as their abil-ity to form colonies in soft-agar and to form tumors
in nude mice.51 GABARAPL1 overexpression has been
shown to inhibit proliferation of the breast cancer cell
line (MCF-7),13 and their ability to form tumors in
nude mice.34 Building on these data, we hypothesized
that endogenous GABARAPL1 plays a role in sup-pressing the cancer cell phenotype and in mediating autophagy. In this study, we established stable cell lines that exhibited significant loss of GABARAPL1 mRNA and protein levels (Fig. 1), and found that these cells exhibited an increased proliferation rate, colony forma-tion and invasion (Fig. 2) consistent with the hypoth-esis that GABARAPL1 is a tumor suppressor gene.
Autophagy plays a complex role in tumor initiation and progression. On the one hand, autophagy protects against the production of reactive oxygen species in the cells and their deleterious effects in mutating DNA
and promoting cell transformation.35 On the other
hand, autophagy is required for the transformation of
mouse embryonic fibroblasts by the Ras oncogene and this effect is linked to its role in nutrient recycling such as glucose uptake
and increased glycolytic flux.52 During the later stages of in vivo
tumor formation, autophagy has been shown to be necessary for the cancer cell survival in hypoxia before the vascularization of
the tumor.35 Autophagy has also been shown to protect against
cellular stress induced by the chemotherapeutic drugs used in cancer treatment leading to several clinical trials involving the use of an inhibitor of the autophagy flux as a combination
ther-apy.53 Even though the mechanism is still unclear, many
stud-ies suggest a role of autophagy in the regulation of cancer cell metabolism allowing them to meet the requirements for rapid proliferation. Using multiple autophagic flux analyses, including comparing LC3-II levels with and without chloroquine, endog-enous SQSTM1 mRNA and protein levels, as well as exogendog-enous
constitutively expressed pCMV-HA-SQSTM1 (Fig. 3A and
B; Fig. 4D and E), we have found that GABARAPL1
knock-down cells exhibit a decreased autophagic flux. Interestingly, sh5 cells with incomplete GABARAPL1 knockdown also exhibited decreased autophagic flux, although to a less extent than sh2 cells and did not result in the same colony formation and migra-tion phenotypes as the sh2 cells.
The underlying mechanism of attenuated autophagic flux as a result of GABARAPL1 knockdown appears to be a significant decrease of LAMP1 protein levels and lyso-some number (Fig. 5A–D), supporting the hypothesis that loss of GABARAPL1 leads to an attenuation of autophago-somal degradation. Importantly, we did not find a differ-ence in the phosphorylation of MTOR and RPS6KB between control and GABARAPL1 knockdown cells, suggesting an
Figure 8. GABARAPL1 knockdown increases mitochondria number, and mtDNA
damage. (A) MDA-MB436-shc and sh2 cells were cultured for 24 h at 37 °c and 5% cO2. cells were then lysed in the presence of protease and phosphatase inhibitors and total proteins (25 µg) were separated on 12% sDs-PAGe gels followed by immu-noblotting with anti-PPARGc1A, anti-DNM1L, anti-MFN1, anti-VDAc1, anti-PARK2, anti-PiNK1, and anti-AcTiN antibodies and the ecL Plus reagent. A representative experiment of 3 performed is shown. (B) Quantification of the signals on the west-ern blot in (A). *P < 0.05, vs shc (n = 3). (C) MDA-MB436-shc and sh2 cells (600,000) were cultured in 6-well plates for 24 h at 37 °c and 5% cO2. cells were washed with PBs and kept frozen at −80 °c until purification of total DNA. specific genomic and mitochondrial DNA sequences were amplified by quantitative real-time PcR. The data are presented as the ratio of mitochondrial vs. genomic DNA and normalized to the control cell line, shc. *P < 0.05, vs shc (n = 3). (D)MDA-MB436-shc and sh2 cells (600,000) were cultured in 6-well plates for 24 h at 37 °c and 5% cO2. cells were washed with PBs and kept frozen at −80 °c until purification of total DNA. specific long and short mitochondrial DNA sequences were amplified by PcR. The data were calculated from the levels of long mitochondrial PcR product vs. levels of short mito-chondrial PcR product as described in Materials and Methods, and normalized to shc. *P < 0.05, vs shc (n = 3).
©2014
Landes
Bioscience.
Do
not
distribute.
Figure 9. GABARAPL1 knockdown enhances cell survival in response to hNe, inhibits autophagic flux in response to hNe, and increases intracellular
hNe-protein adducts and glutathione (Gsh) concentration. (A) MDA-MB436-shc and sh2 cells were grown for 16 h in the presence of hNe (0, 5, 15 or 30 µM). cells were then trypsinized and counted in the presence of trypan blue. The values were normalized to the number of cells determined in the control samples for each cell line. *P < 0.05, vs shc (n = 3). (B) MDA-MB436-shc and sh2 cells were cultured for 16 h in the presence of hNe (30 µM). cells were then lysed and total proteins (25 µg) were separated on 12% sDs-PAGe gels followed by immunoblotting with anti-Lc3 and anti-AcTiN antibodies and the ecL Plus reagent. A representative experiment of 3 performed is shown. (C) Quantification of the Lc3-ii signals observed in the western blots shown in (B). hNe-induced changes of Lc3-ii levels were determined as the levels of Lc3-ii in response to hNe divided by the levels of Lc3-ii without hNe. *P < 0.05, vs shc (n = 3), #P < 0.05, vs untreated cells (n = 3). (D) MDA-MB436-shc and sh2 cells were cultured for 16 h in the presence of hNe (30 µM).
cells were then lysed in hNe lysis buffer containing 10 mM N-ethylmaleimide and total proteins (25 µg) were separated on 12% sDs-PAGe gels followed by immunoblotting with anti-4-hNe and anti-AcTiN antibodies and the ecL Plus reagent. (E) Quantification of the signals observed in the western blot in (D). *P < 0.05, vs shc (n = 3), #P < 0.05, vs untreated cells (n = 3). (F) Total cellular Gsh was determined using the Gsh recycling assay, as described in
Materials and Methods, using a Beckman coulter DU-800 spectrophotometer, after shc and sh2 cells (600,000) were cultured in 6-well plates for 24 h at 37 °c. *P < 0.05, vs shc (n = 3).
MTOR-independent attenuation of autophagic flux (Fig. 3C
and D). Furthermore, we found increased BECN1 levels that
cannot explain an attenuation of autophagic flux (Fig. 4A–C). Previous studies have shown that autophagy and lysosomal genes are coordinately regulated by master transcription
activa-tors and repressors,54-56 such coordinate regulation appears to be
perturbed in GABARAPL1 knockdown cells. In this context, it has been previously shown that rapamycin and trehalose are able to induce TFEB (transcription factor EB), a transcription factor specifically inducing the transcription of genes involved in the
autophagosomal and lysosomal biogenesis including LAMP1.54,55
We found that rapamycin and trehalose inhibited cell
proliferation and abolished the effects of GABARAPL1 suppres-sion on cell proliferation. The effects of rapamycin and trehalose on cell proliferation may be linked to an increase in LAMP1. Furthermore, although the exact mechanisms are unclear, our observation that LAMP1 is decreased and CTSD is increased in sh2 cells is consistent with prior findings and supports a
differ-ential role of lysosomal components in cell proliferation.57-59
GABARAP1 has been previously linked to the selective autophagy of mitochondria, shown to interact with BNIP3L, a mitochondrial protein, and to be recruited to mitochondria to induce their clearance during the maturation of
©2014
Landes
Bioscience.
Do
not
distribute.
and therefore suppresses reactive oxygen species formation and DNA damage, and that our results showed that autophagic flux is attenuated in the absence of GABARAPL1, we determined whether GABARAPL1 knockdown would lead to desensitiza-tion to mitochondrial stressor-induced autophagy. Indeed, we found that in response to HNE, which is a byproduct of lipid peroxidation previously shown to modify mitochondrial
pro-teins and inhibit their activity,24,41,48 GABARAPL1
knock-down cells exhibit less of an increase in LC3-II levels compared with control shC cells (Fig. 9B and C). However, cell survival in response to HNE is dependent on GABARAPL1 (Fig. 9A). Further, GABARAPL1 knockdown induced a higher level of total endogenous HNE-protein adducts in the cells, and there were no further increases after additional HNE exposure in these cells (Fig. 9D). Additionally, glutathione steady-state levels are increased in the GABARAPL1 knockdown cells compared with control cells (Fig. 9G), and the higher level of glutathi-one may form conjugates with the exogenously added HNE to
inhibit its toxic effect in the cells.60 The increase of endogenous
HNE-protein adducts may be due to the attenuation of auto-phagic flux, and the increased adducts may also signal to induce an antioxidant response for the cells to produce more enzymes
involved in glutathione synthesis.61
We also determined the impact of GABARAPL1 knockdown on mitochondrial function. We found that GABARAPL1 knock-down cells exhibited increased mitochondrial membrane poten-tial, mitochondrial biogenesis factor PPARGC1A, mitochondrial protein VDAC1, both total and damaged mtDNA (Figs. 6–8). In addition to exhibiting decreased autophagic flux as discussed above (Fig. 4), sh5 cells with incomplete GABARAPL1 knock-down also exhibited increased total mtDNA but not damaged mtDNA (Fig. 8), suggesting that autophagic flux and accumu-lation of mitochondrial mass are sensitive to moderate change of GABARAPL1 levels, whereas increased colony formation, cell migration/invasion, and mtDNA damage occur only when GABARAPL1 level decreases more than 70% (Fig. 1).
These competing impacts on mitochondrial homeostasis due to GABARAPL1 knockdown resulted in a cellular bioenergetic profile that did not substantially deviate from that of the con-trol shC cells, other than a significant increase in proton leak (Fig. 7). Importantly, ATP levels were increased in response to GABARAPL1 inhibition showing that although a decrease in mitochondrial quality occurred, the overall mitochondrial popu-lation was still competent to meet the energetic demands of the cell. This could be due to the activation of mitochondrial bio-genesis in attempt to restore the integrity of the mitochondrial population and a small but active population of functioning mitochondria.
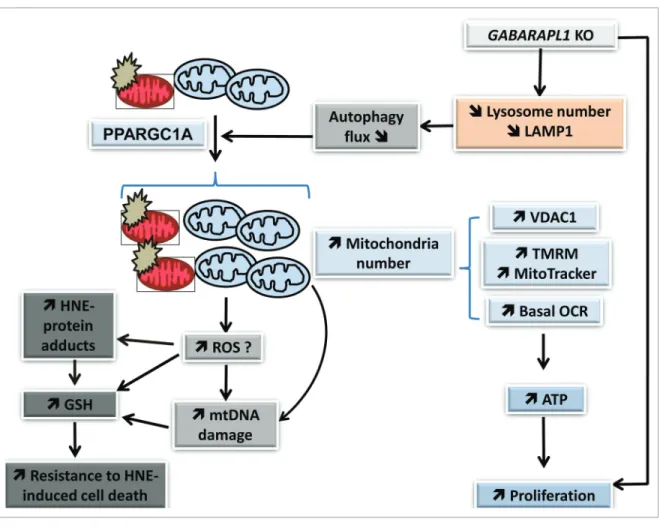
Our study supports the model that GABARAPL1 inhibition induces a depletion of LAMP1 and lysosomal number, attenu-ates autophagic flux, and leads to an accumulation of damaged mitochondria, associated with stimulated mitochondrial biogen-esis leading to increased mitochondrial number, mitochondrial protein, mitochondrial membrane potential, mitochondrial res-piration, and ATP levels (Fig. 10). The increase of mitochondrial number and cellular glutathione, which itself could be stimulated
by an increase in the basal levels of mitochondrial reactive oxy-gen species, further resulted in resistance to cell death, and may contribute to increased proliferation and aggressiveness of these cells. Our data demonstrate that GABARAPL1 plays an impor-tant role in regulating the autophagy-lysosome pathway, mito-chondrial activity, cell metabolism, and proliferation.
Materials and Methods Reagents and antibodies
Cell culture reagents were purchased from Invitrogen. The following antibodies were used: polyclonal anti-GABARAPL1 (Proteintech, 11010-1-AP, 1:1,000), polyclonal anti-LC3B (Sigma-Aldrich, L8918, 1:3,000), monoclonal anti-SQSTM1/ p62 (Abnova, H00008878-M01, 1:3,000), monoclonal anti-LAMP1 (Developmental hybrid studies, H4a3, 1:1000), mono-clonal anti-VDAC1 (Abcam, ab16816, 1:1000), monomono-clonal anti-DNM1L/Drp1 (Abcam, ab56788, 1:1000), polyclonal anti-MFN1 (Santa Cruz, H65 sc-50330, 1:1000), polyclonal anti-PPARGC1A (Santa Cruz, H300 sc-13067, 1:1000), mono-clonal anti-PINK1 (Abcam, ab23707, 1:1000), polymono-clonal PARK2 (Santa Cruz, H300 sc-30130, 1:1000), goat anti-4-HNE (Alpha diagnostics, HNE12-S, 1:3000), polyclonal rabbit anti-MTOR (Cell Signaling, 2983, 1:1000), polyclonal rabbit anti-phospho-MTOR (Cell Signaling, 2971, 1:1000), polyclonal rabbit anti-RPS6KB (Cell Signaling, 9202, 1:1000), polyclonal rabbit anti-phospho-RPS6KB (Cell signaling, 9205, 1:1000), polyclonal rabbit anti-CTSB (Santa Cruz, sc-13985, 1:1000), polyclonal goat anti-CTSD (Santa Cruz, sc-6486, 1:1000), and polyclonal anti-ACTIN (Sigma-Aldrich, A5060,
1:10,000). Bafilomycin A1 (Sigma, B1793) was prepared as a
50 µM stock in DMSO. Rapamycin (Sigma-Aldrich, R8781) was purchased as a 2.74 mM stock in DMSO. Chloroquine (Sigma-Aldrich, C6628) was prepared as a 200 mM stock in water. Tetramethylrhodamine methyl ester perchlorate (TMRM, Sigma-Aldrich, T5428) was prepared as a 100 mM stock in DMSO. 3-Methyladenine (3-MA, Sigma-Aldrich, M9281) was prepared fresh as a 10 mM working solution in complete culture medium. Oligomycin (O4876), FCCP (C2920) and antimycin A (A8674) were purchased from Sigma-Aldrich. 4-hydroxynon-enal (HNE) was prepared fresh from a stock solution purchased from Calbiochem (393204). The HA-SQSTM1-expressing vec-tor was purchased from Addgene (28027, Dr Qing Zhong).
Cell culture and stable cell lines
The MDA-MB-436 cell line (ATCC) was maintained in DMEM medium (Dulbecco’s modified Eagle’s medium; Invitrogen, 11965-092) containing 1 mM L-glutamine and supplemented with 10% fetal bovine serum (Atlanta Biologicals, S111-50), 100 µg/ml penicillin/streptomycin (Invitrogen, 15140-122) and 1 mM sodium pyruvate (Invitrogen,
11360-070) in a 5% CO2 incubator at 37 °C. Cells were split every 4 d
(1:3 dilution). The MDA-MB-436-shRNA-control (shC or con-trol) and -GABARAPL1 (sh2 or GABARAPL1 KD) cell lines were maintained in complete medium supplemented with 1 µg/ ml puromycin (Invitrogen, 28-111-QL). To create these stable
©2014
Landes
Bioscience.
Do
not
distribute.
cell lines, MDA-MB-436 cells (106) plated in 10-cm diameter
cultures dishes were transfected the day after plating using 10 µg of 5 different pKo.1-puro-shRNA-GABARAPL1 vec-tors (Mission shRNA, Sigma-Aldrich, SHCLNG-NM_031412, shRNA 443s1c1) and 1 pKo.1-puro-shRNA-control vec-tor (Sigma-Aldrich, SHC002) and 20 µl TransFast reagent (Promega, E2431) according to the manufacturer’s proto-col. After 48 h incubation, 3 µg/ml puromycin was added to each plate and the medium was changed every 2 d for the next 14 d until the appearance of antibiotic-resistant single clones. Five resistant clones for each shRNA transfection were then tested for the expression of GABARAPL1, GABARAP, and
LC3B mRNAs and proteins by qRT-PCR and western-blotting,
respectively. The stable cell lines used later on in this study are the MDA-MB-436-shRNA-control clone 2 (shC or con-trol) and the MDA-MB-436-shRNA-GABARAPL1 clone 2 (sh2 or GABARAPL1 KD). The sh5 clone has been designed using the same protocol as described for the sh2 clone but using a different shRNA (Mission shRNA, Sigma-Aldrich, SHCLNG-NM_031412, shRNA 570s1c1).
Quantitative real-time RT-PCR analysis
Total RNAs were extracted using the TRI Reagent (Invitrogen, AM9738). To remove any genomic DNA contamination, total RNAs were treated with RNase-free DNase I (Invitrogen, AM2222) and purified with phenol/chloroform. A volume of 1 µg of total RNAs was reverse transcribed using M-MLV RT (Sigma-Aldrich, M1302) and oligo(dT)15 primers following the manufacturer’s instructions. Quantitative PCR was run on the Step One Real Time PCR System (Applied Biosystems) using the SYBER Green PCR Master Mix (Applied Biosystems, 4309155) and the following parameters: 10 min at 95 °C followed by 40 cycles: 15 s at 95 °C and 1 min at 60 °C. The target genes lev-els (GABARAPL1, GABARAP, LC3B, LAMP1, SQSTM1, and
BECN1) were normalized to the levels of the H3B2
housekeep-ing gene (forward: 5′-GCTAGCTGGA TGTCTTTTTG G-3′ and reverse: 5′-GTGGTAAAGC ACCCAGGAAA-3′). The primer sequences were: GABARAPL1 (5′ CCCTCCCTTG GTTATGATCC A-3′ and 5′-AGGAAGGGAT TGCTGGGTTC T-3′), GABARAP (5′-ACTCCCACCC CACAAAATCC-3′ and 5′-GCCTTTCCCA
Figure 10. GABARAPL1 function in breast cancer cells. Our studies indicate that GABARAPL1 plays an important role in autophagic flux, mitochondrial
homeostasis, metabolic programming, and control of cell proliferation in breast cancer MDA-MB-436 cells. GABARAPL1 knockdown induces a disruption of the autophagosome-lysosome pathway leading to a decrease of lysosome number and accumulation of damaged mitochondria, increased mito-chondrial biogenesis and number, and increased mitomito-chondrial respiration, mitomito-chondrial membrane potential, mitomito-chondrial proteins, and mtDNA damage. This is further evidenced by an increase of hNe-protein adducts, increased antioxidant response, and increased ATP levels. The increase of mitochondrial number, cellular glutathione, and cellular ATP may contribute to resistance to cell death and increased proliferation.
©2014
Landes
Bioscience.
Do
not
distribute.
TCCTGCTGTA-3′), LC3B (5′-CGGAAAGCAGCAGTGTACCA-3′ and 5′-GGCAGAAGGG AGTGTGTCTG A-3′), LAMP1 (5′-GTGTCTGCTG GACGAGAACA-3′ and 5′-ATGAGGACGA TGAGGACCAG-3′), SQSTM1 (5′-AAATGGGTCC ACCAGGAAAC TGGA-3′ and 5′-TCA ACT TCAA TGCCCAGAGG GCTA-3′) and
BECN1 (5′-TCACCATCCA GGAACTCACA-3′ and
5′-CCTGGCGAG GAGTTTCAAT A-3′). Each sample was analyzed in triplicate and then differences in the expression of each gene were quantified using the ΔΔCt approach using the endogenous control.
Western blot analysis
Cells were lysed in RIPA lysis buffer (50 mM TRIS-HCl pH 7.8, 150 mM NaCl, 2 mM EDTA, 1% Triton X-100, 0.1% SDS supplemented with protease inhibitors [Sigma, P8340]) then 25 or 50 µg of lysates were resolved on a 12% or 15% poly-acrylamide gel in running buffer (25 mM Tris base, 192 mM glycine, 0.1% SDS) at 60 V for 60 min and 120 V for another 60 min. Proteins were transferred onto Immuno-Blot PVDF 0.2 µm membranes (Bio-Rad, 162-0177) for 90 min at 90 V at 4 °C in transfer buffer (25 mM Tris base, 192 mM glycine, 0.037% SDS, 20% methanol). Membranes were subsequently incubated in blocking buffer for 1 h (TBS-T [20 mM TRIS-HCl, pH 7.6, 137 mM NaCl, 0.1%Tween 20] containing 5% skim milk powder) and incubated with primary antibodies in blocking buffer overnight at 4 °C. The secondary horseradish peroxidase-coupled rabbit (Sigma-Aldrich, A0545) and anti-mouse IgG antibodies (Sigma-Aldrich, A4416) were prepared in TBS-T. After 1 h incubation, the membrane was washed 3 times in TBS-T and incubated with the Pierce ECL western-blotting substrate (Pierce, 32106) according to the manufactur-er’s recommendations. All western blots were analyzed using the ChemiDoc XRS+ from Bio-Rad. All western blot signals were quantified before saturation using the Image Lab 2.0 software provided with the ChemiDoc XRS+ according to the manufac-turer’s instructions.
For the HNE western-blotting, cells were lysed in HNE lysis buffer (50 mM HEPES, 150 mM NaCl, 1.5 mM MgCl, 1 mM EDTA, 1% glycerol, 1% NP40 [Fisher Scientific, NC9375914]) supplemented with protease inhibitors (Sigma-Aldrich, P8340) and 50 mM N-ethylmaleimide (Sigma-Aldrich, E3876). The samples were run the same day to avoid any freeze-thaw step. The goat anti-HNE antibody was purchased from Alpha Diagnostics (HNE-12S) and used at a 1:3000 dilution overnight in TBS-T supplemented with 5% horse serum (Life Tech Corp, 16050-130).
Cell proliferation assays
For the MTT assay, 436-shC and MDA-MB-436-sh2 cell lines were plated in 96-well plates (3,000 cells per well, 24 wells per cell line) and MTT assays were conducted every day over a 10-d period using 3-(4,5-dimethylthiazol-2-yl)-2,5-diphenyl tetrazolium bromide (MTT) (Sigma-Aldrich,
M5655) as previously described.13
For the trypan blue exclusion assay, MDA-MB-436-shC and MDA-MB-436-sh2 cells were plated in 12-well plates (100,000 cells per well, 3 wells per cell line) and cells were counted every
day over a 4 d period. After discarding the culture medium, cells were incubated in 100 µl Trypsin-EDTA (Invitrogen, 25200-056) for 5 min at 37 °C. After further addition of 200 µl of complete medium, cells were supplemented with 30 µl of try-pan blue (0.04% final concentration, Cellgro, 25-900-CI) and the viable cells density was then determined using a Malassez hemocytometer.
Colony formation assay
MDA-MB-436-shC and MDA-MB-436-sh2 cells were plated in 6-well plates (3,000 cells per well) and incubated in complete culture medium supplemented with 10% fetal bovine serum, 100 µg/mL penicillin/streptomycin and 1 mM L-glutamine at
37 °C and 5% CO2. After 12 d, the colonies formed were fixed
10 min with 100% ethanol and stained for 10 min with crystal violet (0.5% in 2% ethanol). Each well was then washed 3 times with distilled water and colonies were counted using the Vision-Capt software (VilberLourmat).
Cell invasion assay
Cell invasion was evaluated using modified Boyden cham-bers (6.5-mm diameter and 8-µm pore size, SPL Life Sciences, 35224). Boyden chambers were coated with 50 µg ECM gel from Engelbreth-Holm-Swarm murine sarcoma (Sigma-Aldrich, E1270) diluted in DMEM and incubated for 5 h at 37 °C. 100,000 cells in 250 µl of serum-free DMEM were seeded into the upper chamber and 500 µl of complete culture medium were added in the lower compartment. After 24 h incubation in a 5%
CO2 incubator at 37 °C, cells on the upper surface were removed
using a swab and cells on the lower surface were fixed 5 min with absolute ethanol and stained with crystal violet (0.5% in 2% ethanol) for 10 min. The filters were then washed with dis-tilled water and cells were counted using a light microscope at a high magnification (×400).
CTSB and D activity assays
CTSB and CTSD activities were quantified using the CTSB Activity Assay Kit (Abnova, KA0766) and the CTSD activity assay kit (Sigma, CS0800) following manufacturer’s instructions. Briefly, cells were collected by scraping and cen-trifugation (1500 g for 5 min at 4 °C), washed once with PBS
(0.17 M NaCl, 3.3 mM KCl, 10 mM Na2HPO4, 1.8 mM
KH2PO4) before a second spin and then lysed using CTSB cell
lysis buffer (kit) or MES lysis buffer for CTSD (20 mM MES,
pH 6.8, 20 mM NaCl, 1 mM MgCl2, 2 mM EDTA, 10 mM
NaH2PO4) supplemented with phosphatase (Sigma, P0044) and
protease (Sigma, P8340) inhibitors. Lysates were then incubated for 30 min on ice, centrifuged at 15000 g for 5 min and superna-tants were subjected to DC-Bradford assay (Bio-Rad, 500-0114). For the CTSB activity assay, 50 µg of cell lysate were com-bined with the CTSB reaction buffer (kit) in a 96-well black plate with clear top and bottom. E64 (Sigma, E8640) was used for inhibition of CTSB activity. After addition of a fluorogenic CTSB substrate (kit), the plate was incubated for 2 h at 37 °C before values were read in fluorescence units, which were then normalized to controls.
For the CTSD activity assay, 30 µg of lysate per sample were used for activity readings with and without pepstatin A (PepA, 2 mg/ml, Sigma, P5318) in a black 96-well plate with clear top
©2014
Landes
Bioscience.
Do
not
distribute.
and bottom. PepA values were subtracted from non-PepA values to determine CTSD activity in fluorescence units, which were then normalized to control samples.
Mitochondrial bioenergetic measurements using the Seahorse XF-24 analyzer
To measure mitochondrial function in MDA-MB-436-shC and MDA-MB-436-sh2 cells, an XF24 extracellular flux analyzer (Seahorse Bioscience, North Billerica, MA, USA) was used. To allow comparison between experiments, data are expressed as the OCR in pmol/min or the extracellular acidi-fication rate in mpH/min, normalized to cell protein contents determined by the DC-Bradford (Bio-Rad, 500-0114) method. The optimal seeding density of the cells needed to obtain mea-surable OCR and ECAR was established, and both ECAR and OCR show a proportional response with cell number (data not shown). For our experiments, a seeding density of 60,000 cells per well was selected to allow both increase and inhibition of OCR and ECAR. In our experiments, oligomycin, FCCP, and antimycin A concentrations were 1, 0.75, and 10 µM, respectively.
ATP assay
MDA-MB-436-shC and MDA-MB-436-sh2 cells were plated in 96-well plates (40,000 per well) and incubated for 24 h at 37 °C. The intracellular ATP concentration was then assessed using the ATPlite kit from PerkinElmer (6016943) according to the manufacturer’s recommendations. Briefly, culture medium was discarded and cells were incubated first for 5 min in the kit lysis buffer, then for further 5 min with the substrate solu-tion, before being adapted to the dark for 10 min. Emitted
lumi-nescence was then measured using a Victor2V 1420 Multilabel
Counter (PerkinElmer Wallac, Waltham, MA, USA). The intra-cellular ATP amounts (in pmol) were calculated according to an ATP standard curve and normalized to the quantity of protein in each sample using a DC-Bradford assay (Bio-Rad, 500-0114).
GSH recycling assay
The quantification of GSH in our 2 cell lines was performed
according to the protocol previously described.62 Briefly,
MDA-MB-436-shC and MDA-MB-436-sh2 cells were plated in 6-well plates (600,000 per well) and incubated for 24 h at 37 °C. Culture medium was discarded and cells were washed twice in GSH wash buffer (10 µM DTPA, diethylenetriaminepentaacetic acid, in 1 X PBS, Sigma-Aldrich, D6518) before lysis in GSH wash buffer supplemented with 0.1% Triton X-100 for 10 min on ice. Collected cells were centrifuged at 12,000 g for 15 min and supernatants were collected for GSH quantification. The reaction sample was composed of 10 µl sample, 60 µl DTNB [5,5′-dithiobis(2-nitrobenzoic acid), 10 mM, Sigma-Aldrich, D8130], 900 µl GSH wash buffer, 20 µl NAD(P)H (10 mM, Sigma-Aldrich, N1630) and 10 µl glutathione reductase (Sigma-Aldrich, G9297). The fluorescence was then measured at 412 nm and 37 °C over a 4 min period using a DU-800 spectropho-tometer (Beckman Coulter, Indianapolis, IN, USA) and the rates of the reactions were expressed in dAbs/min. The GSH amounts (in pmol) were determined according to a GSH standard curve and normalized to the quantity of protein in each sample using a DC-Bradford assay (Bio-Rad, 500-0114).
TMRM staining
MDA-MB-436-shC and MDA-MB-436-sh2 cells were plated in 96-well plates (40,000 per well) and incubated for 24 h at 37 °C. Cells were then incubated with TMRM (TetraMethylRhodamine Methyl ester perchlorate, 100 nM) in phenol-free complete medium for 45 min at 37 °C before being washed twice with PBS. TMRM fluorescence was then
mea-sured at 590 nm using a Victor3V PerkinElmer Wallac 1420
Multilabel Counter. The TMRM cell incorporation determined as arbitrary units of fluorescence was then normalized to the quantity of protein in each sample using a DC-Bradford assay (Bio-Rad, 500-0114).
mtDNA quantification
DNA was extracted from MB-436-shC and MDA-MB-436-sh2 cells. Quantitative real-time PCR was performed by using a SYBR Green master mix (Life Tech Corp, 4368708) in an ABI 7500 ((3175 Staley Road, Grand Island, NY 14072, USA). The primer sequences used for mtDNA were F (5′-CACCCAAGAA CAGGGTTTGT-3′) and mtDNA-R (5′-TGGCCATGGG TATGTTGTTA A-3′). The primer sequences for the nuclear DNA were 18S-F (5′-TAGAGGGACA AGTGGCGTTC-3′) and 18S-R (5′-CGCTGAGCCA GTCAGTGT-3′) and targeted the human nuclear 18S DNA. Cycling conditions were as follows: 94 °C for 15 s, followed by 40 cycles at 94 °C for 15 s, 60 °C for 1 min and 60 °C for 1 min. The mtDNA copy number was normalized to the amplification of the 18S nuclear amplicon.
mtDNA damage assay
Mitochondrial DNA damage was evaluated by PCR method
as described previously.63 Briefly, total DNA was extracted and
used as PCR sample. The primer sequences used for mtDNA long segment (16 kb) were mtLongF (5′-TGAGGCCAAA TATCATTCTG AGGGGC-3′) and mtLongR (5′-TTTCATCATG CGGAGATGTT GGATGG-3′). The primer sequences for mtDNA short (80 bp) segment were mtS-hortF (5′-ACCCAAGAAC AGGGTTTGT-3′) and mtShortR (5′-TGGCCATGGG TATGTTGTTA A-3′). The mtDNA long and short segments were amplified using AccuPrime™ Taq DNA Polymerase High Fidelity kit (Life Tech Corp, 12346-086) and separated by agarose gel electrophoresis. The long PCR conditions were as follow: 94 °C for 11 s, followed by 27 cycles of denaturation at 94 °C for 15 s, 67 °C for 12 min and a final extension at 72 °C for 10 min. The short PCR conditions were as follow: 94 °C for 5 s, followed by 19 cycles at 94 °C for 25 s, 60 °C for 45 s, 72 °C for 1 min, and a final extension at 72 °C for 10 min. The gels were stained with ethidium bromide and visu-alized with AlphaImager (Cell Biosciences, Inc., Santa Clara, CA, USA). Densitometry analysis was performed using Image J software. Lesion frequency per 16 kb of mtDNA was calculated
using as described previously.64,65
Mitochondria staining
Cells were plated in 4-well Labtek chambers (Nunc, 155-383) at a concentration of 100,000 cells per well and incubated at 37 °C overnight. Cells were stained in fresh complete medium
with 50 nM MitoTracker® RedCMXRos (Invitrogen, M7512).