Comparison between single-beat and multiple-beat methods for
estimation of right ventricular contractility
Bernard Lambermont, MD, PhD; Patrick Segers, PhD; Alexandre Ghuysen, MD; Vincent Tchana-Sato, MD;
Philippe Morimont, MD; Jean-Michel Dogne, PhD; Philippe Kolh, MD, PhD; Paul Gerard, PhD;
Vincent D’Orio, MD, PhD
T
he assessment of ventricular
contractility is one of the
cor-nerstones of the evaluation of
ventricular systolic function
(1). The development and validation of
the conductance catheter method for the
measurement of pressure-volume (PV)
loops allowed the determination of
in-dexes of ventricular contractility, first
mainly in the left ventricle (2) and later
in the right ventricle as well (3).
How-ever, determination of PV-based
contrac-tile indexes, such as the end-systolic PV
or preload recruitable stroke work
(PRSW) relationships, requires the
re-cording of several PV loops during a
tran-sient preload reduction. Such conditions
are usually obtained by caval vein
occlu-sion, in the experimental setting. In
hu-mans, however, this procedure may be
hazardous and rises ethical criticism.
To circumvent the necessity of preload
reduction, several “single-beat” methods
have been proposed for the left ventricle,
based on data measured during
hemody-namic steady-state conditions. Although
the proposed methodologies appear
at-tractive, Kjorstad et al. (4) demonstrated
that none of the proposed single-beat
methods was able to provide an accurate
evaluation of left ventricular
contractil-ity.
However, since the physiology and
anatomy of the left and right ventricles
differ largely, it remains to be shown
whether the conclusion of Kjorstad et al.
(4), observed for the left ventricle, also
applies to the right ventricle.
The aim of our study was therefore to
evaluate, for the right ventricle, the
orig-inal single-beat method based on work of
Sunagawa et al. (5) and further
elabo-rated by Takeuchi et al. (6). PV loops
recorded by the conductance catheter
were used to compare end-systolic
elas-tance values obtained by the single-beat
method (Ees
sb) with those obtained using
the standard multiple beats method (i.e.,
the slope [Ees
mb] of the end-systolic PV
relationship) during pharmacologic
in-terventions known to alter right
ventric-ular contractility.
MATERIALS AND METHODS
All experimental procedures and protocols used in this investigation were reviewed and approved by the Ethics Committee of the Med-ical Faculty of the University of Liege. The investigation conforms with the guidelines (7) published by the U.S. National Institutes of Health.
Surgical Preparation
Experiments were performed on eight healthy Pietran pigs of either gender weighing from 20 to 30 kg. The animals were premedi-cated with intramuscular administration of ketamine (20 mg/kg) and diazepam (1 mg/kg). Anesthesia was then induced and main-tained by a continuous infusion of sufentanil (0.5 g·kg⫺1·hr⫺1) and pentobarbital (5 mg·kg⫺1·hr⫺1). Spontaneous movements were prevented by pancuronium bromide (0.2 mg/kg). After endotracheal intubation through a cervical tracheostomy, the pigs were connected to a volume-cycled ventilator (Evita 2, Dräger, Lübeck, Germany) set to de-liver a tidal volume of 10 mL/kg with an FIO2 of 0.4 and at a respiratory rate of 20 breaths/ From the Hemodynamic Research Center (BL, AG,
VT-S, PM, J-MD, PK, VD) and Department of Statistics (PG), University of Liege, Liege, Belgium; and the Hydraulics Laboratory (PS), Institute Biomedical Tech-nology, Ghent University, Ghent, Belgium.
Supported, in part, by Fonds de la Recherche Scientifique Médicale (VT-S, PK).
Copyright © 2004 by the Society of Critical Care Medicine and Lippincott Williams & Wilkins
DOI: 10.1097/01.CCM.0000139607.38497.8A
Objective: It was investigated whether pharmacologically
in-duced changes in right ventricular contractility can be detected
by a so-called “single-beat” method that does not require preload
reduction.
Design: Prospective animal research.
Setting: Laboratory at a large university medical center.
Subjects: Eight anesthetized pigs.
Interventions: End-systolic elastance values obtained by a
recently proposed single-beat method (Ees
sb) were compared
with those obtained using the reference multiple-beat method
(Ees
mb).
Measurements and Main Results: Administration of
dobut-amine increased Ees
mbfrom 1.6
ⴞ 0.3 to 3.8 ⴞ 0.5 mm Hg/mL (p
ⴝ .001), whereas there was only a trend toward an increase in
Ees
sbfrom 1.5
ⴞ 0.2 to 1.7 ⴞ 0.4 mm Hg/mL. Esmolol decreased
Ees
mbfrom 1.7
ⴞ 0.3 to 1.1 ⴞ 0.2 mm Hg/mL (p ⴝ .006), whereas
there was only a trend for a decrease in Ees
sbfrom 1.5
ⴞ 0.2 to
1.3
ⴞ 0.1.
Conclusions: The present method using single-beat estimation
to assess right ventricular contractility does not work as
ex-pected, since it failed to detect either increases or decreases in
right ventricular contractility induced by pharmacologic
interven-tions. (Crit Care Med 2004; 32:1886 –1890)
K
EYW
ORDS: conductance catheter; contractile function;
min. End-tidal CO2 measurements (Capno-mac, Datex, Helsinki, Finland) were used to monitor the adequacy of ventilation. Respira-tory settings were adjusted to maintain end-tidal CO2between 30 and 35 mm Hg.
The heart and the pulmonary trunk were exposed by means of medial sternotomy. A micromanometer-tipped catheter (Sentron pressure-measuring catheter, Cordis, Miami, FL) was inserted into the main pulmonary artery through a stab wound in the right ven-tricular outflow tract. A 14-mm diameter perivascular flow probe (Transonic Systems, Ithaca, NY) was closely adjusted around the main pulmonary artery 2 cm downstream of the pulmonary valve. The micromanometer-tipped catheter was manipulated so that the pressure sensor was positioned closely to the flow probe.
Left atrial pressure was measured with a micromanometer-tipped catheter inserted into the cavity through the left atrial append-age. Systemic arterial pressure was monitored with a micromanometer-tipped catheter in-serted into the descending thoracic aorta through the right femoral artery.
A 7-Fr, 12-electrode (8 mm interelectrode distance) conductance micromanometer-tipped catheter (CD Leycom, Zoetermeer, The Netherlands) was inserted through the right ventricular infundibulum into the right ven-tricle and positioned so that all electrodes were in the right ventricular cavity.
A 6-Fr Fogarty balloon catheter (Baxter Healthcare, Oakland, CA) was advanced into the inferior vena cava through a right femoral venotomy. Inflation of this balloon produced a titratable gradual preload reduction.
Experimental Protocol and
Physiologic Measurements
Data were recorded before and during pharmacologic modulation of ventricular con-tractility using a) esmolol infusion at 1 mg·kg⫺1·min⫺1 during 5 mins to decrease contractility; and b) dobutamine infusion at 10g·kg⫺1·min⫺1during 15 mins to enhance contractility. Esmolol and dobutamine infu-sions were randomly administered in each an-imal and separated by a 30-min resting period. Hemodynamic data included measurement of pulmonary artery pressure (PAP), pulmo-nary artery blood flow, left atrial pressure, systemic arterial pressure, heart rate, right ventricular pressure, right ventricular vol-ume, and right ventricular PV loops. These variables were recorded during a short apneic phase and stored for subsequent analysis. All analog signals were continuously converted to digital form with an appropriate AD converter system (Codas, DataQ Instruments, Akron, OH). Systemic arterial pressure, PAP, and pul-monary blood flow waves were integrated to calculate corresponding mean values. Right
ventricular PV loops were recorded during transient occlusion of the inferior vena cava using the Fogarty balloon.
At each step, two sets of data were recorded and analyzed.
Data Analysis
Mulitple-Beat Estimation of Right Ventric-ular Contractility. Right ventricVentric-ular PV loops
were obtained using the conductance catheter method (3). The application, validation, and calibration of the conductance technique for measuring ventricular volume were described elsewhere (2). Although this technique was originally designed for use in the left ventricle, the feasibility of conductance catheter mea-surements in the right ventricle has been also demonstrated (3). Briefly, a multiple-electrode catheter placed in the right ventricle is used to set up an electrical field, and adjacent pairs of electrodes measure the local conductivity of blood, which is proportional to local blood volume (3). The instantaneous conductance signals, G(t), are converted to volume signals, V(t), owing to the following equation:
V共t兲 ⫽ 共1/␣兲关L2 䡠 䡠 G共t兲 ⫺ V c兴 [1]
where␣ is a dimensionless gain factor, L the distance between the sensing electrodes, the resistivity of the blood, and Vcthe correction volume for the conductance of the surround-ing tissue, commonly referred to as parallel conductance. Parallel conductance can be es-timated by transiently altering the conductiv-ity of blood with hypertonic saline (3). To determine the gain factor ␣, an alternate method of measuring volume is needed (3). In this study, we used the value of stroke volume measured by the pulmonary artery ultrasonic flow probe. Before each measurement, parallel conductance was determined with the saline method by injecting 3 mL of NaCl 10% into the inferior vena cava (3).
Eesmbwas determined during a rapid infe-rior vena cava occlusion maneuver by fitting a straight line through the end-systolic PV points (3). During this interval of preload re-duction, the slope of the linear relationship between stroke work and end-diastolic volume (PRSW) was calculated. Stroke work was re-ferred to as the integrated area of each PV loop.
Single-Beat Estimation of Right Ventricu-lar Contractility. Ten consecutive cardiac
cy-cles were selected from steady-state portions during each experimental period. The digi-tized data for each group of measurements were analyzed by a computer-assisted system. Pressure and volume curves for each record-ing period were averaged to produce mean pressure and mean volume waveforms, in or-der to eliminate any noise artifact and com-pensate for beat-to-beat variations. Such ob-tained mean ventricular pressure and volume waves were then graphically opposed to
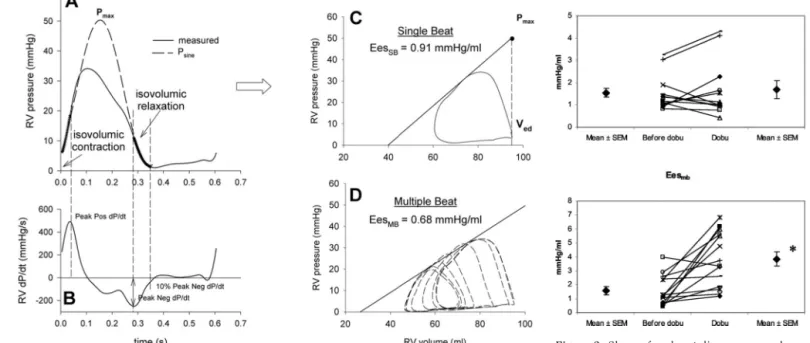
gen-erate a PV loop representative of each experi-mental period. Individual cycles were identi-fied using the onset of ventricular contraction, time-aligned and numerically averaged. The left top corner of the PV loop determined the end-systolic point (Pes, Ves), whereas the right-bottom corner of the PV loop deter-mined the end-diastolic volume (Ved). The method consisted of fitting ventricular pres-sure during the isovolumic contraction and relaxation periods to a sinusoidal function, given as
Psine共t兲 ⫽ A ⫹ B sin共Ct ⫹ D兲 [2]
where A through D are variables obtained from the fitting procedure, which was based on minimizing the square difference between measured and fitted pressure during the iso-volumic periods. The onset of the isoiso-volumic contraction period was taken as the point where right ventricular change in pressure in time (dP/dt) reached 10% of peak positive dP/ dt, whereas the end of the isovolumic contrac-tion period was taken as the moment of peak positive dP/dt. Similarly, the onset of isovolu-mic relaxation was taken as the moment of peak negative dP/dt, whereas the end of this period was assumed to be the point where dP/dt reached 10% of peak negative dP/dt. Pmaxwas the maximal value of Psine and an estimate of the pressure that would be gener-ated by the ventricle in an isovolumic beat at Ved (Fig. 1).
Single-beat elastance, Eessb, is then taken as the slope of the line connecting two points in the PV plane: (Ved, Pmax) and (Ves, Pes), and is thus given by Eessb⫽ (Pmax⫺ Pes)/(Ved ⫺ Ves).
Statistical Analysis
Data are presented as mean⫾SEM. Statis-tical comparison of data before and after each intervention was conducted by a paired Stu-dent’s t-test (Statistica, Statsoft, Tulsa, OK). Comparison of multiple-beat and single-beat Ees estimation was obtained by applying anal-ysis of agreement (8). We considered p⬍ .05 to be statistically significant.
RESULTS
Two sets of data were collected in the
eight pigs during each of the four
exper-imental conditions, that is, before and
after both dobutamine and esmolol
infu-sions. Out of these 64 sets of data, five
were finally excluded from analysis due to
the difficulty of making sine function fit
the pressure curve in three single-beat
records, whereas poor quality in two PV
loops made it impossible to apply both
multiple-beat and single-beat method
analysis.
There was no significant difference
be-tween values of Ees
mband Ees
sb(1.7
⫾
0.2 and 1.4
⫾ 0.1 mm Hg/mL,
respec-tively) at the beginning of the
experimen-tal period.
Effects of Dobutamine Infusion
During administration of dobutamine,
heart rate increased from 117
⫾ 8 to 142
⫾ 7 beats/min (p ⬍ .05), mean PAP
val-ues increased from 17
⫾ 2 to 20 ⫾ 2 mm
Hg (p
⬍ .05), cardiac output increased
from 62
⫾ 3 to 82 ⫾ 4 mL/sec (p ⬍ .05),
and mean systemic arterial pressure
re-mained unchanged.
Administration of dobutamine
in-creased Ees
mbvalues from 1.6
⫾ 0.3 to
3.8
⫾ 0.5 mm Hg/mL (p ⫽ .001), whereas
there was only a trend toward an increase
in Ees
sbfrom 1.5
⫾ 0.2 to 1.7 ⫾ 0.4 mm
Hg/mL (p
⫽ .5; Fig. 2). Administration of
dobutamine increased the slope values of
PRSW relationships from 27
⫾ 6 to 41 ⫾
6 mm Hg (p
⬍ .05).
Effects of Esmolol Infusion
During administration of esmolol,
heart rate decreased from 116
⫾ 7 to 98
⫾ 3 beats/min (p ⬍ .05), mean PAP
val-ues increased from 18
⫾ 2 to 20 ⫾ 2 mm
Hg (p
⬍ .05), cardiac output decreased
from 64
⫾ 2 to 50 ⫾ 2 mL/sec (p ⬍ .05),
and mean systemic arterial pressure
de-creased from 84
⫾ 6 to 77 ⫾ 5 mm Hg (p
⬍ .05).
After administration of esmolol, Ees
mbdecreased from 1.7
⫾ 0.3 to 1.1 ⫾ 0.2
mm Hg/mL (p
⫽ .006), whereas there
was only a trend for a decrease in Ees
sbfrom 1.5
⫾ 0.2 to 1.3 ⫾ 0.1 mm Hg/mL
(p
⫽ .09; Fig. 3). Administration of
esmo-lol decreased the slope values of PRSW
relationships from 25
⫾ 4 to 15 ⫾ 2 mm
Hg (p
⬍ .05).
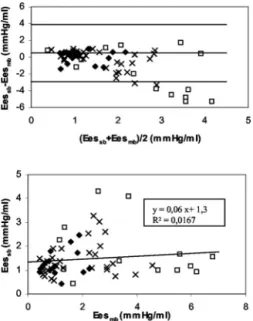
Multiple-Beat Vs. Single-Beat
Estimation of Ees
Correlation between Ees
mband Ees
sbafter pharmacologic interventions is
presented in Figure 4. Ees
sbvalues were
also compared with Ees
mbvalues by
ap-plication of an analysis of agreement
(8). Bias was 0.54 mm Hg/mL, and
lim-its of agreement were
⫾ 3.4 mm Hg/mL
(Fig. 4).
DISCUSSION
Several single-beat methods have been
advanced to assess ventricular
contractil-ity without changing ventricular loading
conditions. However, none of these
vari-ants could provide better results than the
original analysis described by Takeuchi et
al. (6), selected therefore as the reference
single-beat method to evaluate right
ven-Figure 2. Slope of end-systolic pressure-volume
relationship before (baseline) and during dobut-amine (Dobu) infusion obtained by single-beat
Ee-ssb) and multiple-beat (Eesmb) methods. *p⬍ .05.
Figure 3. Slope of end-systolic pressure-volume
relationship before (baseline) and during esmolol (Esmo) infusion obtained by single-beat (Eessb)
and multiple-beat (Eesmb) methods. *p⬍ .05.
Figure 1. Single-beat method to obtain end-systolic pressure-volume relationship (ESPVR). B,
delin-eation of both isovolumic contraction and isovolumic relaxation time delays is based on right ventricular (RV) change in pressure in time (dP/dt). A, a sinusoidal function (Psine) is then adjusted to
fit isovolumic segments of the ventricular pressure contour. The maximum amplitude of the sine wave is taken as Pmax, referred to as the maximum pressure that the ventricle should release if ejection was
impeded (nonejecting beat). ESPVR is then plotted as a line defined by two different points whose coordinates are Pmax and Ved (nonejecting beat) and P and V measured at end-systole (ejecting beat), respectively. D, as a reference, the corresponding multiple-beat ESPVR computation is provided. Eessb,
end-systolic elastance values obtained by the single-beat method; Eesmb, end-systolic elastance values
tricular contractility index in the present
work. We therefore compared two
meth-ods for the evaluation of right ventricular
contractility at baseline, during
dobut-amine and esmolol infusion. These
con-tractile indexes were derived from PV
loops recorded by the conductance
cath-eter technique during either steady state
(single-beat method) or transient preload
reduction (multiple-beat method). Our
results indicate that Ees
sbis less accurate
than Ees
mbin predicting right
ventricu-lar contractility changes induced by
phar-macologic interventions.
Baseline values of contractility
mea-sured in our study were similar to those
reported in the literature (3, 9). Although
there was no difference in mean basal Ees
values obtained by the two methods, and
although the systematic bias of 0.54 mm
Hg/mL was acceptable, limits of
agree-ment (
⫾ 3.4 mm Hg/mL) between the
two methods were unacceptably high.
This reflects the random errors of the
single-beat method and is directly related
to the predictive value of the test.
As expected, Ees
mbincreased during
dobutamine infusion and decreased
dur-ing esmolol infusion (3, 9, 10). In
paral-lel, PRSW relationship slope values were
significantly increased by dobutamine
in-fusion, whereas significant reduction
oc-curred after esmolol administration. In
contrast, neither dobutamine nor
esmo-lol infusions induced significant change
in Ees
sb. These results are in accordance
with those of Kjorstad et al. (4) for the
left ventricle, where none of the applied
single beat methods could predict an
in-crease in contractility induced by
dopa-mine. However, right and left ventricular
physiology and anatomy differ, and,
therefore, the present single-beat method
had to be tested specifically for the right
ventricle (11).
In recent work, Brimioulle et al. (9)
showed that the right ventricular P
maxof
a nonejecting beat can be calculated by a
single-beat analysis and may
subse-quently be used to calculate Ees
sb. Ees
sbobtained by such a method could predict
changes in right ventricular contractility
induced by dobutamine. However, their
conclusions were weakened by the
ab-sence of comparison between this
method and a gold standard. Moreover,
PV loops were obtained by integration of
the instantaneous pulmonary arterial
flow and not by using the conductance
catheter technique (12).
The lack of a significant decrease in
Ees
sbduring esmolol infusion could, in
addition to the low sensitivity of the
sin-gle-beat method, be attributed to the
rather modest reduction in contractility
induced by esmolol. Using the single-beat
method, Brimioulle et al. (9) also found
no difference in contractility after
pro-pranolol infusion, whereas Dickstein et
al. (3) showed a very slight decrease in
Ees after esmolol infusion.
Comparison of single-beat and
multi-ple-beat estimation of contractility
showed bias and limits of agreement
sim-ilar to those reported in the literature for
the left ventricle (4). It shows the lack of
precision of the single-beat method
par-ticularly when Ees values are far from
physiologic values, as it was the case in a
number of animals after administration
of dobutamine. In the single-beat method
applied in this study, a sine wave is fitted
to the ventricular pressure during
iso-volumic contraction and relaxation. This
leads to a number of inherent problems.
First, as noted by Kjorstad et al. (4), a sine
wave is a rather stiff, symmetrical wave
shape. Isovolumic ventricular
contrac-tion and relaxacontrac-tion are not necessarily
symmetrical, especially in cardiovascular
disease or during pharmacologic
inter-ventions. Inotropic stimulation leads to
specific changes in the shape of
ventric-ular pressure curve compared with the
control period. In fact, the isovolumic
contraction pressure increase becomes
considerably steeper than the decrease of
the pressure decay during isovolumic
re-laxation (4). Such a feature implies that
maximal pressure developed by the
ven-tricle is necessarily shifted to the left
leading to an asymmetry in the shape of
the ventricular pressure curve. Such an
asymmetry is not accounted for by the
sine function used to fit the ventricular
curve. As a result, the single-beat
compu-tation method leads to an
underestima-tion of end-systolic elastance values
dur-ing inotropic stimulation since it fails to
accurately reflect the leftward-induced
shift of maximum ventricular pressure.
Another problem, which mainly
ap-plies to the right ventricle, is the fact that
the isovolumic periods are rather short,
especially the isovolumic relaxation
pe-riod. This means not only that there is
little information available for the fitting
procedure, increasing the uncertainty on
the fitted curve and P
max, but also, and
perhaps even more important, that the
method is sensitive to the choice of the
onset and end of the isovolumic
contrac-tion and relaxacontrac-tion period, respectively. It
was not specified by Brimioulle et al. (9)
how the end and onset of the isovolumic
relaxation periods were determined.
Fol-lowing Leeuwenburgh et al. (13), we
selected cutoff values for dP/dt (the
points where 10% of peak positive or
negative dP/dt are reached) to delineate
the isovolumic contraction and
relax-ation periods.
CONCLUSIONS
To the best of our knowledge, our
work is the first one designed to compare
T
he present method
using single-beat
estimation to assess
right ventricular contractility
does not work as expected,
since it failed to detect either
increases or decreases in right
ventricular contractility
in-duced by pharmacologic
interventions.
Figure 4. Scatterplots of analysis of agreement
between single-beat (Eessb) and multiple-beat
(Eesmb) methods before (⫻) and during
dobut-amine (squares) or esmolol (diamonds) infusions and comparison between Eessband Eesmbbefore
(⫻) and during dobutamine (squares) or esmolol (diamonds) infusions.
a single-beat method to the gold standard
multiple-beat method for the assessment
of right ventricular contractility. The
method using single-beat estimation to
assess right ventricular contractility does
not work as expected, since it failed to
detect either increases or decreases in
right ventricular contractility induced by
pharmacologic interventions. Therefore,
single-beat methods still remain an open
field of hemodynamic research and need
to be further investigated to accurately
assess right ventricular contractility.
REFERENCES
1. Wojtczak JA, Szalados JE: Right heart func-tion: Neither silent nor passive. Crit Care
Med 2002; 30:2601–2603
2. Baan J, van der Velde ET, de Bruin HG, et al: Continuous measurement of left ventricular volume in animals and humans by conduc-tance catheter. Circulation 1984; 70: 812– 823
3. Dickstein ML, Yano O, Spotnitz HM, et al: Assessment of right ventricular contractile state with the conductance catheter tech-nique in the pig. Cardiovasc Res 1995; 29: 820 – 826
4. Kjorstad KE, Korvald C, Myrmel T: Pressure-volume-based single-beat estimations cannot predict left ventricular contractility in vivo.
Am J Physiol Heart Circ Physiol 2002; 282:
H1739 –H1750
5. Sunagawa K, Yamada A, Senda Y, et al: Esti-mation of the hydromotive source pressure from ejecting beats of the left ventricle. IEEE
Trans Biomed Eng 1980; 27:299 –305
6. Takeuchi M, Igarashi Y, Tomimoto S, et al: Single-beat estimation of the slope of the end-systolic pressure-volume relation in the human left ventricle. Circulation 1991; 83: 202–212
7. Guide for the Care and Use of Laboratory
Animals (NIH Publication No. 85-23).
Be-thesda, MD, U.S. National Institutes of Health, 1996
8. Bland JM, Altman DG: Statistical methods for assessing agreement between two
meth-ods of clinical measurement. Lancet 1986; 1:307–310
9. Brimioulle S, Wauthy P, Ewalenko P, et al: Single-beat estimation of right ventricular end-systolic pressure-volume relationship.
Am J Physiol Heart Circ Physiol 2003; 284:
H1625–H1630
10. Vogel M, Schmidt MR, Kristiansen SB, et al: Validation of myocardial acceleration during isovolumic contraction as a novel noninva-sive index of right ventricular contractility: Comparison with ventricular pressure-volume relations in an animal model.
Circu-lation 2002; 105:1693–1699
11. Dell’Italia LJ, Santamore WP: Can indices of left ventricular function be applied to the right ventricle? Prog Cardiovasc Dis 1998; 40:309 –324
12. Steendijk P: Right ventricular function and failure: Methods, models, and mechanisms.
Crit Care Med 2004; 32:1087–1089
13. Leeuwenburgh BP, Steendijk P, Helbing WA, et al: Indexes of diastolic RV function: Load dependence and changes after chronic RV pressure overload in lambs. Am J Physiol