HAL Id: dumas-01908937
https://dumas.ccsd.cnrs.fr/dumas-01908937
Submitted on 30 Oct 2018
HAL is a multi-disciplinary open access
archive for the deposit and dissemination of sci-entific research documents, whether they are pub-lished or not. The documents may come from teaching and research institutions in France or abroad, or from public or private research centers.
L’archive ouverte pluridisciplinaire HAL, est destinée au dépôt et à la diffusion de documents scientifiques de niveau recherche, publiés ou non, émanant des établissements d’enseignement et de recherche français ou étrangers, des laboratoires publics ou privés.
Reproductibilité et validité physiologique du test de
levers de chaise de 3 minutes chez les patients atteints
de fibrose pulmonaire idiopathique
Arnaud Fedi
To cite this version:
Arnaud Fedi. Reproductibilité et validité physiologique du test de levers de chaise de 3 minutes chez les patients atteints de fibrose pulmonaire idiopathique. Médecine humaine et pathologie. 2018. �dumas-01908937�
AVERTISSEMENT
Ce document est le fruit d'un long travail approuvé par le
jury de soutenance et mis à disposition de l'ensemble de la
communauté universitaire élargie.
Il n’a pas été réévalué depuis la date de soutenance.
Il est soumis à la propriété intellectuelle de l'auteur. Ceci
implique une obligation de citation et de référencement
lors de l’utilisation de ce document.
D’autre part, toute contrefaçon, plagiat, reproduction illicite
encourt une poursuite pénale.
Contact au SID de Grenoble :
bump-theses@univ-grenoble-alpes.fr
LIENS
LIENS
Code de la Propriété Intellectuelle. articles L 122. 4
Code de la Propriété Intellectuelle. articles L 335.2- L 335.10
http://www.cfcopies.com/juridique/droit-auteur
1
UNIVERSITÉ GRENOBLE ALPES
UFR DE MÉDECINE DE GRENOBLE
Année : 2018
Reproductibilité et validité physiologique du
TEST DE LEVERS DE CHAISE DE 3 MINUTES chez les PATIENTS ATTEINTS DE FIBROSE PULMONAIRE IDIOPATHIQUE.
THÈSE
PRÉSENTÉE POUR L’OBTENTION DU TITRE DE DOCTEUR EN MÉDECINE DIPLÔME D’ÉTAT
Arnaud FEDI
Service de pneumologie et physiologie, CHU Grenoble-Alpes
THÈSE SOUTENUE PUBLIQUEMENT À LA FACULTÉ DE MÉDECINE DE GRENOBLE
Le 26/10/2018 DEVANT LE JURY COMPOSÉ DE :
Président du jury :
M. le Professeur Bernard AGUILANIU Membres :
M. le Professeur Christophe PISON M. le Professeur Bruno DEGANO
M. le Docteur Sébastien QUETANT, Directeur de thèse
L’UFR de Médecine de Grenoble n’entend donner aucune approbation ni improbation aux opinions émises dans les thèses ; ces opinions sont considérées comme propres à leurs auteurs.
2
Table des matières
Liste des enseignants à l’UFR de médecine ... 3
Remerciements ... 7 Serment d’Hippocrate ... 11 Page de résumé ... 12 Article ... 14 Abbreviations ... 15 Abstract ... 16 Introduction ... 17
Materials and methods ... 19
Study design and participants ... 19
Endpoints ... 20 Tests protocols ... 20 1STS ... 20 3STS ... 20 6MWT ... 21 CPET... 21
Respiratory functional tests ... 22
Statistical analysis ... 22
Results ... 23
Patient’s characteristics ... 23
Evaluation of the reproducibility ... 24
Evaluation of variation of saturation during the different test ... 26
Evaluation of the physiological responses during the 3STS ... 28
Discussion ... 34
Page de conclusion ... 37
Bibliography ... 39
Annexes ... 43
Echelle de Borg (Fatigue et Dyspnée) ... 44
Echelle MRC ... 45
Questionnaire DIRECT ... 46
Questionnaire CAT ... 48
Questionnaire HAD... 49
3
7
Remerciements
Aux membres de mon jury
Au professeur Bernard AGUILANIU : professeur passionné et passionnant, un
maître à penser en matière de physiologie qui m’a fait aimer cette discipline. Quel meilleur instructeur qu’un des auteurs du « petit livre rouge » peut-on espérer ?
Au professeur Christophe PISON : de qui j’ai pu apprendre au sein de son service
depuis l’externat, dans lequel je poursuivrai mon assistanat, dont la philosophie m’a toujours marqué. Vous m’avez appris à rester humble devant la maladie. D’autre part merci beaucoup de vous être battu pour mon poste.
Au professeur Bruno DEGANO : bienvenu à Grenoble, j’ai hâte que l’on puisse
travailler ensemble. Grenoblois dans l’âme depuis toujours, vous avez énormément à nous apprendre et même si l’on discute plus de ski que de médecine, cela m’ira aussi.
Au docteur Sébastien QUETANT : merci de m’avoir embarqué dans ce projet et de
m’avoir fait confiance. Grâce à toi j’ai pu côtoyer tes petits patients préférés ce qui m’a permis d’apprendre énormément sur les pathologies interstitielles diffuses.
8
Aux médecins qui m’ont suivi durant ma formation d’interne
Aux médecins de médecine B de Voiron. Dr Mann, Dr Dimitriou, Marcella, Daniel, Caroline, Mathilde… : vous m’avez vu bébé interne et m’avez mis sur les rails
m’ayant permis d’arriver là aujourd’hui. Au Dr Orliaguet qui m’a fait découvrir et aimer l’endoscopie bronchique.
A l’équipe d’oncologie thoracique, Pr. Moro-Sibilot, Anne-Claire, Lynda : Merci de
m’avoir encadré durant ce semestre m’ayant permis de découvrir les bases de la médecine ambulatoire.
Aux médecins du 4 Anne-Laure, Cécile, Johanna, Chrystelle, Boubou, Rebecca :
merci pour les connaissances médicales que vous avez pu m’apporter mais attention bientôt je vais devenir votre boulet.
Aux médecins des EFR Renaud, Marie, Sam, Rita, Jean-Louis, Gilles, Stéphane, Bernard : pour m’avoir fait comprendre que la physiologie est indispensable pour
appréhender le pathologique.
Aux médecins de médecine infectieuse et de réanimation, Pr Terzi, Pr Schwebel, Pr Epaulard Jean-Paul, Patricia, Mylène, Charlotte, Isabelle, Ibrahim, Anne-Claire, Louis-Marie, Caroline, Pierre, Clara : Merci d’avoir accueilli un petit pneumologue et
d’avoir essayé de le former.
Au professeur Vergnon : merci de m’avoir accueilli dans votre service pendant 6
mois et surtout de m’avoir fait découvrir la bronchoscopie interventionnelle. J’ai pu apprendre énormément durant ce temps.
Aux médecins de Saint-Etienne : Isabelle, Sophie, Claire, Pierre, Marjo, Noémie, Antoine : pour votre formidable accueil et pour les connaissances que vous m’avez
apporté (comme apprendre à brasser de la bière et oui Antoine ça aurait été trop facile de parler de l’échographie).
Aux équipes paramédicales
Aux infirmières, aides-soignantes du 4 et de l’HDJ, à l’équipe de réa, d’infectieux, de Voiron, aux secrétaires de pneumo : et surtout courage, dans peu de temps
vous devrez me supporter en tant que vrai docteur.
A Nazha : pour avoir programmer avec entrain les patients à inclure dans cette
étude.
Aux Vergnonettes, Béa, Sylvie, Marielle : pour avoir répondu toujours avec bonne
humeur à mes demandes même si cela vous rajoutait du travail en plus et pour m’avoir laissé utiliser votre ordinateur sur lequel j’ai pu écrire une partie de ce travail.
9
A ma famille
A ma maman : qui m’a toujours soutenu et protéger. Tu m’impressionnes vraiment
dans ton travail même si je ne comprends pas toujours ce que tu fais.
(Et peut être que maintenant tu me feras un peu plus confiance dans mes conseils médicaux).
A mon papa : tu étais le fils du Docteur Fedi, maintenant te voilà le père du Docteur
Fedi (oui on a déjà entendu cela quelque part ou dans un autre sens). Je te souhaite plein de bonheur avec Marie-Hélène.
A grand-père : tu n’es malheureusement pas là avec nous mais je sais que de
là-haut tu es très fière.
A mamie Duche : toi aussi tu es partie trop tôt, tu avais encore tant d’histoires à me
raconter.
A Bon-papa : qui m’a appris à découvrir les plaisirs simples de la forêt ou tu
reposes en paix.
A mamie : te voir ici et en pleine forme me rend très heureux, reste comme cela et
profite bien de la ville Lilloise.
A Antoine et Quentin : même si vous ne m’avez pas suivi et avez préféré les
sciences exactes (oui il en faut mais bon ….). Mais bon c’est bien aussi, devenez les stars des sacs à main (même si ce n’est pas très virile pour des rugbymen :p).
A Megan : et oui bienvenue dans la famille, enfin une qui rattrape mes frères et fait
un boulot virile (vendre de la bière). En tout cas merci pour tes précieux conseils dans la langue de Shakespeare.
A ma marraine Christine et mon parrain Christophe : qui m’ont guidé dans la vie. A tous mes cousins, cousines et mes oncles et tantes, Valérie, Pierre-marie, Juliette, Laurence, Agnès, Stéphane, Marie, Thibaut, Estelle, Pierre, Paul, Adrien, Paul-Eloi, Justine, François, Marion, David et à leur famille : ceux qui ont pu être là
et aux absents. Bérangère, Jean-Laurent, Jean-Philippe, je garde une pensé pour vous.
A François et toute sa petite famille (Antoine, Mathilde, Servan, Audrey, Damien) :
le premier qui m’a montré un peu d’endoscopie même si il se trompe de trou. Et ma belle famille
A Sylvie et Pascal : qui m’ont laissé ravir leur fille (et aussi un peu pour leur
jacuzzi).
A Papou et Doumi : merci pour l’accueil dans votre famille. A Mamilou : pour son dynamisme et son côté punk #ThugLife. A Gégé : pour ton franc parlé.
10
A Thomas et Barbara : pour le côté glamour de la famille (Santa Barbara).
Aux copains
Aux François, Noémie, Marion, Andy, Kevin, Lisa, Machine, Yann et Yann, Charlotte, Marie, Clément, Lulu, Gülay, Kurchat, Manon, aux cachalots, à Kelly Slatter, Cédric, Anaïs, Arnaud, Justine, Aline : pour toutes ces soirées, ces sorties à
Hossegor et ces bons moments depuis la P2.
A la pneumoteam : et oui on a la meilleure spécialité et on est le plus performant
aux heures non raisonnable (#KLF).
A Andrea et Corentin : pour avoir gardé avec amour ma chate (je parle bien de
Nymeria pas de Natacha pour ceux à l’esprit tordu).
Aux oncologues : pour nous confirmer que la pneumologie est vraiment la meilleure
spécialité. Spéciale dédicace à Sarah et Guillaume pour leur superbe mariage (bon au moment où j’écris ces lignes il n’a pas encore eu lieu mais bon il ne faut pas le dire).
A la team 10A, Andrea, Yvan, Manon, Anthéa, Vlad, Sacha, Anne, Etienne, André :
pour ce superbe Erasmus.
Aux copains Lyonnais, Eco, Amandine, Albrice, Laure-me, Jocelyn, Léa, Jeanne, Michel-Yves, Fiona, Franck, Anaïde, Max : pour la découverte de la vie nocturne
Lyonnaise.
Aux co-internes de St-Etienne, Alex, Amandine, Laetitia, Marie Pierre : pour m’avoir
supporté pendant 6 mois. A Simon…
A tous mes co-internes de mon internat, à la team saucisse : parce que finalement
on a passé des semestres plutôt sympas.
Au Fuentes : pour toutes ces superbes vacances passées ensembles.
A mon amoureuse (ouf j’ai failli l’oublier)
Natacha : avec qui je partage ma vie et sans qui je ne m’imagine pas vivre et qui
me fait avancer dans la vie (ça fait beaucoup de vies tout ça mais si c’est pour les passer avec toi ça me va) : acheter un appartement, adopter un chat (bisous Catoune), nous pacser et peut être plus ?
11
Serment d’Hippocrate
12
Page de résumé
Arnaud FEDI
Reproductibilité et validité physiologique du TEST DE LEVERS DE CHAISE DE 3 MINUTES chez les PATIENTS ATTEINTS DE FIBROSE PULMONAIRE IDIOPATHIQUE.
RÉSUMÉ :
Contexte : Les tests à l’effort permettent d’évaluer le retentissement fonctionnel
des patients atteints de maladies respiratoires chroniques. Le test le plus couramment utilisé est le test de marche de 6 minutes (TM6) mais il nécessite un environnement standardisé. Ainsi, d’autres tests d’efforts ont été proposés et notamment des tests de levers de chaise. L’objectif de cette étude était d’étudier la reproductibilité et les réponses physiologiques au cours d’un test de levers de chaise de 3 minutes (TLC3) chez des patients atteints de fibrose pulmonaire idiopathique (FPI).
Méthodes : Nous avons réalisé une étude prospective et multicentrique évaluant la
reproductibilité du TLC3 chez des patients atteints de FPI entre 2 visites espacées de moins de 2 mois. D’autre part ce test a pu être comparé au TM6 et au test de levers de chaise de 1 minute (TLC1) et à l’épreuve d’effort incrémentale (EFXi).
Résultats : 33 patients atteints de FPI ont été inclus entre février 2017 et aout
2018. La performance (nombre de levers) du TLC3 entre les 2 visites était très reproductible avec un coefficient de corrélation intra-classe (CIC) à 0,96. Les réponses physiologiques étaient bien reproductibles avec CIC=0,80 et CIC=0,71 pour la saturation finale et la fréquence cardiaque finale respectivement. D’autre part, la réalisation d’un TLC3 permettait d’estimer la consommation maximale d’oxygène possible lors d’une EFXi pour un patient de manière assez précise avec
13
un coefficient de corrélation R²=0,82.
Conclusion : Le TLC3 est un test reproductible permettant d’obtenir une estimation
précise de la capacité de travail des patients atteints de FPI.
MOTS CLÉS : fibrose pulmonaire idiopathique, test de levers de chaise de 3 minutes, test de levers de chaise de 1 minute, épreuve d’effort incrémental sur ergo-spiromètre, test de marche de 6 minutes.
14 Article
Reproducibility and physiological validity of the 3 MINUTES SIT-TO-STAND
TEST in PATIENTS WITH IDIOPATHIC PULMONARY FIBROSIS.
Abbreviations ... 15
Abstract ... 16
Introduction ... 17
Materials and methods ... 19
Study design and participants ... 19
Endpoints ... 20 Tests protocols ... 20 1STS ... 20 3STS ... 20 6MWT ... 21 CPET... 21
Respiratory functional tests ... 22
Statistical analysis ... 22
Results ... 23
Patient’s characteristics ... 23
Evaluation of the reproducibility ... 24
Evaluation of variation of saturation during the different test ... 26
Evaluation of the physiological responses during the 3STS ... 28
Discussion ... 34
Page de conclusion ... 37
15
Abbreviations
1STS: 1-minute sit-to-stand test 3STS: 3-minutes sit-to-stand test 6MWT: 6-minute walk test
CAT: COPD assessment Test
COPD: chronic obstructive pulmonary disease CPET: Cardiopulmonary Exercise Testing
Direct: DIsability RElated to COPD Tool DLco: diffusing capacity for carbon monoxide
EV: expired volume
HAD:Hospital anxiety and depression scale
HR: Heart rate
IPF: idiopathic pulmonary fibrosis RR: respiratory rate
SD: standard deviations SpO2: pulse oxygen saturation
SGQ: St George’s hospital respiratory questionnaire TV: tidal volume
VC: vital capacity
16
Abstract
Background: Effort tests are used to assess the disability and functional impact of
patients with chronic respiratory diseases. The test usually performed is a 6 minutes walking test (6MWT) but it requires a standardized environment. Thus, different modalities of sit-to-stand test were recently proposed. In this study, we evaluated the reproducibility and physiological responses during a 3-minutes sit-to-stand test (3STS) in patients with idiopathic pulmonary fibrosis (IPF).
Methods: We conducted a prospective, multicenter study evaluating the
reproducibility of 3STS in patients with IPF between 2 visits less than 2 months apart. On the other hand, this test could be compared to the 6MWT, to the 1-minute sit-to-stand test (1STS) and to the incremental effort test (EFXi).
Results: A total of 33 patients were included from February 2017 to August 2018.
The performance (number of rises) of the 3STS between the 2 visits was highly reproducible with an intra-class correlation coefficient (ICC) of 0.96. Physiological responses were well reproducible with ICC=0.80 and ICC=0.71 for final saturation and final cardiac frequency, respectively. On the other hand, the realization of a 3STS made it possible to estimate the maximum oxygen consumption for a patient in a fairly precise manner with a correlation coefficient R² = 0.82.
Conclusion: The 3STS is a reproducible test and provides an accurate estimation
17
Introduction
Idiopathic pulmonary fibrosis (IPF) is the most common form of interstitial fibrosing lung disease (1). It’s a rare disease with a prevalence estimated between 14 and 28/100000 people in the United-states. This matches the number of approximatively 9000 patients in France with an incidence between 6.8 and 8.8/1000 per year, with a minimum of 4400 new patients per year in France (2). The first symptom is usually effort dyspnea and IPF frequently lead to a chronic respiratory insufficiency (3).
Evaluation of patient exercise capacity is a major challenge for patients with chronic respiratory disease. It allows to evaluate the handicap of a patient and to give the prognosis of the disease (4).
To achieve this, different tests are usually used. One of the most common and reliable tools for accessing functional capacity of these patients is the six minutes walking test (6MWT). Several studies evaluating patients with IPF showed that the distance covered during this test is a predictive factor of 1-year mortality and that a decrease of this distance of more than 50 meters in 24 weeks or pulse oxygen desaturation during this test is associated with a times greater mortality. (5–11). However, the 6MWT is complicated to implement as a routine clinical activity because it require space and a standardized environment (12). For this reason, several chair rising tests easily achievable during consultation has been widely investigated in different populations (13). Among them, one of the most studied in lung diseases was the 1-minute sit-to-stand test (1STS). The 1STS has been studied in patients with chronic obstructive pulmonary disease (COPD), cystic fibrosis or interstitial lung disease. Several studies have shown a correlation between the number of rises and the distance walked during the 6MWT (14–19).
18
On the other hand, for patients with interstitial lung disease, the desaturation during the 1STS was lower than during the 6MWT (20) and for patient with cystic fibrosis, the 1STS had moderate correlation with the VO2 peak of CPET not allowing to
accurately assessing peak exercise capacity (21).
More recently, another modality for patients was a 3-minutes sit-to-stand test (3STS). The 3STS last longer than the 1STS, possibly allowing for a higher effort.
Aguilaniu et al. studied the 3STS in patients with COPD and demonstrated that this
test is reproducible for these patients and that physiological response obtained during 3STS and 6MWT were interchangeable for most patients (22). In contrast the 3STS had never been studied in IPF population.
The main aim of this study was to evaluate the reproducibility in term of performance (number of rises), symptoms and physiological responses (final saturation and final heart rate) during the 3STS in IPF patients. The other purpose was to compare the reproducibility of the 3STS to the 6MWT and the 1STS. Furthermore, ventilatory responses during the 3STS were assessed and compared to those obtained during a cardio-respiratory effort test (CPET). The aim was to evaluate the correlation between the different measured quantities of these 2 tests, which would make it possible to estimate a patient's maximum capacity for effort using a 3STS.
19
Materials and methods
Study design and participants
We enrolled IPF patients followed at the Rare Lung Disease Competence Center in Grenoble, Besançon and Lyon. All patients received written information and gave
consent to participate. The study protocol was approved by the SOUTH-EAST
French ethic committee.
The inclusion criteria of this study were subjects (aged > 18 years and < 85 years) with a diagnosis of IPF according to international guidelines (23) and a clinical stability (absence of exacerbation within the previous 3 months). Exclusions criteria were the impossibility to perform more than 200 meters during a 6MWT, articular pain which prevents the implementation of a sit-to-stand test, another respiratory disease or cardiac disease which may affect the test.
Patients made 2 hospital visits separated by maximum 2 months. At each visit, patients had to do a 6MWT, a 3STS and a 1STS. In addition, during the second visit, patients had to do a 3STS with measure of the oxygen consumption (VO2). Patients also completed respiratory and quality of life questionnaires (Hospital anxiety and depression scale (HAD), COPD assessment Test (CAT), St George’s hospital respiratory questionnaire, DIsability RElated to COPD Tool (Direct)). The results of their respiratory functional tests (spirometry, plethysmography, CO
diffusion measurement), as well as those of their maximal incremental test on a
20
Endpoints
The primary endpoint was the reproducibility of the 3STS (number of rises) during the 2 visits. The other endpoints were the reproducibility of physiological parameters (pulse oxygen saturation (SPO2), heart rate) and symptoms of the
3STS. This was compared with the performance and the reproducibility of the 1STS and the 6MWT tests.
Physiological response obtained during a 3STS was compared with that obtained during a CPET. From these measurements the maximum values (last 20 seconds) of VO2 – expired volume (EV) - tidal volume (TV) - respiratory rate (RR) – Heart
rate (HR) both exercises were compared. Then the metabolic cost of sit-to-stand movement during the 3STS was assessed, in order to predict the VO2 of this
exercise from the speed of execution of the standing movement.
Tests protocols
1STS
During the 1STS, patients were instructed to perform the maximum of rises from a standard chair without armrest (floor to seat height 45 cm)during 1 minute without help of upper limbs. 30 seconds after they start, the remaining time was indicated to them. The HR and SPO2 were monitored continuously with a finger oximeter. The
number of rise at the end of the 3 minutes was reported by the examiner. Dyspnea and leg fatigue were evaluated at the beginning and at the end of the test with the Borg scale.
3STS
During the 3STS, the first minute rhythm was imposed to the patient (12 or 20 rises). The rhythm is decided by the examining physician, according to his prediction of the clinical possibilities of the patient. This was intended to reduce the
21
variability related to the behavior of the patient at the beginning of the exercise. After the first minute, the rhythm was left free to the patient with instructions to do as many rises as possible during the remaining two minutes. Patients had the opportunity to accelerate if the initial rate was not strong enough or to slow down if they think they could not hold for 3 minutes. Each 30 second, the remaining time was indicated to them. The number of rises at the end of the 3 minutes was reported by the examiner. The HR and SPO2 were monitored continuously with a
finger oximeter. Dyspnea and leg fatigue were evaluated at the beginning and at the end of the test with the Borg scale. One of the 3STS of the second visit was performed with a pneumotachograph. The pneumotachograph was calibrated with gases of known standard concentrations before each test. The maximum values of VO2, expired volume, tidal volume, respiratory rate, heart rate and SpO2 were
reported.
6MWT
The 6MWT was performed in accordance with international recommendations (12). Patients were asked to walk as far as possible in a 50-m indoor corridor. They were allowed to stop during the test if necessary. Dyspnea was assessed before and after the test using Borg scale, and SpO2 and HR were monitored continuously with a finger oximeter. At the end of the 6 minutes, the distance covered was reported.
CPET
Cardiopulmonary exercise testing (CPET) was performed on a cycle ergometer. The pneumotachograph was calibrated with gases of known standard concentrations before each test. After warming up, the cycle resistance increased incrementally every minute. Heart rate and SpO2 were continuously measured with a finger oximeter. The maximum values (last 20 seconds) of resistance, VO2,
22
Respiratory functional tests
Vital capacity (VC), forced expiratory volume in 1 s (FEV1), and total lung capacity were measured by spirometry and plethysmography. DLco was also measured. Predicted values for lung volumes and DLco were based on the European Respiratory Society guidelines (24,25).
Statistical analysis
The analysis included descriptive statistics of the main variables. Quantitative variables were expressed as means and standard deviations (SD). The reproducibility between the 2 visits of test performances (distance covered during the 6MWT and number of rises during 1 and 3STS), physiological responses (final heart rate and final saturation of the 3 tests) and symptoms at the end of the 3 tests were obtained using the interclass Pearson’s correlation coefficient with p-values <0.5, 0.5–0.75, 0.75–0.9, and >0.9 indicating poor, moderate, good, and excellent agreement, respectively. A Bland–Altman analysis was conducted to graphically represent the limits of agreement between the 2 visits of number of rises during the 3STS and the 1STS, distance covered during the 6MWT and final SpO2 of the 3
tests.
Differences of saturations drop between the different tests and differences of VO2
measured during the 3STS, predicted during the 6MWT and measured during the CPET were calculated with the student’s t-test. A P-value of 0.05 was considered significant. All statistical tests were done with the statistical software R (R Foundation for Statistical Computing).
23
Results
Patient’s characteristics
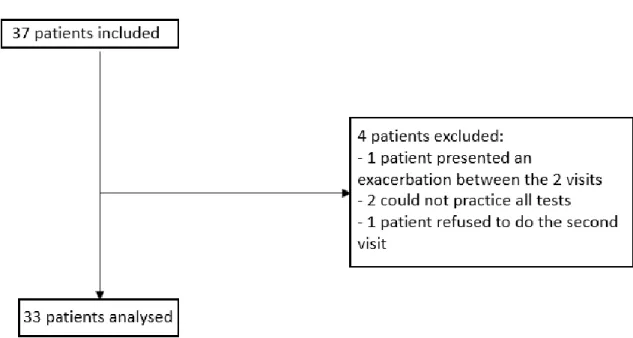
A total of 37 patients were included from February 2017 to August 2018. 24 were recruited in Grenoble, 11 in Besançon and 2 in Lyon. 4 patients were excluded after the first visit, 2 could not practice all test, 1 presented an exacerbation and 1 refused to did to the second visit. Data from 33 patients were analyzed. These 33 patients practiced during the 2 visits 2 3STS, 2 6MWT, 1 CPET, 1 3STS with measurement of VO2 and completed the respiratory questionnaire. Implementation of 1STS was not added to the protocol until a second time. 23 from the 33 patients practiced 1STS during each visit (figure 1).
Figure 1 : flow chart which represented patients’ inclusion
28 out of 33 patients were men (85%) averaged of 70 years old (± 6.0 years). They presented during their functional respiratory tests an average vital capacity of 2.9 liters ± 0.8 liters or 85% of the predicted ± 24%. They had on average a DLCO at 12.5 mL-1.mmHg.min-1 ± 4.7 or 50% of the predicted ± 15.9. Patients had on
24
average a HAD score at 10.3 ± 8.2, DIRECT at 9.6 ± 6.5, CAT at 14.4 ± 7 and St. George's questionnaire at 33.7 ± 17.1. 27 out of 33 patients had a specific treatment of the IPF (Nintedanib or Pirfenidone). 21 out of 33 patients were ex-smokers,11 non-smokers, 1 was an active smoker. None of the 33 patients have oxygen therapy all day, 2 patients used oxygen during effort. These results were resumed in table 1.
Table 1: patients’ characteristics. VC, vital capacity; DLco, diffusing capacity for carbon monoxide; HAD, Hospital anxiety and depression scale; DIRECT, DIsability RElated to COPD Tool; CAT, COPD assessment Test. SGQ, St George’s hospital respiratory questionnaire
Evaluation of the reproducibility
During the 3STS, patients had an average of 55.6 ± 14.9 rises during the first visit and 58.4 ± 15.6 rises during the visit two, a difference of 2.8 rises. There was a
n (%) Sex Men 28 (85) Women 5 (15) Tabac No smoker 11 (33) Ex smoker 21 (63) Active smoker 1 (3) Long time oxygenotherapy All day 0 (0) Effort 2 (6) Specific IPF treatment Nintedanib 18 (55) Pirfenidone 9 (27) Total 27 (82)
Means ± standard deviation
Age Year 70 ± 6.0 Fonctionnal respiratory test VC (L) 2.9 ± 0.8 VC (% predicted) 85 ± 24 DLco (mL-1.mmHg.min-1) 12.5 ± 4.7 DLco (% predicted) 50 ± 15.9 Questionnary HAD 10.3 ± 8.2 DIRECT 9.6 ± 6.5 CAT 14.4 ± 7 SGQ 33.7 % ± 17.1
25
strong correlation of the number of 3STS rises between the first and second visits with a correlation coefficient ICC = 0.9579 (IC 95% [0.9157; 0.9792]) (table 2). Pa-tients covered during the 6MWT an average of 486 ± 101 meters during the first visit and 503 ± 96 meters during the second with a difference of 17 meters between the 2 visits. Similarly to 3STS, there was a good correlation of the distance covered during the 6MWT between the two visits with a correlation coefficient ICC = 0.9517 (IC 95% [0.9036; 0.9761]). The correlation was similar between the 2 visits for the final saturation obtained during the 3STS than those obtained during the 6MWT but patients desaturate more during the 6MWT: ICC=0.8003 (IC 95% 0.6302; 0.8971) versus ICC=0.8763 (IC 95% 0.7623; 0.9375). On the other hand, the correlation was better for the maximal heart rate during the 6MWT than those obtained during the 3STS: ICC=0.8518 (IC 95% 0.7186; 0.9247) versus ICC=0.7066 (IC 95% 0.4797; 0.845). Symptoms like dyspnea and leg fatigability were less reproducible than the other parameters.
Regarding to 1STS, the number of rises, the final saturation and the final heart rate were as reproducible as values measured during 3STS and 6MWT with correlation coefficients of ICC=0.9066 (IC 95% 0.7895; 0.96), ICC=0.7595 (IC 95% 0.5055; 0.8923) and ICC=0.7851 (IC 95% 0.5513; 0.9046) respectively (Table 2). Com-pared to the 3 STS and 6MWT, symptoms observed during 1STS appeared to be poor reproductible with ICC=0.5333 (IC 95% 0.1552; 0.7751) for Borg’s dyspnea and ICC=0.4615 (IC 95% 0.0608; 0.734) for Borg’s fatigue. The reproducibility of number of rises during the 3STS and the 1STS, distance covered during the 6MWT and final SpO2 of the 3 tests were graphically represented using Bland–Altman
26
Visit 1 Visit 2
Variable Means ± stan-dard deviation CV (%) Means ± stan-dard deviation CV (%) ICC CI 95% 3STS (n=33) Nbr. rises 55.6 ± 14.9 26.8 58.4 ± 15.6 26.6 0.96 0.92 ; 0.98 SpO2 (%) 91.1 ± 5.9 6,5 89.9 ± 6.0 6.7 0.80 0.63 ; 0.90 HR (bpm) 110 ± 23 21 116 ± 20 18 0.71 0.48 ; 0.85 Dyspnea (Borg) 5.7 ±2.1 36.3 6.0 ± 2.2 36.1 0.64 0.38 ; 0.81 Fatigue (Borg) 5.4 ± 2.1 38.7 5.7 ± 2.1 37.2 0.65 0.39 ; 0.81 6MWT (n=33) distance (m.) 486 ± 101 21 503 ± 96 19 0.95 0.90 ; 0.98 SpO2 (%) 87.3 ± 7.2 8.2 87.2 ± 6.6 7.6 0.88 0.76 ; 0.94 HR (bpm) 112 ± 22 19 111 ± 19 17 0.85 0.72 ; 0.92 Dyspnea (Borg) 4.7 ± 2.2 48 4.6 ± 2.3 50 0.69 0.45 ; 0.83 1STS (n=23) Nbr. rise 25.9 ± 8.5 33.3 26.1 ± 8.5 32.4 0.91 0.79 ; 0.96 SpO2 (%) 92.8 ± 4.7 5.1 93.5 ± 4.7 5 0.76 0.51 ; 0.89 HR (bpm) 99 ± 24 24 101 ± 17 17 0.79 0.55 ; 0.90 Dyspnea (Borg) 4.6 ± 2.1 45.1 4.2 ± 2.2 52.4 0.53 0.16 ; 0.78 Fatigue (Borg) 3.4 ± 1.8 52.4 4.1 ± 2.1 51.7 0.46 0.06 ; 0.73
Table 2: Results of functionnal test at visit 1 and visit 2. 6MWT, six minutes walking test; SpO2,
oxygen saturation; HR, heart rate; ICC, Pearson’s correlation coefficient; 1STS, 1-minute sit-to-stand test; 3STS, minutes sit-to-stand test.
Evaluation of variation of saturation during the different test
At visit 1, during the 6MWT the oxygen saturation fell in average of 8.2% ± 6.3 ver-sus 4.8% ± 5.1 for the 3STS. At visit 2, the oxygen saturation fell in average of 7.8% ± 5.6 versus 6.6% ± 5.3 for the 6MWT and the 3STS respectively. Over all two visits, the saturation drop was statistically higher during the 6MWT than during
27
the 3STS with a p<0.01.
During the 1STS, the oxygen saturation fell in average of 3.5% ± 3.8 at the first visit and of 3.2% ± 3.3 at the second. The saturation drop was significant lower after a 1STS than after a 3STS with a p- value <0.01.
visit 1 visit 2 Variable Means ± standard de-viation Means ± standard de-viation ICC CI 95% 3STS (n=33) Sp02 in (%) 95.9 ± 2 96.5 ± 2.3 0.43 0.11 ; 0.68 SpO2 fin (%) 91.1 ± 5.9 89.9 ± 6.0 0.80 0.63 ; 0.90 Δ SpO2 (%) 4.8 ± 5.1 6.6 ± 5.3 0.75 0.55 ; 0.87 6MWT (n=33) Sp02 in (%) 95.6 ± 2.1 95.1 ± 3.1 0.51 0.21 ; 0.73 SpO2 fin (%) 87.3 ± 7.2 87.2 ± 6.6 0.88 0.76 ; 0.94 Δ SpO2 (%) 8.2 ± 6.3 7.8 ± 5.6 0.83 0.67 ; 0.91 1STS (n=23) Sp02 in (%) 96.3 ± 2.1 96.7 ± 2.4 0.52 0.14 ; 0.77 SpO2 fin (%) 92.8 ± 4.7 93.5 ± 4.7 0.76 0.51 ; 0.89 Δ SpO2 (%) 3.5 ± 3.8 3.2 ± 3.3 0.84 0.66 ; 0.93
Table 3: Results of saturation variation at visit 1 and 2. 6MWT, six minutes walking test; SpO2,
oxygen saturation; ICC, Pearson’s correlation coefficient; 1STS, 1-minute sit-to-stand test; 3STS, 3 minutes sit-to-stand test; in, initial; fin, final.
Maximal heart rate was similar after a 6MWT than after 3STS evoking similar effort intensity. Maximal heart rate seemed to be lower during a 1STS than during a 3STS or a 6MWT evoking a lower effort intensity.
28
Figure 2: Bland–Altman plot of the difference between the 2 visits of number of rises during the 3STS and the 1STS, distance covered during the 6MWT and final SpO2 of the 3 tests. Solid red line
represents the mean difference. 3STS, 3-min sit-to-stand test; 1STST, 1-min sit-to-stand test; 6MWT, 6-min walk test; SpO2, oxygen saturation.
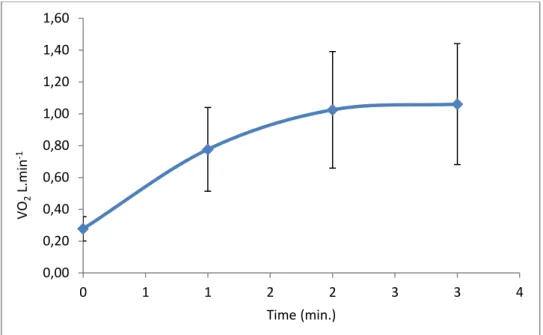
Evaluation of the physiological responses during the 3STS
During the 3STS, VO2 increased during the 2 first minutes until it reached a plateau between the second and the third minute. The average VO2 measure at the first
minute corresponds to 66.7% of the VO2 maximal, to 89.6% at the second minute and 96.0% at the third minute (fig. 3).
-20 -15 -10 -5 0 5 10 15 0 20 40 60 80 100 3STS number of rises -15 -10 -5 0 5 10 15 75 80 85 90 95 100 3STS final SpO2 -100 -50 0 50 100 250 350 450 550 650 Distance 6MWT -15 -10 -5 0 5 10 15 75 80 85 90 95 100 6MWT final SpO2 -10 -5 0 5 10 10 20 30 40 50 1STS number of rises -15 -10 -5 0 5 10 15 75 80 85 90 95 100 1STS final SpO2
29
Figure 3: average and standard deviation of O2 consumption measured each minute during the
3-minutes sit-to-stand tests.
The VO2, expired volume and heart rate measured at the peak of the exercise were
lower during a 3STS than those measured during a CPET. The tidal volume was similar during the 2 tests. The difference of expired volume of the 2 tests was due to the difference in respiratory rate which was lower during a 3STS. These different elements showed that the 3STS was less maximal than the CPET. However, the intensity of 3STS was sufficient to allow the patient to reach their maximal tidal volume. These results are resume in table 3. Otherwise, desaturation during a 3STS and a CPET were similar, unlike the 6MWT. Except for the performances, functional response presented a good agreement (table 3).
0,00 0,20 0,40 0,60 0,80 1,00 1,20 1,40 1,60 0 1 1 2 2 3 3 4 VO 2 L.min -1 Time (min.)
30
Variables
Means ± standard devia-tion
3STS CPET
ICC CI 95%
Nbr of rises /
maxi-mal power watt 57.5 ± 16.2 98.9 ± 36.4 0.43 0.11 ; 0.68
VO2 max L.min-1 1.2 ± 0.4 1.4 ± 0.5 0.86 0.74 ; 0.93 VO2max sp mL.kg-1 15.7 ± 3.6 18.4 ± 4.9 0.70 0.47 ; 0.84 TV max L 1.5 ± 0.6 1.6 ± 0.5 0.87 0.75 ; 0.93 RR max cpm 36.8 ± 10.4 44.6 ± 10.7 0.82 0.67 ; 0.91 EV max L.min-1 57.4 ± 17.7 73 ± 19.8 0.72 0.50 ; 0.85 HR max bpm 125 ± 20.9 138 ± 20.3 0.82 0.67 ; 0.91 SpO2 fin % 88.4 ± 6.6 88.2 ± 5.3 0.81 0.64 ; 0.90
Table 3: Comparison of functional responses during CPET and 3STS. Values were measured at the peak of the exercise. SpO2, oxygen saturation; HR, heart rate; VO2, O2 consummation; TV, tidal
volume; RR, respiratory rate; EV, expired volume; ICC, Pearson’s correlation coefficient; 3STS, 3 minutes sit-to-stand test; CPET, maximal incremental test on a cycle ergometer
More than the number of rises, the movement speed was correlated to the VO2. To
calculate the movement speed, this formula: s=N x d x 2/3 could be used with s (movement speed m.min-1), N (number of rises during the 3 minutes), and d
(distance covered which corresponded to the size of the patient standing less the size sit in meters). The distance was multiplied by 2 because patients did 2 times the distance (up and down) and the time was divided by 3 because the test lasts 3 minutes. Accordingly, the results obtained for the movement speed were in meters per minute. Figure 4 shows the correlation between movement speed and VO2 in
each center. There was a high correlation with a correlation factor R²=0.82 in each center.
31
Figure 4: correlation between movement speed during the 3STS and VO2 in each center. 3STS, 3
minutes-sit-to-stand test, VO2, O2 consumption.
Dividing the maximum O2 consumption by the movement speed given to us the
average cost of sitting-standing = 1.1 +/- 0.33 mlO2.kg-1.m-1.
The VO2 maximal measured during a 3STS was lower than those measured during
a CPET, especially in patient able to provide a significant power. However, the VO2
maximal obtained during a 3STS was highly correlated to those obtained during a CPET with a correlation factor R²=0.76. (Figure 5)
Figure 5: Correlation between VO2max measured during 3STS and CPET, 3STS, 3 minutes-sit-to-stand test, VO2, O2 consumption, CPET, maximal incremental test on a cycle ergometer.
y = 0,8149x + 2,9229 R² = 0,8181 y = 0,7226x + 6,9326 R² = 0,818 0,00 5,00 10,00 15,00 20,00 25,00 0,00 5,00 10,00 15,00 20,00 25,00 VO2m ax s p m l.m in -1.k g -1
movement speed m.min-1
Grenoble Besançon Lyon y = 0,4297x2+ 0,0597x + 0,6447 R² = 0,7644 0 0,5 1 1,5 2 2,5 3 0 0,5 1 1,5 2 2,5 VO2max CPET L.min-1 VO2max 3-STS L.min-1
32
Thanks to this correlation, the VO2 max of a CPET could be estimated by using VO2
measured during a 3STS.
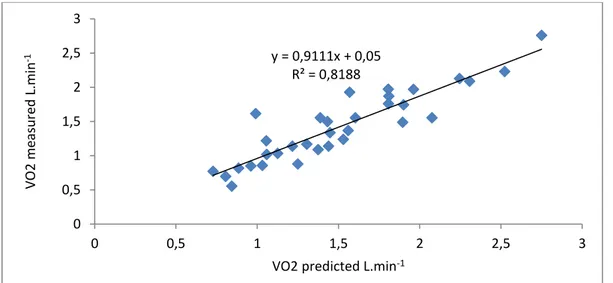
With the movement speed calculated during a 3STS, the VO2 maximal reached for
a patient during this test could be estimated using the average cost of sitting-standing. Using the VO2 estimated, the VO2 reach during a CPET could be
predicted quite accurately. For example, the VO2 maximal estimated in function of
the 3STS results of the second was highly correlated with VO2 maximal measured
during CPET with a correlation factor R2= 0.82 (figure 6).
Figure 6: Comparison of VO2max predicted by the number of rises during the 2nd visit and VO2max
measured during CPET. 3STS, 3 minutes-sit-to-stand test, VO2, O2 consumption, CPET, maximal
incremental test on a cycle ergometer.
In their study, Bunc and Dlouha estimated the energy cost of a 6MWT (26). They
concluded that by using this formula, the O2 consumption during a 6MWT could be
estimated: VO2 (mlO2min-1.kg-1) = 4,501 – 0,108 V + 0,379 V2 (V = km.h-1). The
VO2 reached during the 6MWT could be estimated at the second visit. The figure 7
shows that VO2 estimated was lower during a 6MWT than during a CPET or a
3STS, made us suspect that this effort was less intense than the other 2 (figure 6) with an average VO2 of 13.9 +/- 3.5, 18.4 +/- 4.9 and 15.7 +/- 3.6 respectively. The
difference between VO2 estimated during the 6MWT and the VO2 measured during
y = 0,9111x + 0,05 R² = 0,8188 0 0,5 1 1,5 2 2,5 3 0 0,5 1 1,5 2 2,5 3 VO2 m easured L.min -1
33
the 3STS was significant with a p-value < 0.01. The difference between VO2
measured during the CPET and the VO2 measured during the 3STS was significant
with a p-value < 0.01.
Figure 6: VO2 max average and standard deviation measured during CPET and 3STS and estimated
during 6 MWT. 3STS, 3 minutes-sit-to-stand test, VO2, O2 consumption, CPET, maximal incremental
34
Discussion
In this study, we demonstrated for the first time the reproducibility of the 3STS in patient with IPF. Moreover, 3STS also allowed estimating fairly reliably the VO2max
that can reach a patient with IPF. The 3STS is easy to perform and does not require specialized hardware. These attributes could make it an ideal test for use in office settings and during routine consultations.
1STS and 6MWT also appeared highly reproducible and each had some advantages or disadvantages. The 1STS was the easiest and fastest realized, the 6MWT best detected desaturation on exercise but required more time and standardized environment. The 3STS appeared to be the best compromise between feasibility and performance and required the greatest metabolic potency. In contrast, oxygen desaturation was lower during 3STS compared to 6MWT. Otherwise, It has been described that saturation drops more during a 6MWT than during a CPET (21,27–29). We obtained similar results. In contrast, the saturation drop was similar during a 3STS and a CPET.
In their study, Aguilaniu et al. evaluated the reproducibility of the 3STS in patient with COPD (22). They obtained interclass correlation between the 2 visits from 0.83
to 0.94 (according to the modality of the 3STS). These values were similar to ours with a coefficient correlation of 0.96. Similarly, the reproducibility of the symptoms was worse than the other parameter evaluated. In contrast, unlike this study,
Aguilaniu et al. found similar minimal Sp02 values between 6MWT and 3STS. This
difference could be explained by the fact that in our study the patients desaturated more than in the other study. Briand et al. analyzed the 1STS in patient with different interstitial lung diseases (21), especially they included 51 patients with IPF.
35
They showed a good correlation between desaturation during the 1STS and the 6MWT. In our study, desaturation during the 1STS were clearly lower than desaturation during the 6MWT.
The VO2 measured at the peak of the exercise was higher during the CPET than
estimated during the 6MWT or measured during the 3STS. Holland et al. also compared the VO2 peak during 6MWT and CPET in patient with IPF (29). They
found a similar result, with a VO2 peak lower during the 6MWT than during the
CPET. The VO2 peak during a 1STS also has been compared to the CPET in
patients with cystic fibrosis (21,30). The 1STS had moderate correlation with the VO2 peak of CPET not allowing to accurately assessing peak exercise capacity. On
the other hand, in our study the correlation between 3STS and VO2 peak of a CPET
allowed to assess quite accurately peak exercise capacity.
Our study comports several limitations. Firstly, the interval time between the 2 visits was not standardized (24h to 2 months).We authorized an extension of the duration between two visits until 2 months to avoid successive hospital’s coming outside of the usual follow-up. Perform the 2 tests spaced a short time would probably have increased the reproducibility. Our study showed good reproducibility of the 3STS despite the large lapse of time between the two visits. This reflects the clinical interest of the test that could be used and compared during 2 follow-up visits of a patient. Furthermore several stress tests were performed on the same day for patients with respiratory disability. If the patient did not fully recover after a test, the performance of other tests may be worse. To avoid this, between 2 tests we were waiting for patients to regain their basic physiological constants.
36
In conclusion, our study highlights that 3STS is a reproducible and easily achievable test generating interesting physiological responses. It proves to be a promising alternative to traditional exercise capacity tests for IPF patients during routine consultations. It should be interesting to analyze whether a variation of the number of rises or of the physiological responses during 3STS longitudinal evaluation is enable to assess long-term prognosis of IPF patients or depict physical changes after a program of rehabilitation.
37
Page de conclusion
THÈSE SOUTENUE PAR : Arnaud FEDI
TITRE : Reproductibilité et validité physiologique du TEST DE LEVERS DE
CHAISE DE 3 MINUTES chez les PATIENTS ATTEINTS DE FIBROSE PULMONAIRE IDIOPATHIQUE.
CONCLUSION :
La capacité de travail est une grandeur fonctionnelle utile pour évaluer le handicap et le pronostic des patients atteints de fibrose pulmonaire idiopathique (FPI). Le test de marche de six minutes (TM6) est couramment utilisé mais il nécessite un environnement standardisé qui n’est pas toujours disponible en pratique courante. Ainsi, d’autres épreuves d’exercice ont été proposées et notamment diverses modalités de tests de levers de chaise.
Notre étude a pour objectif d’évaluer la reproductibilité de la performance (exprimée en termes de nombre total de levers) et les réponses physiologiques (Fréquence cardiaque, SpO2) et des symptômes (Borg Dyspnée et Fatigue) du test
de levers de chaise de 3 minutes (TLC3) chez 33 patients atteints deFPI recensés sur 3 centres.
La reproductibilité intra individuelle des variables du TLC3 a été comparée à celle du TM6 mais aussi à celle du test de levers de chaise de 1 minute (TLC1). Enfin, nous avons comparé la consommation maximale d’oxygène (VO2MAX) et la
réponse ventilatoire (VE, VT, FR) du TLC3 avec les valeurs obtenues au cours d’une épreuve d’exercice incrémentale sur cyclo-ergomètre (EFXi).
38
un coefficient de corrélation intra-classe (CIC) supérieur à 0,9. Les valeurs maximales de SpO2 et de FC étaient aussi reproductibles mais avec un CIC = 0,8
et CIC=0,7 respectivement.
La reproductibilité du TLC3 était comparable à celle du TM6. La consommation maximale d’oxygène (VO2max) au cours du TLC3 étaient bien corrélées à celles
obtenues lors d’une EFXi avec un CIC=0,86.
La robustesse de ces corrélations autorise d’estimer le VO2max des patients atteints
de FPI à partir de leur performance au cours du TLC3 avec une bonne précision avec un coefficient de corrélation R²=0,82.
La faisabilité et la reproductibilité du TLC3 autorisent à substituer cette modalité d’exercice à celle du TM6 chez les patients atteints de FPI. Il reste à évaluer si le déclin des réponses fonctionnelles au cours du TLC3 est parallèle ou plus précoce que celles obtenues au cours du TM6.
VU ET PERMIS D'IMPRIMER Grenoble, le 05/10/2018 :
LE DOYEN LE PRÉSIDENT DE LA THÈSE
Pr. Patrice MORAND Pr. Bernard AGUILANIU
39
Bibliography
1. Plantier L, Cazes A, Dinh-Xuan A-T, Bancal C, Marchand-Adam S, Crestani B. Physiology of the lung in idiopathic pulmonary fibrosis. Eur Respir Rev Off J Eur Respir Soc. 31 mars 2018;27(147).
2. Nalysnyk L, Cid-Ruzafa J, Rotella P, Esser D. Incidence and prevalence of idiopathic pulmonary fibrosis: review of the literature. Eur Respir Rev Off J Eur Respir Soc. 1 déc 2012;21(126):355‑61.
3. Sharif R. Overview of idiopathic pulmonary fibrosis (IPF) and evidence-based guidelines. Am J Manag Care. juill 2017;23(11 Suppl):S176‑82.
4. Onorati P, Antonucci R, Valli G, Berton E, De Marco F, Serra P, et al. Non-invasive evaluation of gas exchange during a shuttle walking test vs. a 6-min walking test to assess exercise tolerance in COPD patients. Eur J Appl Physiol. mai 2003;89(3‑4):331‑6.
5. du Bois RM. 6-minute walk distance as a predictor of outcome in idiopathic pulmonary fibrosis. Eur Respir J. juin 2014;43(6):1823‑4.
6. du Bois RM, Weycker D, Albera C, Bradford WZ, Costabel U, Kartashov A, et al. Six-minute-walk test in idiopathic pulmonary fibrosis: test validation and minimal clinically important difference. Am J Respir Crit Care Med. 1 mai 2011;183(9):1231‑7.
7. Lettieri CJ, Nathan SD, Browning RF, Barnett SD, Ahmad S, Shorr AF. The distance-saturation product predicts mortality in idiopathic pulmonary fibrosis. Respir Med. oct 2006;100(10):1734‑41.
8. du Bois RM, Albera C, Bradford WZ, Costabel U, Leff JA, Noble PW, et al. 6-Minute walk distance is an independent predictor of mortality in patients with idiopathic pulmonary fibrosis. Eur Respir J. mai 2014;43(5):1421‑9.
40
al. Validation of test performance characteristics and minimal clinically important difference of the 6-minute walk test in patients with idiopathic pulmonary fibrosis. Respir Med. juill 2015;109(7):914‑22.
10. Bennett D, Fossi A, Bargagli E, Refini RM, Pieroni M, Luzzi L, et al. Mortality on the Waiting List for Lung Transplantation in Patients with Idiopathic Pulmonary Fibrosis: A Single-Centre Experience. Lung. oct 2015;193(5):677‑81.
11. Lama VN, Flaherty KR, Toews GB, Colby TV, Travis WD, Long Q, et al. Prognostic value of desaturation during a 6-minute walk test in idiopathic interstitial pneumonia. Am J Respir Crit Care Med. 1 nov 2003;168(9):1084‑90.
12. Holland AE, Spruit MA, Troosters T, Puhan MA, Pepin V, Saey D, et al. An official European Respiratory Society/American Thoracic Society technical standard: field walking tests in chronic respiratory disease. Eur Respir J. déc 2014;44(6):1428‑46.
13. Morita AA, Bisca GW, Machado FVC, Hernandes NA, Pitta F, Probst VS. Best Protocol for the Sit-to-Stand Test in Subjects With COPD. Respir Care. 2018;63(8):1040‑9.
14. Ozalevli S, Ozden A, Itil O, Akkoclu A. Comparison of the Sit-to-Stand Test with 6 min walk test in patients with chronic obstructive pulmonary disease. Respir Med. févr 2007;101(2):286‑93.
15. Crook S, Büsching G, Schultz K, Lehbert N, Jelusic D, Keusch S, et al. A multicentre validation of the 1-min sit-to-stand test in patients with COPD. Eur Respir J. 2017;49(3).
16. Vaidya T, de Bisschop C, Beaumont M, Ouksel H, Jean V, Dessables F, et al. Is the 1-minute sit-to-stand test a good tool for the evaluation of the impact of pulmonary rehabilitation? Determination of the minimal important difference in COPD. Int J Chron Obstruct Pulmon Dis. 2016;11:2609‑16.
41
functional performance tests and mortality in COPD. Eur Respir J. oct 2013;42(4):956‑63.
18. Canuto FF, Rocco CC de M, de Andrade DV, Sampaio LMM, Oliveira CS, Corrêa FI, et al. Neurophysiological comparison between the Sit-to-Stand test with the 6-Minute Walk test in individuals with COPD. Electromyogr Clin Neurophysiol. févr 2010;50(1):47‑53.
19. Crook S, Frei A, Ter Riet G, Puhan MA. Prediction of long-term clinical outcomes using simple functional exercise performance tests in patients with COPD: a 5-year prospective cohort study. Respir Res. 02 2017;18(1):112.
20. Briand J, Behal H, Chenivesse C, Wémeau-Stervinou L, Wallaert B. The 1-minute sit-to-stand test to detect exercise-induced oxygen desaturation in patients with interstitial lung disease. Ther Adv Respir Dis. déc 2018;12:1753466618793028.
21. Gruet M, Peyré-Tartaruga LA, Mely L, Vallier J-M. The 1-Minute Sit-to-Stand Test in Adults With Cystic Fibrosis: Correlations With Cardiopulmonary Exercise Test, 6-Minute Walk Test, and Quadriceps Strength. Respir Care. déc 2016;61(12):1620‑8.
22. Aguilaniu B, Roth H, Gonzalez-Bermejo J, Jondot M, Maitre J, Denis F, et al. A simple semipaced 3-minute chair rise test for routine exercise tolerance testing in COPD. Int J Chron Obstruct Pulmon Dis. 2014;9:1009‑19.
23. Raghu G, Collard HR, Egan JJ, Martinez FJ, Behr J, Brown KK, et al. An official ATS/ERS/JRS/ALAT statement: idiopathic pulmonary fibrosis: evidence-based guidelines for diagnosis and management. Am J Respir Crit Care Med. 15 mars 2011;183(6):788‑824.
24. Pellegrino R, Viegi G, Brusasco V, Crapo RO, Burgos F, Casaburi R, et al. Interpretative strategies for lung function tests. Eur Respir J. nov 2005;26(5):948‑68.
42
25. Standardized lung function testing. Official statement of the European Respiratory Society. Eur Respir J Suppl. mars 1993;16:1‑100.
26. Bunc V, Dlouhá R. Energy cost of treadmill walking. J Sports Med Phys Fitness. juin 1997;37(2):103‑9.
27. Palange P, Forte S, Onorati P, Manfredi F, Serra P, Carlone S. Ventilatory and metabolic adaptations to walking and cycling in patients with COPD. J Appl Physiol Bethesda Md 1985. mai 2000;88(5):1715‑20.
28. Poulain M, Durand F, Palomba B, Ceugniet F, Desplan J, Varray A, et al. 6-minute walk testing is more sensitive than maximal incremental cycle testing for detecting oxygen desaturation in patients with COPD. Chest. mai 2003;123(5):1401‑7.
29. Holland AE, Dowman L, Fiore J, Brazzale D, Hill CJ, McDonald CF. Cardiorespiratory responses to 6-minute walk test in interstitial lung disease: not always a submaximal test. BMC Pulm Med. 11 août 2014; 14:136.
30. Radtke T, Hebestreit H, Puhan MA, Kriemler S. The 1-min sit-to-stand test in cystic fibrosis - Insights into cardiorespiratory responses. J Cyst Fibros Off J Eur Cyst Fibros Soc. nov 2017;16(6):744‑51.
43
Annexes
Echelle de Borg (Fatigue et Dyspnée) ... 44
Echelle MRC ... 45
Questionnaire DIRECT ... 46
Questionnaire CAT ... 48
Questionnaire HAD... 49
44
Echelle de Borg (Fatigue et Dyspnée)
45
Echelle MRC
46
Questionnaire DIRECT
48
Questionnaire CAT
49
Questionnaire HAD
50
Questionnaire respiratoire de Saint Georges
ST. GEORGE’S RESPIRATORY QUESTIONNAIRE
VERSION FRANCAISE
QUESTIONNAIRE SUR LES TROUBLES RESPIRATOIRES – HOPITAL ST GEORGES (SGRQ)
Ce questionnaire est destiné à nous aider à mieux comprendre dans quelle mesure vos troubles respiratoires vous incommodent et affectent votre vie. Nous pourrons ainsi savoir
quels aspects de votre maladie vous posent le plus de problèmes, plutôt que de nous fier à l'impression des médecins ou des infirmières.
Veuillez lire attentivement les instructions et poser des questions si vous ne comprenez pas quelque chose. Ne perdez pas trop de temps à réfléchir à vos réponses.
Veuillez remplir avant de faire le reste du questionnaire :
Comment décrivez-vous votre santé à l’heure actuelle : Très bonne
Bonne
Passable
Mauvaise
Très mauvais e
51
Questionnaire sur les troubles respiratoires – Hôpital St Georges
1re PARTIELes questions qui suivent visent à déterminer la fréquence de vos troubles respiratoires au cours des 4 dernières semaines.
Pour chaque question, cochez (✓) une seule case :
La plupart des jours de la semaine Plusieurs jours par semaine Quel-ques jours par mois Seulement pendant les infections respiratoires Pas du tout
1. Au cours des 4 dernières semaines, j'ai toussé :
2. Au cours des 4 dernières semaines, j'ai crachédu mucus :
3. Au cours des 4 dernières semaines, j'ai été
essoufflé(e) :
4. Au cours des 4 dernières semaines, j’ai eu des
crises de respiration sifflante :
5. Au cours des 4 dernières semaines, combien de fois vos troubles respiratoires ont-ils provoqué des crises graves ou très désagréables?
Cochez (✓) une seule case : Plus de 3 fois
3 fois
2 fois
1 fois
Pas une seule fois
6. Au cours des 4 dernières semaines, combien de temps la crise la plus grave a-t-elle duré?(Passez à la question 7 si vous n'avez pas eu de crises graves)
Cochez (✓) une seule case : Une semaine ou plus
3 jours ou plus
1 ou 2 jours
Moins d’un jour
7. Au cours des 4 dernières semaines, combien avez-vous eu de bonnes journées(avec peu de troubles respiratoires) dans une semaine ordinaire?
Cochez (✓) une seule case : Aucune bonne journée
1 ou 2 bonnes journées
3 ou 4 bonnes journées
Presque toutes les journées ont été bonnes
Toutes les journées ont été bonnes
8. Si vous avez la respiration sifflante, est-ce pire le matin au réveil?Cochez (✓) une seule case : Non
52
Questionnaire sur les troubles respiratoires – Hôpital St Georges
2e PARTIESection 1
Comment décrivez-vous vos troubles respiratoires?
Cochez (✓) une seule case : Ils constituent mon problème le plus important
Ils me causent beaucoup de problèmes
Ils me posent quelques problèmes
Ils ne me posent aucun problème
Si vous avez déjà occupé un emploi :Cochez (✓) une seule case : Mes troubles respiratoires m’ont obligé(e) à arrêter complètement de travailler
Mes troubles respiratoires ont affecté mon travail ou m’ont obligé(e) à changer de travail
Mes troubles respiratoires n’ont pas affecté mon travail
Section 2Les questions suivantes concernent les activités qui vous essoufflent habituellement ces jours-ci.
Cochez (✓) chaque case qui s'applique à vous ces jours-ci :
Vrai Faux Être assis(e) ou allongé(e) sans bouger
Faire sa toilette ou s'habiller
Se déplacer dans la maison
Marcher à l'extérieur sur un terrain plat
Monter un escalier
Monter une côte
Faire du sport ou des activités de plein air
53
Questionnaire sur les troubles respiratoires – Hôpital St Georges
2e PARTIESection 3
Voici quelques questions supplémentaires concernant votre toux et votre essoufflement ces jours-ci.
Cochez (✓) chaque case qui s'applique à vous ces jours-ci :
Vrai Faux Ma toux me fait mal
Ma toux me fatigue
Je suis essoufflé(e) quand je parle
Je suis essoufflé(e) quand je me penche
Ma toux ou ma respiration dérange mon sommeil
Je m'épuise facilement
Section 4Les questions suivantes concernent d'autres effets que vos troubles respiratoires pourraient avoir sur vous ces jours-ci.
Cochez (✓) chaque case qui s'applique à vous ces jours-ci :
Vrai Faux Ma toux ou ma respiration me gêne quand je suis avec d'autres personnes
Mes troubles respiratoires dérangent ma famille, mes amis ou mes voisins
Je prends peur ou je panique lorsque je ne peux pas reprendre mon souffle
Je sens que je n’ai pas le contrôle sur mes troubles respiratoires
Je ne m'attends pas à ce que mon état respiratoire s'améliore
Je suis devenu(e) fragile ou handicapé(e) à cause de mes troubles respiratoires
L'exercice physique présente des risques pour moi
Tout semble exiger trop d'effort
Section 5Les questions suivantes concernent votre médication. Si vous ne prenez pas de médicaments pour votre état respiratoire, passez directement à la section 6.
Cochez (✓) chaque case qui s'applique à vous ces jours-ci :
Vrai Faux Ma médication ne m'aide pas beaucoup
Cela me gêne de prendre ma médication lorsqueje suis avec d'autres personnes
Ma médication me cause des effets secondaires désagréables
Ma médication dérange beaucoup ma vie
54
Questionnaire sur les troubles respiratoires – Hôpital St Georges
2e PARTIESection 6
Les questions suivantes visent à savoir dans quelle mesure vos activités pourraient être affectées par votre état respiratoire.
Cochez (✓) chaque case selon ce qui s'applique à vous à cause de
votre état respiratoire :
Vrai Faux J'ai besoin de beaucoup de temps pour faire ma toilette ou pour m'habiller
J’ai besoin de beaucoup de temps pour prendre un bain ou une douche
et parfois, je n’arrive pas à le faire
Je marche plus lentement que les autres ou je m'arrête pour me reposer
Des travaux comme le ménage me prennent beaucoup de temps
ou je dois m'arrêter pour me reposer
Si je monte un escalier, je dois aller lentement ou m'arrêter
Si je me dépêche ou marche rapidement, je dois m'arrêter ou ralentir
À cause de mon état respiratoire, j’ai de la difficulté à monter des côtes,porter des objets à l’étage supérieur, faire des petits travaux de jardinage
(p. ex. enlever les mauvaises herbes), danser, jouer aux quilles ou jouer au golf
À cause de mon état respiratoire, j’ai de la difficulté à porter des chargeslourdes, bêcher le jardin ou pelleter la neige, faire du jogging ou marcher
rapidement (5 milles/8 km à l'heure), jouer au tennis ou nager
À cause de mon état respiratoire, j’ai de la difficulté à faire des travaux manuelslourds, courir, faire du vélo, nager rapidement ou pratiquer des sports intensifs
Section 7
Nous voudrions savoir de quelle manière vos troubles respiratoires affectent habituellement votre vie de tous les jours.
Cochez (✓) chaque case selon ce qui s'applique à vous à cause de vos
troubles respiratoires :
Vrai Faux Je ne peux pas faire du sport ou des activités de plein air
Je ne peux pas aller au spectacle ou sortir pour mes loisirs
Je ne peux pas sortir de la maison pour faire des courses
Je ne peux pas faire le ménage
Je ne peux pas m'éloigner de mon lit ou de ma chaise
55
Questionnaire sur les troubles respiratoires – Hôpital St Georges
Vous trouverez ci-dessous une liste d'autres activités que vos troubles respiratoires peuvent vous empêcher de faire. (Vous ne devez pas les cocher, elles ne sont là que pour vous rappeler dans quelles situations votre essoufflement peut vous affecter) :
Se promener ou promener le chien
Faire des activités chez soi ou dans le jardin Avoir des relations sexuelles
Aller à l'église ou au spectacle
Sortir quand il fait mauvais ou aller dans des locaux enfumés Rendre visite à la famille ou à des amis ou jouer avec des enfants
Veuillez indiquer ci-dessous toute autre activité importante que vos troubles respiratoires peuvent vous empêcher de faire :
. . . . . . . . . . . .
Maintenant pourriez-vous cocher la case correspondant à ce qui décrit le mieux selon vous la manière dont vos troubles respiratoires vous affectent (ne cochez qu'une seule case) :
Mes troubles respiratoires ne m’empêchent pas de faire ce que je veux
Mes troubles respiratoires m’empêchent de réaliser une ou deux choses que je voudrais faire
Mes troubles respiratoires m’empêchent de réaliser la plupart des choses que je voudrais faire
Mes troubles respiratoires m'empêchent de faire tout ce que je voudrais faire
Merci d’avoir rempli ce questionnaire. Avant de le retourner, veuillez vérifier si vous avez répondu à toutes les questions.