Science Arts & Métiers (SAM)
is an open access repository that collects the work of Arts et Métiers Institute of Technology researchers and makes it freely available over the web where possible.
This is an author-deposited version published in: https://sam.ensam.eu Handle ID: .http://hdl.handle.net/10985/17888
To cite this version :
Benoît BESSEAU, Guillaume POT, Robert COLLET, Joffrey VIGUIER - Measurement of fiber orientation by laser light scattering on dry and rough sawn green hardwoods - In: 21st
International Nondestructive Testing and Evaluation of Wood Symposium, Allemagne, 2019-09-25 - 21st International Nondestructive Testing and Evaluation of Wood Symposium - 2019
Any correspondence concerning this service should be sent to the repository Administrator : archiveouverte@ensam.eu
Measurement of fiber orientation by laser light
scattering on dry and rough sawn green hardwoods
Benoît BesseauLaBoMaP, ENSAM, Cluny, France, benoit.besseau@ensam.eu
Guillaume Pot
LaBoMaP, ENSAM, Cluny, France, guillaume.pot@ensam.eu
Robert Collet
LaBoMaP, ENSAM, Cluny, France, robert.collet@ensam.eu
Joffrey Viguier
LaBoMaP, ENSAM, Cluny, France, joffrey.viguier@ensam.eu
Abstract
Scanner measurements allow knot detection and machine strength grading on sawn timber, which answers the construction and sawmilling industry needs at high production rates. In particular, laser scanners measure fiber orientation by means of the so-called tracheid effect on wood surface where elliptically scattered laser light can be observed.
Many studies showed that a red laser scanner is very effective on softwood species like spruce but ineffective on many hardwood species like oak. However, the LaBoMaP has recently developed a fiber orientation scanner, utilizing another kind of laser, effective on hardwood species, including oak. Other studies showed that measurement quality is better on sanded and planed wood than on rough sawn timber. Besides, the influence of moisture content on tracheid effect is also known. In practice, ellipse are bigger on green wood than on dry wood.
In the present work, a method is proposed to measure the intensity of tracheid effect on freshly sawn hardwoods, according to the species, and the error of the fiber orientation measurement is also assessed. To achieve this, clear green wood test pieces were first scanned at 0° orientation and ellipse geometrical parameters were compared to what is obtained on an isotropic surface (HDF). In a second time, test pieces were scanned at different orientations from 0° to 90°. Measurement error was defined as the difference of scanned fiber angle mean on each iteration and test piece orientation between these same iterations.
Comparisons of results between species and moisture content will be presented at the conference.
Keywords: Fiber orientation, hardwood, tracheid effect, laser, green wood.
Introduction
Scanner measurements allow knot detection and machine strength grading on sawn timber, which answers the construction and sawmilling industry needs at high production rates. In particular, laser scanners measure fiber orientation by means of the so-called tracheid effect explained by the fact that the wood fibers conduct concentrated light better in the direction of fibers than across. Schlotzhauer et al. (2018) showed that a red laser scanner (660 nm, 100 mW) is very effective on softwood species like spruce but
ineffective on some hardwood species like oak. However, after the work of Daval et al. (2015), the LaBoMaP has developed a fiber orientation scanner effective on hardwood species, including oak (Olsson et al. 2018). It is, to the best of authors’ knowledge, the first to use a laser wavelength of 1064 nm and a modulable power (up to 1 W).
Mechanical properties of sawn timber are well in correlation with local fiber orientation (Jehl et al. 2011, Viguier et al. 2015) and assessing the measurement error of fiber orientation is important for strength grading purposes. Hu et al. (2004) did this work for sugi and Japanese beech species. To the best of authors’ knowledge, there is no such study focusing on European species such as oak, beech, Douglas fir, spruce, etc. Furthermore, Hu et al. (2004) and other similar studies focused only on the angle
measurement but did not discuss the intensity of the tracheid effect, nor study the influence of laser power.
In the present work, the behavior of the light scattering effect is studied according to the species and the orthotropic plane (longitudinal-radial (LR) or longitudinal-tangential (LT)). Rough sawn green oak and planed dry oak are also compared because it meets industrial needs. Moreover, a method to assess the measurement error of fiber orientation is proposed.
Materials and methods
Samples
For this work, four wood species have been studied at “dry” (12% moisture content) state: Sweet Chestnut (Castanea), Douglas fir (Pseudotsuga menziesii), Poplar (Populus) and Oak (Quercus petraea and Quercus robur L). Oak have also been studied just after sawing and will be called green oak (with a moisture content above fiber saturation point and a rough sawn surface).
From each of these five cases, 10 test pieces (100 x 100 x 20 mm3) coming from 2 orthotropic planes
have been chosen: 5 samples from longitudinal-radial plane (named Quarter sawn in this paper) and 5 from longitudinal-tangential plane (named Flat sawn in this paper). Every sample was made of clear wood, free from knots. Dry sample surfaces were planed to have low surface roughness. Green oak sample surfaces were rough sawn.
In addition, a sample in High Density Fiberboard (HDF) was chosen for its isotropic properties and to compare with solid wood samples.
Scanner
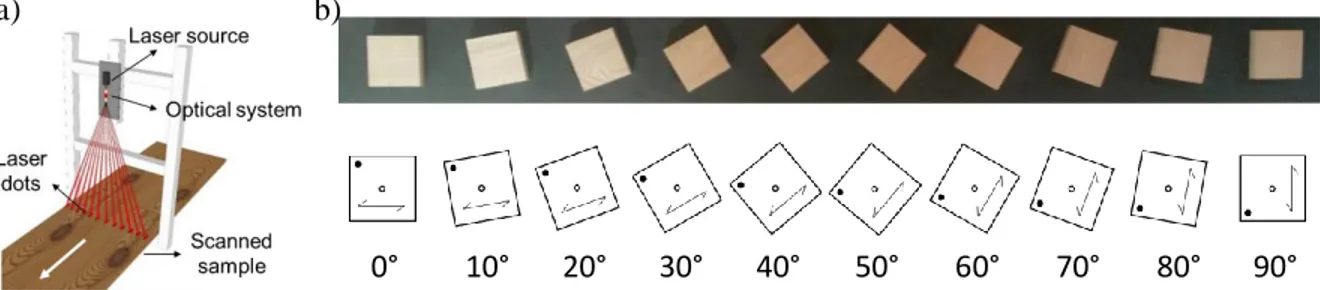
The fiber orientation scanner (BobiScan) used was developed in Cluny (France) . This is a laboratory scanner by which researchers were able to perform a fine-tuning of the laser, optics, and image processing. The principle is based on the so-called tracheid effect. The wavelength of the laser was 1064 nm, and its power was approximately 100 mW. The laser was divided in 24 dots by an optical system to have 10 mm space between dots (Figure 1-a). But when fibers are oriented near 90°, light spots can overlap if their length exceeds the distance between 2 lasers dots (10 mm). A near infrared camera (Basler acA2000-340kmNIR) was used to record the laser light scattering, and a software was developed to record the individual position of each laser dot while the board was longitudinally moving on a conveyor below the system, resulting in a resolution of 1 mm in the direction along the board.
Samples were placed on a board support allowing to orient samples from 0° to 90° by 10° step (Figure 1-b). A central guide pin allowed to scan each test piece at the same transversal position. This board was placed on the scanner conveyor.
Figure 1: a) Diagram of laser scanner principle: an optical system divide the laser beam in many beams.
b) Visualization of sample orientations on their support Methods
On the wood surface, laser dots were transformed in quasi-elliptically shaped light spots which were binarized (Figure 2-a). The contour of the binarized image was used to fit the mathematical function of an ellipse (Figure 2-b). From each ellipse, 3 parameters have been analyzed (Figure 2-c). Firstly, the ellipse area, secondly, the ratio between the major and the minor axis of the ellipse, and thirdly the angle between the major axis and the scan direction, which gave the fiber orientation on the sample surface when board direction coincides with the scan direction.
Figure 2: a) raw image of light scattering for one laser dot on wood surface
b) Binarization and fitted ellipse
c) Drawing representing the main ellipse parameters: area, ratio, angle Ratios and areas analysis
The first part of this study deals with the assessment of the light scattering effect by the analysis of the ellipse area and axis ratio and the comparison between species. To do that, test pieces have been scanned at a sample orientation of 0°. To compare global and local phenomena, results were analyzed with some statistical methods.
Assessment of angle measurement error
To assess fiber orientation measurement error, test pieces have been scanned at 10 orientations 𝜃𝑖 (with i
equals 0°, 10°, 20°, … 90°). Each scans were repeated 5 times. All ellipse angles were first measured according to the sample longitudinal edge, then according to the scan direction to take into account sample rotations.
The comparison between the 5 repetitions has allowed to determine the measurement repeatability. 0° 10° 20° 30° 40° 50° 60° 70° 80° 90° a) b)
The measurement error 𝛿𝑖 for each test piece at each orientation 𝜃𝑖 was defined as the difference between
the measured fiber orientation 𝑦𝑖 and the real value expected as follows:
𝛿𝑖 = 𝑦𝑖− (𝑦0+ 𝜙𝑖) (1)
Where 𝑦𝑖 is the mean of measured ellipse angles at a sample orientation of 𝜃𝑖; 𝑦0 the mean of measured
ellipse angles at 0° and considered as the reference value; 𝜙𝑖 the real sample orientation at 𝜃𝑖 measured
numerically in the camera coordinate system.
Results
Areas
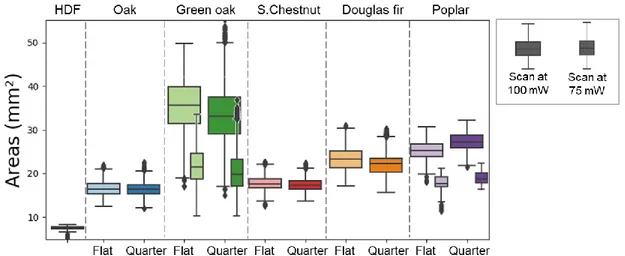
Area results are sorted in boxplots (Figure 3) by species and orthotropic plane. Compared to other species, light spots on HDF are very small. It is 5 times smaller than green oak ellipse areas, which are almost twice bigger than other species. The impact of high moisture content on light scattering effect is considerable: ellipse areas are two times larger on fresh oak than on dry oak. Species have also a
significant influence: ellipses areas are bigger on species graded as softwood (poplar, Douglas fir) than on hardwood (oak, chestnut).
Laser power have also an influence on the light spot size. For green oak and poplar, many ellipse major axis exceeded 10 mm, which is the distance between 2 laser dots. To prevent ellipse overlaps, especially for angle analysis at sample orientations near 90°, further measurement with a lower laser power were mandatory. Thus, for the following angle analysis, a lower laser power (~75 mW) have been chosen to scan green oak and poplar. As shown on Figure 3, lower laser power induces much smaller ellipse areas.
Figure 3: boxplots (horizontal lines represent median, first and third percentile, range, black dots are outliers)
of light spot areas sorted by species and orthotropic plane.
Wide boxplots are for laser source power of 100 mW while narrow boxplots are for laser source power of 75 mW Ratios
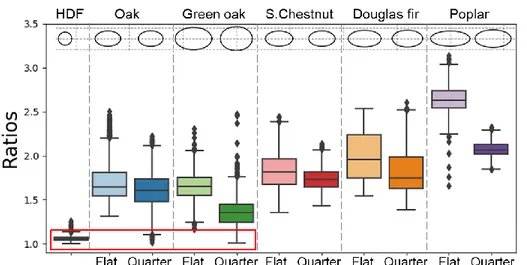
Figure 4 shows a boxplot of ellipse ratios for the different species and orthotropic planes. In addition, the mean ellipse shapes are drawn above it. Ratio analysis enables to describe ellipse geometry and shows if light spots are more circular or elliptic. The more light spots are circular, the more fiber orientation measurement will be difficult. On HDF, light spots are almost circular (maximum ratio near 1.2), which
means light was not scattering in specific direction and confirm that HDF have an isotropic behavior regarding light scattering. All tested wood samples show most of their ratio values higher than what is observed on HDF, but quarter sawn dry oak and green oak have their lower values below 1.2. The differences of behavior between species are also significant with, for instance, narrow and long ellipses on poplar, while on oak shorter ellipses with the same width as poplar. For all species, ratios are smaller on quarter sawn, which is due to the fact that, on average, ellipse minor axis are bigger on quarter sawn than on flat sawn samples.
Figure 4: Boxplots of ellipse ratios sorted by species and orthotropic plane at a laser source power of 100 mW.
Shorter ratios (<1.2) are located in red rectangle. Repeatability
Figure 5 represents distribution diagrams for the 50 scans of one sample: 5 scans at the 10 tested orientations. For this sample, the standard deviation of measured angles is around 2°. The standard deviation of measured angles for all species is between 1° and 18°. Indeed, even if samples are clear wood, there are still variations of fiber orientation, which explains these angle dispersions. The 5 scans per sample orientation are superposed, which shows that the measurements with the BobiScan are repeatable. This repeatability is verified for every sample orientations.
Figure 5: Oak angle distribution diagrams depending on sample orientation.
50 diagrams are shown: 5 diagrams are superposed for each of the 10 sample orientations.
P robabi li ty Angle (°) Sample position (°) 0° 10° 20° 30° 40° 50° 60° 70° 80° 90°
Assessment of angle measurement error
The Figure 6 shows the mean measurement error for every species and orthotropic plane. Except for poplar, measurement error is lower for flat sawn than quarter sawn. Measurement error is bigger on green and dry oak than other species (< 1.5°), especially on oak quarter sawn (until 4°). On Douglas fir and poplar, measurement error is less than 1°.
Figure 6: Results of measurement error sorted by species and orthotropic plane.
Discussions
Ellipse areas and ratios
The great variability of Douglas fir ratios comes from the difference between early wood (pale areas on Figure 7-a and blue-green areas on Figure 7-b) and late wood (dark areas on Figure 7-a and orange areas on Figure 7-b): ratios are bigger on late wood than early wood. However, there is no influence on angle measurement: all measured angles are around 0° (pale green color on Figure 7-c) without great variations. On flat sawn Douglas fir samples, this phenomenon is more pronounced due to larger areas of late wood where ellipse can stretch more easily than on fine line of late wood on quarter sawn samples (Figure 7-d).
Figure 7: a) Flat sawn Douglas fir sample. b) Map of ellipse ratio measurement for the same Douglas fir sample.
Difference between early wood and late wood is visible on ratio map. c) Map of ellipse angle measurement for the same Douglas fir sample. d) Quarter sawn Douglas fir sample.
To explain that for all species ratios are smaller on quarter sawn than on flat sawn, a hypothesis would be the presence of parenchyma cells perpendicular to the fiber direction, also named medullary rays, which would generate more light scattering in the radial direction. This difference is very distinct for poplar and oak. 0,0 0,5 1,0 1,5 2,0 2,5 3,0 3,5 4,0 4,5
flat quarter flat quarter flat quarter flat quarter flat quarter
Oak Fresh Oak S.Chestnut Douglas Fir Poplar
Er ro r (° ) a) b) c) d)
On quarter sawn dry oak green oak, there are some ratios similar to HDF ratios, so almost circular light spots (below 1.2). Oak have the particularity that medullary rays are large in longitudinal direction and also very thick (pale spots on Figure 8-a). Quarter sawn oak ratio map on Figure 8-b shows that ellipses located in these rays present the lower ratios (dark blue areas on ratio map). The fiber orientation
measurement is impacted by that: the angle map on Figure 8-c shows great angle deviations in the thicker medullary rays (dark blue and dark red areas). Thus, the fiber deviations measured by the scanner are not fiber orientation but parenchyma orientation or a mix between fiber and parenchyma orientation.
Figure 8: a) Quarter sawn oak sample. b) Map of ellipse ratio measurement for the same oak sample. c) Map of
ellipse angle measurement for the same oak sample. Medullary rays are visible in dark blue on ratio and angle maps. Assessment of measurement error
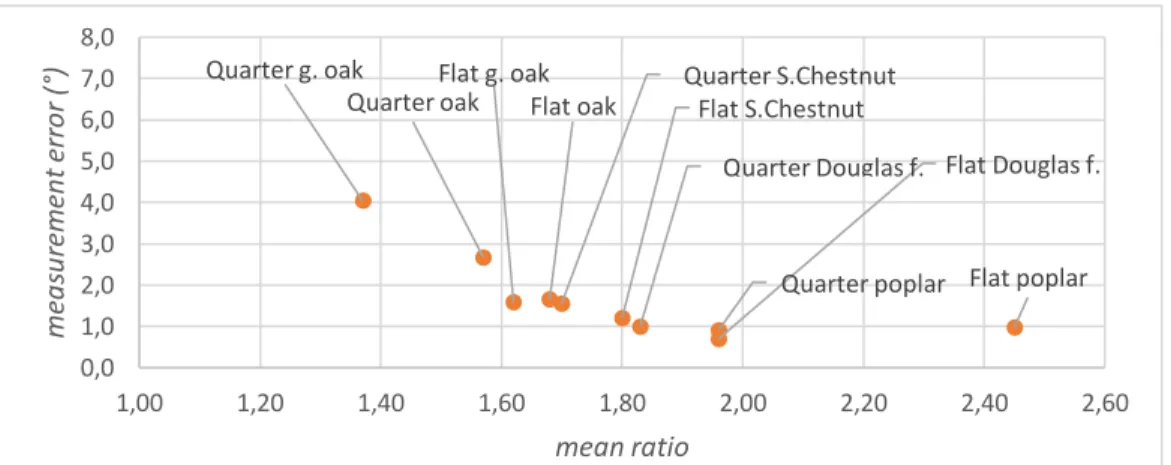
The previous results and discussions suggest that there is a correlation between ellipse ratios and the measurement error. Figure 9 represents this correlation for each species and orthotropic plane: the error is indeed lower when ellipses have bigger ratios. This seems to be explained by a combination of parameters which influence the scattering effect: moisture content and radial parenchyma, even if these explanations needs to be confirmed because it relies mainly on oak results.
Figure 9: Measurement error depending of ellipse mean ratio.
Each point represent a species and an orthotropic plane.
In a general manner, apart from quarter sawn oak for which results are negated by the presence of medullary rays, the error is below 2°. This is satisfactory in the frame of strength grading and/or knot detection. In the measurement error calculation, the error coming from the test protocol is deleted by the measurement of the actual sample orientation 𝜙𝑖. One source of error could be the fact that lasers dots,
that are distant of 10 mm, have not scanned exactly the same wood fibers because of the rotation of sample from 0° to 90°. Moreover, laser dots are not perfectly round and it may have an influence on the scattering effect.
Flat oak
Quarter oakFlat g. oak
Quarter g. oak Flat S.Chestnut Quarter S.Chestnut Flat Douglas f. Quarter Douglas f. Flat poplar Quarter poplar 0,0 1,0 2,0 3,0 4,0 5,0 6,0 7,0 8,0 1,00 1,20 1,40 1,60 1,80 2,00 2,20 2,40 2,60 m ea su rem en t er ro r (° ) mean ratio a) b) c)
Conclusion
This study about the fiber orientation measurement by laser light scattering shows that this technology works on some European hardwoods and softwoods, including dry oak and rough sawn green oak. Moreover, measurements are repeatable, which show that the used scanner is reliable. The kind of species and the considered orthotropic plane influence the light scattering effect, which is visible by the study of light spot shape. Indeed, the ellipse axis ratio have an effect on the measurement error which is lower for bigger ellipse axis ratio. On clear wood, the measurement error is between 0.5° and 1.5°, which is quite low, and can reach 4° on quarter sawn oak when medullary rays are well visible. On these rays, the light spot is more circular and deviate from the main direction of fibers which is the measurement purpose. Therefore, in medullary rays, scanner does not measure the fiber orientation but parenchyma orientation or a mix between fiber and parenchyma orientation
Some perspectives of this study are to scan and study other species like beech which could confirm observation about the influence of medullary rays and moisture content on fiber orientation measurement. A work about the distinction between medullary rays and knots have to be done in order to do strength grading or knot purge.
Acknowledgments
The authors thank the regional council of Bourgogne Franche-Comté, Ducerf Groupe and the Association Nationale Recherche Technologie (ANRT) (CIFRE N°2018/0987)
References
Daval et al. 2015. « Automatic measurement of wood fiber orientation and knot detection using an optical system based on heating conduction ». Optics express 23 (26): 33529–33539.
Hu et al. 2004. « On-Line Determination of the Grain Angle Using Ellipse Analysis of the Laser Light Scattering Pattern Image ». Journal of Wood Science 50 (4): 321‑26.
Jehl et al. 2011, Contribution of slope of grain information in lumber strength grading, 17th International Nondestructive Testing and evaluation of wood symposium, Sopron, Hungary.
Olsson et al. 2018. « Performance of Strength Grading Methods Based on Fibre Orientation and Axial Resonance Frequency Applied to Norway Spruce (Picea Abies L.), Douglas Fir (Pseudotsuga Menziesii (Mirb.) Franco) and European Oak (Quercus Petraea (Matt.) Liebl./Quercus Robur L.) ». Annals of Forest Science 75 (4).
Schlotzhauer et al. 2018: “Comparison of three systems for automatic grain angle determination on European hardwood for construction use”. European Journal of Wood and Wood Products, 76, 911-923.
Viguier et al. 2015, « Improving strength grading of timber by grain angle measurement and mechanical modeling ». Wood Material Science & Engineering 10 (1): 145–156.