Methods for staistical inference on correlated data : application to genomic data
Texte intégral
Figure


Documents relatifs
Tabular GAN (TGAN) (Xu & Veeramachaneni, 2018) presented a method to generate data composed by numerical and categorical variables, where the generator outputs variable values in
In those studies, hippocampal tissue (gray + white) volume, parahip- pocampal cortical volume, and total cerebral cortical volume have all been shown to be smaller in the
Results are presented for the Gaussian graphical model on log-transformed data (blue), the log-linear Poisson graphical model on power-transformed data (red) and the
We compared the three canonical methods (CCA-EN, CIA and sPLS) for their ability to highlight the relationships between two gene expression data sets both obtained on a panel of 60
In addition, the Valence Laterality interaction was qualified by a Valence LateralityTask interaction, which indicated that the Valence Laterality interaction was larger for
The model choice proce- dure is efficient if the TPR is close to 1 for both following cases: when the data sets are simulated under a constant population size (avoiding overfitting
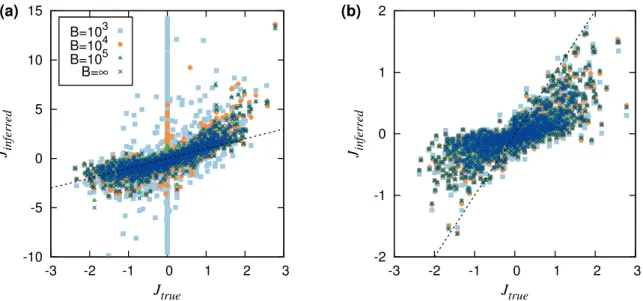
10 in the main text shows a mild computational gain as a function of the color compression when inferring a sparse interaction network (large-threshold minima). Such gain is
3.3 Illustration of the interest on complete DiOGenes data Finally, two networks (one for CID1 and one for CID2) were inferred using all individuals from RNA-seq datasets for
