Student: Guillaume Despagne Tutor: Evren Ors
The determinants of US regional banks failures during the subprime crisis
HEC Paris
Student: Guillaume Despagne
The determinants of US regional banks failures during the subprime crisis
Abstract: The aim of this thesis is to determine and analyze the causes of US regional bank failures during the subprime crisis. In order to get a better understanding of the crisis and its impact on US banks, we first present the evolutions that have radically changed the US banking landscape over the past few decades and lead to the worst banking and economic crisis since the Great Depression. We then perform a mean difference analysis to compare the characteristics of failed banks and safe banks, which did not fail. We find significant differences on most of our variables and can clearly identify a profile of failed banks. We build a dynamic logistic model to assess the determinants of bank failures during the crisis. Despite the rise of new financial technologies and of a universal banking business model strongly connected to financial markets, which mostly impacted the largest banks, our findings show that failed small banks have been the victims of a credit bubble linked to real estate.
1)
Introduction
The subprime crisis, which has been widely considered as the worst banking and economic crisis since the Great Depression in the 1930s, has created the opportunity to revive the analysis of bank failures and develop new failure prediction models. Indeed, recent research on bank failures is based on past periods: the 1980s and the beginning of the 1990s for Cole and Wu (2009), from the mid-1980s to the mid-1990s for Wheelock and Wilson (2000), the first part of the 1990s for Curry Elmel and Fissel (2004). Most of the failure prediction models built are thus based on the bankruptcies which occurred at the time of the Savings and Loans crisis or in the couple of year after. To our knowledge, the only study that looked at bank failures after the end of the long deregulation process opened at the end of the 1970s, is King, Nuxoll and Yeager (2006). They find that the dramatic regulatory financial and technological changes which have happened in the banking system have modified causes of bank failures, based on the comparison of failed banks over 1984-1994 and 1995-2003. They also underline that despite the development of new dynamic statistic models, the research into bank financial distress and failures has slowed.
Even though the number of failures remains high after a peak in 2009, which shows that bank failures caused by the subprime crisis are not over, we think it is time to look at the determinants of the failure of US banks which have already failed.
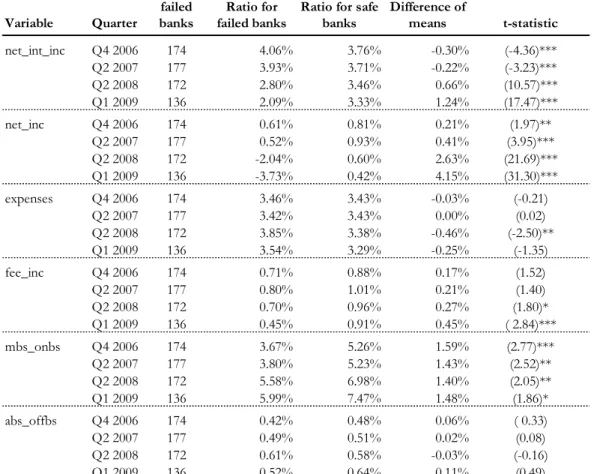
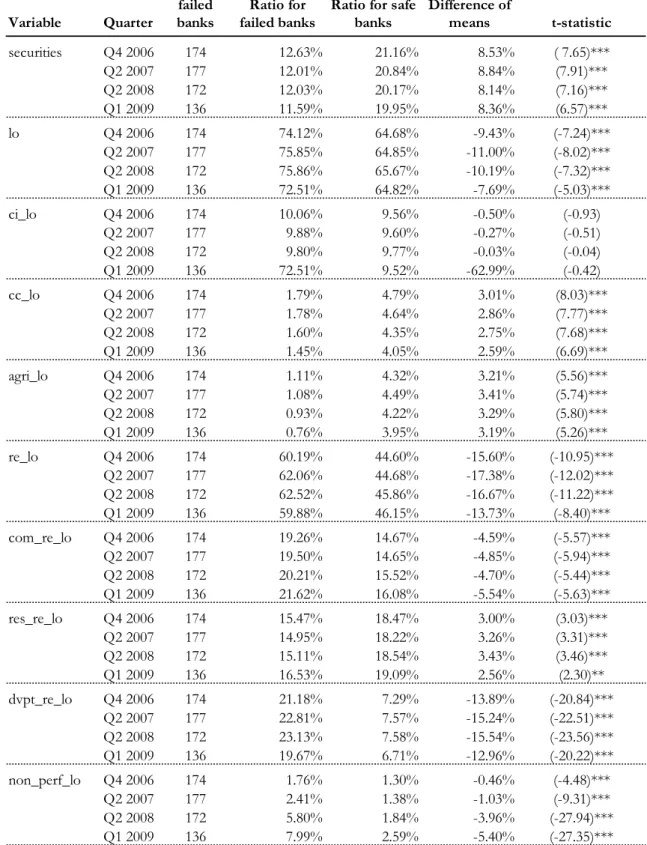
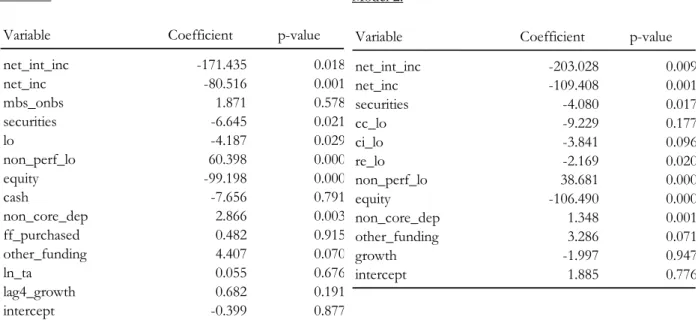
We decided to perform a classical mean difference test on several variable to determine whether failed banks have been differing from safe banks and consequently determine meaningful inputs to a dynamic logistic model very similar to the one first introduced by Shumway (2001) for corporate failure prediction, which has then been tested by Cole and Wu (2009) for bank failure prediction. However, contrary to them we do not include macro-economic data which is an interesting possibility offered by dynamic models. Moreover we rely exclusively on bank accounting data, as using market data would have dramatically reduced our bank sample1. Both Shumway (2001) and Cole and Wu (2009) develop mathematical arguments proving the superiority of dynamic logistic models using data panels on logit or probit, one-period models which only rely on cross-sectional data. First, this comes from the fact that dynamic models use much more observations which improves the accuracy of estimates and coefficients. Second, dynamic models allow to capture how long a bank is at risk of failure, whereas this is not taken into account by one-period models which produces biased and inconsistent estimates.
As the crisis revealed the depth of the changes caused by deregulation, financial innovation and technological progress to the US banking and financial system, we devote the next section to a
1 Curry, Elmer and Fissel (2004) report that at the end of 2008 only 400 banks were listed on a total number of banks close to 8,000.
description and analysis of the evolution of the US banking system based on a review of literature. The third section presents our data, the treatment we made and the variables we will use in the comparison of failed and safe banks. The fourth section presents the results of the comparison of failed and safe banks on 25 criteria and builds a profile of failed banks. The fifth section presents the results of our dynamic logistic regression and the extent to which it verifies our hypotheses on the determinants of bank failures during the crisis. Finally the sixth section concludes.
2)
The evolution of the US banking system before the crisis
In a few decades, US banks experienced dramatic changes and transformations which were essentially fuelled by the combined impacts of deregulation and technological changes. This resulted among other things in the boom of financial markets and the development of securitization which lead to the 2007-2008 credit bubble and the following crisis. In this section we describe the main evolutions of the US banking industry in order to better understand the nature of the banking industry in the 2000s and the causes of bank failures during the crisis. This will help us determine the variables which we will use to compare failed and non-failed banks, as well as potential inputs to the dynamic logistic model.
a) Deregulation and its impact on US banks
i) A short history of deregulation
At the beginning of the 80s, the US banking industry was essentially made of small depository institutions which dominated real estate lending, consumer lending and small business lending. In their article on community banks, DeYoung and al. (2004) explain that the US banking industry had been shaped by the regulation of the 1920s and 1930s following the Great Depression. According to DeYoung and al. (2004), commercial banking was the largest intermediary in the US financial system with nearly 60% of intermediated assets when including thrifts and other depository institutions.
In this heavily regulated context, banks were protected from geographical competition by the McFadden Act of 1927 which prohibited interstate branching2. There was only one loophole in the
McFadden Act, which allowed cross-border banking through multibank holding companies. However, prior to the Banking Act of 1956 exploiting this loophole required state approval.
2 However the Mc Fadden Act did not put the same constraints on wholesale banking. Commercial and industrial loans could be delivered on a national basis through local loan production offices, as long as these offices did not engage in deposit-taking.
Following the Banking Act of 1956, which closed the loophole on BHC acquisitions across states, and until 1978, the beginning of interstate banking deregulations at the state level, not a single state allowed one of its banks to be owned by a multibank holding company. In addition to intersate banking prohibition, most states limited to different degrees intrastate branching. Some states such as Illinois or Texas even prohibited any form of branching, imposing unit banking institutions.
The Glass-Steagall Act of 1933 shielded banks from product competition with other financial services providers. Commercial banks were strictly forbidden to engage in investment banking, insurance or brokerage. In addition to that, thrifts and credit unions were not allowed to issue commercial and industrial loans, limiting them to compete with commercial banks only on services to households.
Banks were also protected to some extent from pricing competition as Regulation Q limited competition on interest rate paid on all deposits except negotiable certificates of deposit (CDs) above $100,000, by imposing ceiling rates.
In the context of high inflation and increasing interest rates at the end of the 1970s, the 90-day Treasury Bill rate exceeded by far the ceiling imposed by regulation Q, provoking a large outflow of deposits from the traditional banking system to other non-bank financial institutions such as the newly created money market mutual funds, which allowed their owners the ability to write checks.
The beginning of a 20-year deregulation process thus coincides with a period of difficulties for the US banking system due to the rise of disintermediation and the competition on deposits from non-bank institutions. The development of technological innovation also put pressure on the weakest players. Calomiris (2000), in the introduction of its book U.S. bank deregulation in historical
perspective, underlines the fact that these deep changes were well received by banking scholars, whose research had shown the inefficiency and sometimes harm that geographic and product competition regulation imposed on bank customers.
The table below summarizes the main steps of the federal deregulation process which culminated in 1999 with the Gramm-Leach-Bliley Act, also know as the Financial Services Modernization Act, definitively repealing the Glass-Steagall Act of 1933.
Table 1 : Evolution of the U.S. Banking Regulation at the Federal Level
1975-1994 Removal of restrictions on intrastate branching
Maine was the first state to dismantle restrictions on intrastate branching in 1975. It was followed by New-York and New-Jersey in 1976 and 1977. The removal of intrastate
branching allowed statewide consolidation of the banking industry. Several scholars looked at the effect of such deregulation on economic growth and have found mixed results. However, it is certain that such deregulation helped to build a stronger banking system3. 1978-1994 Removal of restrictions on interstate branching
Maine again was the first state to allow bank holding companies from other states to acquire Maine banks in 1978, as long as reciprocity existed with the state of the acquiring banks. Restrictions began being effectively dismantled only in 1982 when New-York state passed a similar law, and when Massachusetts passed regional reciprocity limited to New-England states. Before the end of the decade, most states (but six of them) participated to one or several regional pacts.
1982 Garn-St. Germain Depository Institutions Act
The original purpose of the Act was to deregulate the thrift industry by allowing them to issue commercial loans and thus to compete directly with commercial banks. The act also removed regulation Q which had caused a massive outflow of deposits from thrifts and commercial banks to money market mutual funds. The act also permitted banks and thrifts to create money market deposits accounts to compete directly with money market funds. The Bank Holding Company Act of 1956 was amended to allow bank holding companies to acquire failed banks and thrifts in any state, regardless of state law.
1987 Authorisation by the Federal Reserve to create Section 20 subsidiaries
In compliance with the powers granted by the Bank Holding Company Act of 1956 and the 1970 Amendments to the Act, the Federal Reserve allowed banks to form investment banking subsidiaries. These newly formed affiliates were permitted to underwrite municipal revenue bonds, mortgage and asset-backed securities (Tier 1 powers). The revenues generated by the Section 20 subsidiaries should not exceed 5% of total revenues, in order to respect the restrictions imposed by the Section 20 of the Banking Act of 1933.
1989 Extension of Section 20 subsidiaries permitted activities
The Federal Reserve granted additional authorizations to selected group of banks to underwrite corporate securities. This privilege was then increase and extended to other banks. The revenue limit was raised to 10%.
1989 Financial Institutions Reform, Recovery and Enforcement Act (FIRREA)
The Act came as a response to the Savings & Loans crisis. It allowed bank holding companies to acquire thrifts, required agencies to issue CRA (Community Reinvestment
3 In US bank deregulation in historical perspective, Calomiris presents the compared average return on assets and return on equity for Illinois, a unit branching state and North Carolina, where statewide branching was allowed. We see that return on assets and return on equity are much higher and more stable in North Carolina.
Act) ratings publicly. To compensate for the costs generated by the CRA, FHLB (Federal Home Loan Banks) membership was opened to commercial banks. Previously it had only been available to thrifts and insurance companies. This boosted FHLB membership from 3,000 at the end of 1990 to 7,000 in 1999, and today almost two thirds of commercial banks are FHLB members. Advances from FHLB constitute an easy source of non-risk priced funding. It is used by almost one third of commercial banks. Stojanovic, Vaughan and Yeager (2008) proved that risky banks have a higher probability to rely on these advances than safer ones. Freddie Mac and Fannie Mae are also given additional responsibility to support mortgages for riskier borrowers (e.g. low-income families).
1994 Reigle-Neal Interstate Banking and Branching Efficiency Act
The Act repealed the McFadden Act of 1927 and permitted both interstate branching and acquisitions among bank holding companies. It completed the process of deregulation of geographic restrictions.
1996 Extension of Section 20 subsidiaries permitted activities
The Federal Reserve removed the firewalls that were keeping investment and commercial banking departments from working together, based on the experience of less regulated foreign underwriting affiliates allowed by the Edge Act of 1919. This resulted in increased synergies between commercial banking and investment banking activities stemming from lowered information costs. The revenue limit is raised to 25% of total revenues, enabling more banks to develop an investment banking business.
1999 Gramm-Leach-Bliley Act (GLBA) or Financial Services Modernization Act (FSMA)
This Act symbolized the final step of the deregulation process by repealing the Glass-Steagall Act of 1933, opening the way to the formation of giant financial services conglomerates and the establishment of American universal banks. Among other things, the Glass-Steagall Act prevented any bank from having more than 30% of the deposits in any state, and 10% nationwide. Besides bank holding companies, the GLBA creates financial holding companies, allowed to engage in commercial banking, insurance, securities underwriting, asset management, brokerage services and merchant banking. The revenue limit for Section 20 subsidiaries is raised to 45%.
ii) Towards a more concentrated industry
The end of geographic restrictions on commercial banking activities, trough intrastate and interstate deregulation, resulted in several waves of mergers and acquisitions. Jeon and Miller (2007) demonstrate using a regression analysis that intrastate and interstate deregulations have a positive impact on the number of mergers per bank. Between 1988 and of 1997, the number of
US banks decreased by almost 30%4. On a longer period of time, from 1980 to 2001, the number of community banks (i.e. banks with total assets lower than $1 billion) nearly halved, declining from 14,078 to 7,631. This drop, explained by mergers between community banks, is all the more impressive as during the same time interval 4,336 de novo banks were created. Assets held by community banks fell from 34% to 16% of total industry assets (DeYoung et al. (2004)). Even though most mergers occurred between community and small banks, some of them eventually lead to the creation of banking giants such as Citigroup, Bank of America or JP Morgan Chase. This dramatically increased assets concentration in the industry with the share of top 10 banks going from 20% to 34% between 1988 and 1997, and the share of top 50 banks going from 51% to 66% over the same period.
Not only did deregulation encourage bank mergers, it also fostered the creation of new commercial banks. Keeton (2000) and Seelig and Critchfield (2003) suggest that mergers caused the apparition of new banks. De Young (2003) finds these newly formed banks experienced lower failure rates over their first few years of existence, but after a while the failure rate increased significantly and then converged with the industry failure rate. This has also been verified by Jeon and Miller (2007).
The trend towards a more concentrated banking system has had several major consequences. First, geographic deregulation engendered a two-tier commercial banking system with a small number of national and super-regional banks holding most of banking assets and an overwhelming majority of small and community banks forming a fraction of the banking industry. The size factor is extremely important as strong growth and creation of large banks through mega-mergers has gone hand in hand with the apparition of a new business model exploiting the scale economies that are not accessible to smaller players. Overtime these very large banks expanded into new and more sophisticated products and activities, while small and community banks kept a traditional role of intermediation (i.e. collecting deposits and making loans) and limited themselves in most cases to traditional financial products. Concerning lending, large banks have developed standardized products based on hard quantifiable information and credit-scoring, while small and community banks keep offering more customized products by maintaining relationship lending, especially for small business loans for which soft non-quantifiable information may be more relevant than hard quantitative data.
Second, the concentration of commercial banking assets among large institutions at the national level did not have a significant effect on local market concentration. Indeed, Berger and Mester (2003) report that the average Herfindal index of local deposit market concentration across stays more or less the same through the 1990s. Thus bank mergers were more likely to be of the
4
market type in order to increase geographical coverage. As a consequence, Berger and Mester (2003) show that market concentration did not have a negative price impact on customers, as the intensity of competition at a local level did not change much. Moreover, the creation of new banks in states experiencing mergers counter-balanced, at least partially, the concentration at a local level. Third, mergers between banks in the 1980s and 1990s have had a rather negative impact on productivity whereas mergers are generally associated with stable or improved cost efficiency. This negative impact has been more pronounced for merged banks than for the banking sector as a whole. However, according to Berger and Mester (2003), this deterioration of cost productivity has been more than offset by revenue synergies and improved revenue productivity, as the profit productivity increased significantly more for merged banks than for the banking sector in general. A first explanation for this could be that merged banks are on average larger than non-merged banks and were able to benefit more from product deregulation. A second complementary explanation could be that mergers allowed banks to benefit from risk diversification. An enlarged geographical scope could have moved up the efficient frontier and allowed banks to improve their return on assets while keeping their level of risk constant. The existing literature provides support for this explanation (Berger (1998), and Akhavein et al. (1997)).
iii) The emergence of universal banks in the US
Product deregulation has encouraged commercial banks to enter new activities: first investment banking with the creation of Section 20 subsidiaries, and then brokerage, insurance underwriting or merchant banking with the repeal of the Glass-Steagall Act. These new opportunities actually benefitted the most to a small number of already large commercial banks which had the strength and resources to enter these new businesses. Mamun, Hassan and Maroney (2005) find that the announcement of the GLBA resulted in significant higher abnormal share price returns for the largest banks. Moreover, even among large banks there was a significant higher return for banks which had a Section 20 subsidiary before the GLBA than for those which had not.
Developing new activities and expanding product mix was the key to achieve what has been called economies of scope. Calomiris (2000)5 underlines that contrary to economies of scale that are
based on costs, economies of scope do not occur in the production process, but are rather based on revenue synergies and arise in the context of client-relationship management. Indeed, the idea is to develop customer-led growth by offering additional products to existing customers. For example a lending relationship with a large company gives the opportunity to offer additional services such as derivatives products, hedging, advisory services or even debt and equity underwriting services. This generates information scope economies in so far as information and
5
monitoring costs incurred in the framework of lending relationship can be spread on more products. Moreover information can also be re-used across the different product lines in order to better assess client-specific risks and improve the risk-return profile of the bank’s activities. The existence of scope economies based on relationship increased the competition for gaining new customers. It thus has become widespread to offer underpriced corporate loans in order to attract new customers (Calomiris (2000)). The measure of profitability is consequently no more assessed on an individual transaction basis, but on a relationship basis by evaluating the resources devoted to a client against the revenues that the same client generates in the form of interest payments and fees for the bank.
The best illustration of the existence of scope economies based on information-sharing and informational advantage comes from the entry of commercial banks into the security underwriting business though section 20 subsidiaries in the 1990s. Pappaioannou (2008) shows that commercial banks entered the underwriting business successfully. Their performance is particularly strong in debt underwriting and Yankee underwriting where they captured on average 58% and 60% respectively of the market over 2001-2004 versus only 19% and 15% respectively over 1990-1996. Their market share in equity and in municipal bonds underwriting also surged from 5% and 12% respectively over 1990-1996 to 40% and 36% respectively over 2001-2004. This gain in market share was mostly at the expense of independent investment banks. The top-6 bulge bracket investment banks also experienced a decline in market share over the 1990s and early 2000s except for equity offerings where they reinforced their positions overtime. Even though commercial banks had an information advantage due to their lending relationships with securities issuers this did not translate into significantly higher market share gain for high information content securities, for which the price discovery process is more complex. However, they were able to charge lower gross spread on debt underwritings according to Rotten and Mullineaux (2002), and the underpricing was reduced even more for non-investment grade bonds, which accredits the informational advantage of commercial banks resulting from scope economies. Concerning the equity underwriting market, Pappaioannou (2008) findings also suggest that small-sized first-time issuers for whom information asymmetry is greater tend to favour commercial banks with which they have lending relationships, rather than investment banks. More generally a bank with a lending relationship with an issuer is more likely to underwrite debt or equity issues (Barath et al. (2007).
The product diversification had a dramatic impact on the banking industry as a whole, even though banks from different sizes have been impacted to different degrees. Berger and Mester (2003) found that a larger product scope of commercial banks translated into both a worsening of cost productivity and an improvement of profit productivity from 191 to 1997. This means that
banks were able to expand into more sophisticated products and services that generated higher profits despite bearing higher costs. The situation is contrasted between smaller and larger banks: banks in the larger quartile have experienced much higher profit productivity gains than banks in the smaller quartile. This demonstrates that scope economies have been more accessible to larger banks. Asaftei (2006) studied the return on assets (ROA) of banks by size categories (megabanks (top 1%), large banks (2%-5%), community banks (6% to 40%), micro-banks (41% to 100%)): he found that megabanks and large banks have a higher and increasing ROA over 2000-2005, while community and micro-banks have a lower and decreasing ROA. He explains this by a decline in net interest margin (NIM) for all bank categories, but which had a stronger negative effect on the smallest banks. All bank categories benefit from a positive contribution of the non interest margin (NNIM) on the ROA, but megabanks benefit the most thanks to both a positive price effect and quantity effect on the NNIM. On the contrary, other bank categories experience a negative quantity effect on the NNIM more than offset by a positive price effect. It should also be noted that large banks have on average a much larger NNIM of 2.6% versus 0.3% for small banks. Asaftei (2006) also finds that megabanks benefitted the most from an improved product and resource mix which more than compensated a negative productivity effect. Even though the negative impact of productivity was much smaller on ROA for the small and micro-banks, it was not counterbalanced by a high enough activity effect6, which was penalized by a negative effect of
resource mix on ROA despite an improved product mix. In conclusion, Asaftei (2006) underlines that larger banks are better at substituting towards the most profitable product mix: the quantity expansion of lending compensates lower interest margins and non-interest revenues are increasing thanks to fees coming from new traditional products (such as off-balance sheet products and securitization) and from non-traditional products (such as investment banking, brokerage and insurance). Smaller banks benefitted less from the GBLA and cross-selling opportunities, as their scale prevented most of them to engage in investment banking or securitization, even though a large number has been cross-selling insurance products or charged additional fees for the servicing of traditional products such as loans sold to securitized pools.
b) Technological changes
Deregulation of the US banking industry had such a dramatic impact because it has been paralleled with a technological revolution which has given commercial banks the means to fully exploit both new geographical and product expansion opportunities.
6
i) Technological changes in the banking industry: an historical perspective
Technological changes which impacted the commercial banking industry can be divided into two categories: financial innovations such as credit scoring or new products such as derivatives and asset-backed securities, and information technology-related changes such as the development of internet-banking, ATMs, electronic means of payment (credit and debit cards). However most of the financial innovations of the three last decades have been made possible because of the progress of compilation and computation technologies. They made possible the development of new products, risk-management tools and regulatory frameworks (Basle I, Basle II) because they made technically possible to perform heavy calculations and run complex statistical models and they lowered both information processing time and information processing costs. The ratio of computers and software to value added reveals that banking is the most IT-intensive industry in the United States.
A first decisive innovation was the apparition of the automated-teller machine (ATM) in the 1960s and 1970s. Initially banks thought that ATMs would be substitutes for human tellers. However, data from the FDIC and Bank Network News annual Data Book reported by DeYoung et al. (2004) show that both the number of ATMs and of bank branches has been increasing overtime. It suggests that ATMs and branches with employees have complemented rather than cannibalized each other.
The 1980s saw the development of additional major financial and technical innovations. The computers increased information processing capacities as well as the reduced cost and time of information transfer were instrumental in the apparition and the development of new financial markets such as options, futures, swaps on interest rates, stock indexes and other financial assets. At the same time they allowed existing financial markets to function more efficiently thanks to the development of electronic platforms to match orders on existing exchanges. Moreover, new technology was a key factor in the development of securitization and asset-backed securities, even though deregulation played an important role too. Indeed, the development of information technology made easier the computation and dissemination of information concerning the performance and the operation of the asset pools. We will look more in details at the consequences of the boom of securitization in the next subsection.
Technology has also had a dramatic impact on consumer and small-business lending. Introduced for the first time in the 1950s, credit scoring has spread from consumer and real estate loans in the 1980s to small business lending in the 1990s. While it has been used by most banks for consumer loans and mortgages, credit scoring has also been used mostly by large banks for small business lending, whereas small banks rather tend to emphasize soft (non-quantifiable) information and relationship lending. According to the Federal Reserve’s 1996 Senior Loan
Officer Survey, credit scoring is primarily used in approving loans applications. Moreover, 80% of banks using credit scoring use it as a marketing tool, in order to determine from whom to solicit loan applications, and only 20% of banks using it set loan terms based on the scoring results. DeYoung and al. (2004) indicate that credit scoring and new technology may have resulted in increased lending, as banks are now accepting higher-risk borrowers, which were previously rejected. Credit scoring also had for consequence to lower underwriting costs as it is less expensive than human due diligence, even though it is unclear whether it is more effective at predicting default. The intensive use of credit scoring was necessarily accompanied by the development of private databases and information exchanges: they are intermediaries through which banks and other lenders share data on the creditworthiness of applicants. These exchanges aggregate data from various sources, e.g. banks, public records, trade creditor, and provide credit reports and/or credit scores to financial institutions. Such databases provide useful information; indeed, Jappelli and Pagano (1999) found that lending is higher and default rates lower in countries where lenders use information exchanges.
Another extraordinary evolution has been the changes which have affected the payment system. The 1990s have witnessed a switch from paper-based payments – i.e. cash and checks – to electronic payments – i.e. debit and credit cards. Gerdes and Walton (2002) reports that the number of checks paid in the United States fell from 49.5 billions in 1995 to 42.5 billions in 2000, this means an overall decrease by 14.2% or a 3% decline on average per year. In the meantime, credit card payments surged from 10.4 billion to 15.0 billion ( an overall 44.2% increase or 7.3% constant annual growth rate (CAGR)), and debit card payments exploded from 1.4 billions to 8.3 billions (an overall 592.8% increase or 35.6% CAGR). Humphrey (2002) found that between 1990 and 2000 cash share and check share in personal spending fell respectively from 25.7% to 16.3% and from 61.8% to 56%. During the same period, credit and debit card share surged respectively from 12.2% to 21.2% and from 0.4% to 6.5%. Increased use of electronic payment resulted in a strong increase of the use of automated clearing houses (ACH). The volume handled by the Fed’s ACH quadrupled from 915 million in 1990 to 3.8 billion in 2000. The rise of electronic payment may have two main explanations: increased volume and improved technology have considerably lowered unit costs – Fed data on ACH show a fall of 83% in real unit costs over 1990-2000, increasing use of electronic payments reflects the increased possibility to use such means of payments (growing network of merchants/ businesses accepting credit cards) and the growing number of debit and credit card among the population – most Americans now have several credit cards, thanks to the marketing efforts of the credit card industry (lifestyle cards, personality cards, etc.).
Progress in both financial and information technology have given banks new means to manage their risks and interest rate exposures. This was made possible by the development of increasingly sophisticated risk-models thanks to the rise in computing capacity, and new financial products such as derivatives that offer the possibility to implement complex and targeted risk management policies. In the 1990s, banks began to use new tools based on Value-at-Risk (VaR). Moreover the Basle Capital Accord adopted by the largest banks in the late 1990s and early 2000s went one step further in increasing the link between regulatory capital requirements and credit or asset risk. To comply with this new regulatory framework, banks have been continuing to develop their risk management models to estimate their exposures, default rates, loss given default, etc.
Internet also revolutionized front-office technologies and banking was no exception. The most widespread strategy has become the click-and-mortar, which combines a website with an existing network of branches and ATMs. Indeed, there were very few internet-only independent players and most of them have failed or shut their operations. Internet-only subsidiaries of large banks have also been reconverted to participate in a click-and-mortar strategy. We can distinguish between two types of websites: informational ones and transactional ones. According to Berger (2003), 37.3% of national banks have a transactional website and an additional 27.7% have only an informational website in 2002. The adoption rate of transactional website is very much linked to the bank size, with 100% of banks with more than 10 billions in total assets having one in 2000 and only 20% of banks with 100 million or less in total having one. However the adoption rate has been rapidly increasing. Even though Internet remains a marginal channel in the distribution of banking product and services it has been gaining share against other channels and helped reduce costs as well as problems associated with geography and distance.
ii) Technological change impact on bank concentration
Technological change has favoured bank concentration through mergers and acquisitions for several reasons. First, new technologies and financial products have created strong potential economies of scale. Deregulation coupled with technological innovation may have allowed the largest commercial banks to create new services and products which bear significant economies of scale: it is true for example for Internet-banking, ATMs, call-centers. Concerning wholesale and investment banking, larger banks have developed technology driven businesses where a large scale is a decisive advantage: derivatives, securitization and other off-balance sheet activities. At the same time new technology applied to existing products and services also generated higher potential economies of scale: it is true for electronic payment or credit scoring which has replaced relationship and soft information at larger banks because these methods bear high diseconomies of scale. The importance of size is shown by the fact that larger banks have always been the first to
adopt new technologies or new products. Indeed, even though these products are actually accessible to smaller banks it is at a higher marginal cost which makes them less attractive and may explains a later adoption. According to Berger (2003), larger banks thanks to their more sophisticated risk-management tools are likely to optimize capital use and invest more in high-risk high-expected returns assets. The development of IT systems within banks improved performance monitoring, allowing managers to better monitor their staff and to reduce agency costs within the organization by providing better aligned incentives.
In addition to scale economies, technological progress has also decreased diseconomies related to distance and to a large geographical scope. Geographic proximity has indeed no effect on the cost or revenues associated with new services such as internet banking, or derivatives in contrast to small business lending based on relationship and other services based on soft information. New technologies have also reduced distance-related diseconomies for traditional products and services, mostly by reducing costs associated with distance for example credit scoring does not require any local knowledge or geographic proximity. Finally, Berger and DeYoung (2002) show in their study of technological progress and geographic expansion based on MBHCs that technological progress during the period 1985-1998 has allowed banks senior managers to exercise more control over their non-lead affiliates. This translated into an improved control over costs and revenues. The impact of distance agency costs has also been reduced.
Second, technological changes may have decreased the riskiness and enhanced the attractiveness of mergers and acquisitions. Technological change may encourage consolidation because it could help banks engaged in M&A to reduce profit X-inefficiencies7 by spreading new products and best
practices through consolidation (e.g. improved risk management, sharing a transactional website). M&As also spread new technologies applied to traditional products such as small business credit scoring. Besides, technological change has allowed banks to better identify and assess targets that are good candidates for X-efficiency improvement through the implementation of new technology. The existence of internal IT system and computer-based risk management tools may also help to speed up the integration process and to reduce the time during which new managers are unaware of developing problems. Empirical studies on U.S. banks during the 1990s found that mergers generated no improvement in cost X-efficiency, whereas they found profit efficiency improvement, but this could be linked to improved diversification of risk and a shift in the assets portfolio from securities to loans. Berger and Mester (2003) found that banks that recently merged
7“X-efficiency is the effectiveness with which a given set of inputs is used to produce an output. If a firm is producing the maximum output it can, given the resources it employs, such as labor and machinery, and the best technology available, it is said to be technically-efficient.” Wikipedia, X-efficiency
were responsible for much of the findings of profit efficiency improvement and cost efficiency worsening during the 1990s.
iii) Technological change impact on bank productivity, profitability and product diversification
Linking technological progress to bank productivity is difficult because technological change cannot be easily quantified and must rather be inferred from changes in productivity ratios overtime. Another problem comes from the fact that productivity is not influenced exclusively by technological change but also by the effectiveness with which technology is used. Then, it is difficult to account for the effects of technological change as it can impact banks in ways that are not captured by traditional productivity measures. If we look at credit scoring, it not only lowers underwriting unit costs, thus generating cost X-efficiency, but it may also help to improve the risk-return of the loan portfolio by keeping the default rate constant while increasing the interest earned. This second improvement is usually not captured by traditional productivity measures. Studies suggest that improvement in service and product quality may also not be taken into account either because they result in price increases and are thus accounted for as inflation, or because of competitive pressure their profits are passed away to customers.
The strong increase in ATMs number, the use of computers and other new technologies has allowed bank branches employees to focus on higher value-added activities and led to an increased efficiency measured by an increase on average of operating income per branch while the number of full-time employee equivalent (FTE) per branch has been reduced by 10% between 1985 and 2000. Even though the investment in an ATM network at little or no charge to customers may have been considered as deteriorating productivity during the 1980s, in fact it improved productivity over the long run.
At the bank level, Berger and Mester (2003) found a worsening of cost productivity of 12.5% annually more than compensated by revenue increases since profit productivity improved between 13.7% and 18.5% annually over a period of time from 1991 to 1997. The main cause of the increasing profit productivity is a change in the product mix of commercial banks which occurred thanks to the combination of both deregulation and technological change.
Despite the worsening of cost productivity, Asaftei’s findings suggest that from 2000 to 2005 large banks became more efficient, i.e. the gap between the best-practice banks and the rest of the banks decreased. On the contrary, small banks have experienced an increase in the gap between the best-practice banks and the rest of the group. It highlights a growing heterogeneity among small institutions. Even though some small banks were able to keep up with the fast pace of technological progress, most of them are not able to implement the most recent technologies,
either because they do not have the financial means to support the required investments or because they do not expect to reap profits from the implementation of new technologies.
c) Securitization and disintermediation
i) The rise of securitization
First invented in the 1960s thanks to the development of information technology and the Ginnie Mae passthrough8, securitization exploded in the 1980s with the conjunction of several factors: i)
the improvement in technology which has allowed to compute and disseminate information more rapidly, ii) regulatory changes which permitted commercial banks to get involved in asset-backed securities through section 20 subsidiaries, change in loan sales accounting rule introduced by the FHLBB in 1981, power and responsibilities granted to Fannie Mae and Freddie Mac through the FIRREA in 1989.
Securitization is a generic word which encompasses very diverse situations. It generally consists in the creation of liquid trading securities from a pool of illiquid non-traded assets, where the payoff features of the securities significantly differ from those of the assets (let it be in terms of seniority, maturity…). In order to do so, banks set up a special purpose vehicle (SPV) to which they sell assets with different characteristics (asset class, riskiness, maturity, interest rate…). To finance this acquisition, the SPV sell securities with different risk levels, interest rates and payoff characteristics to outside investors. In some cases the sponsoring bank retains a junior stake (called equity) in the SPV financing structure. In some cases the sale of the asset pool can be considered as a true sale, which implies that the risks associated to the asset pools have been effectively transferred to the SPV investors. In other cases, such as conduits (pool of assets financed by short-term commercial paper) or credit card securitization, the bank retains most of the risk associated with the asset despite their sale to outside investors.
The growth in asset-backed securities has been tremendous since the 1970s with more and more asset classes being securitized: mortgages, credit cards receivable, auto loans, commercial and industrial loans… From the 1970s to 2001, securitization went from several hundred billion dollars to more than 4,500 billion, an amount close to total banking assets which represented 5,700 billion as of the end of 2001. According to Uzun and Webb (2007), who identified 112 banks involved in securitization from 2001 to 2005, the most securitized asset class is mortgages with an average principal balance per securitizing bank of $3.9 billion, closely followed by credit card
8
Ginnie Mae was set up in 1968 to promote home ownership. It guarantees MBS which are pooling residential real estate loans insured by other government agencies, including the Federal Housing Administration (FHA), the Department of Veterans Affairs, the Department of Agriculture’s Rural Development. The loans are originally issued by commercial banks and real estate lenders and then sold to Ginnie Mae guaranteed MBS pools.
receivables with $3.5 billion, other consumer loans with $0.17 billion, home equity lines of credit (HELOCs) with $0.11 billion. They also found that very few banks were securitizing most or all asset classes. On the contrary most of them were securitizing only one or a few asset classes. Unlike other innovations developed by commercial banks, securitization has been supported by government intervention through two government sponsored enterprises: Fannie Mae and Freddie Mac. Backed by an implicit government guarantee, these two institutions have played a key role in the residential mortgage market and the growth in mortgage-backed securities (MBS). According to DeYoung et al., citing Passmore et al., Fannie Mae and Freddie Mac have sold to investors $1,200 billion of MBS and are holding on their balance sheet another $1,000 billion.
Uzun and Webb tried to determine the characteristics of banks engaged in securitization and the drivers of securitization by designing a logit model taking into account a sample of 112 banks engaged in securitization and 112 banks not engaged in securitization. The sample of non-securitizing bank has been designed to match each non-securitizing bank with the non-non-securitizing bank which has the closest asset size. They found that securitizing banks are larger than non-securitizing banks (five times larger on average based on their matched sample). However they found no significant difference in total risk-based capital ratio or in tier 1 leverage ratio. In one of their model, they also found that growth in total assets is a significant factor.
Asset size matters most because, like many other financial innovations, securitization benefit from strong scale economies, especially in the set up of conduits and asset pools where costs are rather fixed and not influenced by size (specific IT infrastructure, specialized teams, costs associated with legal and regulatory matters…). Even though community banks have not been able to develop their own securitization business they have used it as an important tool to geographically diversify their locally-concentrated loan portfolios, by purchasing MBS and financing it with loan sales to investment banks or SPV set up by larger banks engaged in securitization or by decreasing their exposure to traditional securities such as government bonds.
ii) The impact of securitization on the banking system and banks’ business model
Securitization has had a profound impact on the banking system and is doubtlessly at the origin of the so-called “subprime crisis”, referring to the mortgages contracted by high-risk borrowers with low income, bad credit history, high loan-to-value and payment-to-income ratios.
The most visible consequence of securitization has been a boom in credit, especially household credit. This has materialized by the rise in residential real estate mortgages. According to Heilpern et al. (2009), the stock of outstanding residential real estate mortgages reached $11 trillion at the end of 2007, of which an estimated $2 trillion were subprime and another $1.1 trillion were f home equity lines of credit (HELOCs). A HELOC is usually some sort of revolving or fixed credit in
which the equity stake you have in your home serves as collateral. The rise in real estate prices during the 2000s which had been fuelled by the credit boom and low interest rates triggered a re-leveraging of US households which were able to accumulate more debts thanks to the increasing valuation of their homes. Contrary to residential real estate gross fixed capital formation (GFCF) which tracks more or less the evolution of GDP over 1963-2007, except during the early 1990s during which GFCF was below GDP growth, the residential real estate mortgage stock shows a decorrelation from GDP from the early 1980s on. While GDP grew at a CAGR of 5.3% between 1983 and 2007, the stock of residential real estate mortgages increased at a CAGR of 9%. The decoupling between physical assets evolution and financial assets evolution has been called financialization. The decoupling between mortgages and GDP coincides with the development of securitization on a large scale.
The rise in US house price, initially fuelled by a credit boom, itself driven by securitization, pushed banks to enlarge their product scope (e.g. adjustable-rate mortgage, Pick a Payment mortgage) to attract subprime borrowers. Banks and non-bank mortgage underwriters were all the more eager to extend credit to these risky applicants as the demand for such loans in the secondary market was high. In their study of the role of securitization in the expansion of subprime credit, Nadauld and Sherlund (2009) found based on a cross-section of 2,786 zip codes in 2005 that the change in market share between 2003 and 2005 five “Consolidated supervised entities”9(CSEs) banks was
significant and positively related to the number of subprime loan sold to the secondary market. They also found that the higher is the proportion of subprime loan sold, the higher is the proportion of subprime loans on total loans.
Securitization did not only drive the expansion of the mortgage market, it has also been instrumental to the growth of credit cards which represent around 90% of consumer credit. According to Calomiris and Mason (2004), the average annual growth rate of consumer credit was over 12% between 1980 and 2002. After the crisis of the early 1990s, securitization helped revitalize the credit card industry which experienced growth of 18% in 1994 and 22% in 1995. At that time credit card represented 48.4% of the non-mortgage ABS market, and in 2001 it represented 28.2%10 Securitized credit cards made up about half of total consumer credit and 60%
of credit cards receivables were securitized as of 2001, even tough the vast majority of banks kept credit cards receivables on balance sheet. It reflects the fact that the largest commercial banks have engaged in securitization, whereas most small banks did not.
9
In response to a EU directive, the SEC proposed amendments on rules establishing regulatory capital requirements for the largest broker-dealers. These firms have become Consolidated Supervised Entities. The alternative rule is estimated to have reduced capital requirements by 30%-40%.
10
Beyond a credit boom which benefitted mostly to households and the real estate market, securitization has triggered a shift from the traditional intermediated banking model in which banks originate and retain loans on their balance sheet, financing them mostly with equity capital and deposits, to a disintermediated and fragmented banking model deeply interconnected with financial markets, in which banks originate or purchase and then sell on and distribute loans, keeping few of them on balance sheet. Consequently, the high loan portfolio turnover permitted by securitization allows banks to lend more with the same amount of equity capital because most loans don’t stay on the balance sheet. Banks tend to become an intermediary between borrowers and capital markets, generating fees and income through origination, sale and ABS structuring and underwriting. However, the reality is maybe more complex: studies such as Acharya, Suarez and Schnabl (2010) on conduits have shown that securitization does not always result in a “true sale” in so far as the risk associated with the assets are not passed away to outside investors but stay within the bank. Even though US GAAP does not impose on banks to consolidate conduits (whereas IFRS does), we can consider that the frontier between on and off-balance sheet may be in some instances more fictive than real. In a way, securitization can be seen as a non-traditional source of financing bank’s assets by borrowing money on financial markets; this tends to mitigate the disintermediation view.
Another subject of interest is the advantages and disadvantages of securitization. At the light of the recent crisis, the supposed risk-diversification, increased transparency and stability of the banking system do not sound convincing. However, when looking carefully at the traditional banking model, we find that banks use deposits, which are by nature short-term resources which can be withdrawn at any time and exhibited a strong volatility in the 1970s and 1980s, to finance loans which are long-term commitments, hence creating an asset liability mismatch as well as a lack of visibility on resources that could be invested. When considering that households have been investing a decreasing part of their financial assets on checkable accounts and savings accounts from the 1970s until now (DeYoung et al. (2004)), securitization may have appeared to be a cheap, more reliable and longer-term source of funding than deposits. It also allowed banks to indirectly hold more assets without having to increase their regulatory capital.
Because it establishes a fragmented value chain with numerous intermediaries between the borrower and the final investor, securitization creates non-trivial agency problems and leaves room for arbitrage opportunities. Concerning agency problems, there is obviously an issue of asymmetric information between the loan originator and the final investor. Credit card securitization provides an insightful example of that. Outside investors can access to all the information on the credit history of the credit card holders pooled in the SPV through various public and private databases. The only piece of information they do not have, but which the
issuing bank knows is how the customer was attracted. Indeed, unobservable customer characteristics make them more or less likely to choose a scheme over another. It means that some offers may be more attractive to low or high default risk customers. This also explains why rating agency are more conservative when assessing new accounts compared to seasoned credit cards, for which the asymmetric information is less acute, because the market has learned about their at first unobservable characteristics overtime. Asymmetric information has been mitigated by several initiatives: i) the rating by rating agencies of the debt tranches issued by the asset pool, ii) the alignment of investors and issuing bank interest by the fact that issuing banks retain the most junior stake in the asset pool tranches, iii) the existence of implicit or explicit recourse and/or guarantees on the assets given by the issuing banks, which acts as a signal of the assets quality. However these different mitigants to agency problems have been exploited by banks to engage in credit rating arbitrage and in regulatory arbitrage. If we first take a look at the ABS rating process, we find that rating agencies were often involved at the same time in helping banks and investment banks structure asset pools and “tranche” cashflows and in rating the very same ABS, which casts a doubt on rating agencies credibility because of the obvious conflict of interests. More interestingly, Nadauld and Sherlund (2009) explain that bank have an incentive to engage in rating arbitrage: it consists in buying the cheapest combination of loans to reach a given rating level (which reflects a higher credit quality than the pool intrinsic credit quality). This means buy marginally riskier loans which could still be eligible for a high-quality credit rating. Nadauld and Sherlund find that high past real estate price appreciation was significantly and positively related with the size of a deal AAA-tranche. They explain that banks engaged in credit rating arbitrage by purchasing or issuing loans of lower credit quality (riskier borrower, higher LTV, higher payment to income) in areas with high price appreciations which allowed them to minimize the purchasing price and maximize the selling price, as a deal rating has a direct impact on its cost of funds. Rating arbitrage made securitization very attractive and profitable, especially for investment banks, which explains why they were among the largest purchaser of subprime loans in areas with high price appreciations.
Second, the existence of implicit recourse especially on credit card securitization deals (Calomiris and Mason (2004)) and of explicit guarantees on conduits (securitized assets financed by short-term commercial paper) resulted in banks retaining most or all of the risks associated with the securitized assets. Consequently, banks were exposed to these assets as if they were on their balance sheet but without having to finance them with regulatory capital because they were considered as off-balance sheet for regulatory ratios computations. This helped banks to decrease their funding cost (because equity is more costly than debt) and made securitization profitable. Based on very simple calculations, Acharya, Schnabl and Suarez (2009) found that conduits would
not have been profitable if they had to be financed with a capital requirement of 8%. Thus, the consolidation of conduits for regulatory matters would have discouraged banks to set them up in the first place. Regulatory arbitrage is not limited to by-passing regulatory capital requirements by playing on the difference between on and off-balance sheet. Referring to Acharya and Schnabl (2009), Nadauld and Sherlund explain that between 2004 and 2007 the growth in risk-weighted assets was much lower than the growth in total assets, which means that banks have been investing in safer assets than those which they were holding during this period. When we know that banks kept as much as 30% of the AAA-rated tranche of all real estate related ABS and CDOs on their balance sheet, it is easy to understand that banks used securitization as a way to free-up additional regulatory capital, or let’s say to take on more risk for an equal level o regulatory capital. This form of regulatory arbitrage is based on the rating arbitrage presented above to decrease regulatory capital requirements. Exposure to assets which would have require higher capital levels given their risk are actually hold through the AAA-rated tranche of the ABS, which requires less regulatory capital. This regulatory arbitrage can be viewed as based on the use of asymmetric information by banks on the true riskiness of their assets against regulators.
d) The development of financial markets and derivatives
The limitations and restrictions imposed from early on on banks, limiting their size and scope and thus their ability to support and finance companies which have been getting larger over time, has fostered the development of broad and active capital markets which are a major source of financing for the economy. In his book U.S bank deregulation in historical perspective, Calomiris (200) underlines that a key characteristic of the American universal banking model is the growing integration between commercial banks and financial markets. According to him, leveraging and using the comparative advantage of US financial markets will be one of the drivers of success for US commercial banks in the first decades of the twenty-first century. If it is true that US financial markets have been more developed and active than in other countries, they also experienced a tremendous growth thanks to technological changes which have allowed to reduce transaction costs, to compute data and disperse information instantly. Financial innovation reinforced and was reinforced by technological change. As a consequence, financial markets scope is increasing at a very high pace thanks to the creation of new products such as complex derivatives. The latest example is doubtlessly the extraordinary growth of credit derivatives and especially credit default swaps. The notional amount of credit default swaps stood at $698 billion at the end of June 2001;
by the end of 2004 it had multiplied by 10, and grew to $42,580 billion at the end of June 200711. Another interesting point in the history of capital markets is the rise of new categories of players with a strong influence. Since the 1980s we have witnessed the development of the hedge funds industry. Despite its small size in terms of assets under management, compared to the total size of assets managed worldwide, hedge funds represent a large part of the transactions on financial markets due to their very active strategies. Besides, the recent apparition of high frequency trading has had a meaningful impact on the capital markets, as it fuelled the overall increase in volumes. However, most commercial banks have limited activities linked to commercial markets. Going back to credit derivatives, Minton et al. (2008) found that between 1999 and 2005 only 23 out of 395 (i.e. 5.82%) bank holding companies with total assets greater than $1 billion were using credit derivatives. The average notional amount held by these 23 banks was around $240 billion. This very high number reflects the fact that, even though few banks have trading activities, those who do have a large exposure to financial markets.
The development of new products has given the opportunity to implement sophisticated risk-management practices using interest rate derivatives, exchange rate derivatives or credit derivatives in order to better control these risks. This has been done to a certain extent by the largest banks which benefit from scale efficiencies and have the human, technological and financial resources do so; but most small banks are unlikely to use derivatives or other sophisticated financial products in order to transfer some risks to other markets players. Moreover, Minton et al (2008) conclusion is that most of the exposure of banks to credit derivatives is related to dealing and trading activities rather than hedging credit risks.
3)
Data and hypotheses on the failure of US regional banks
a) Data
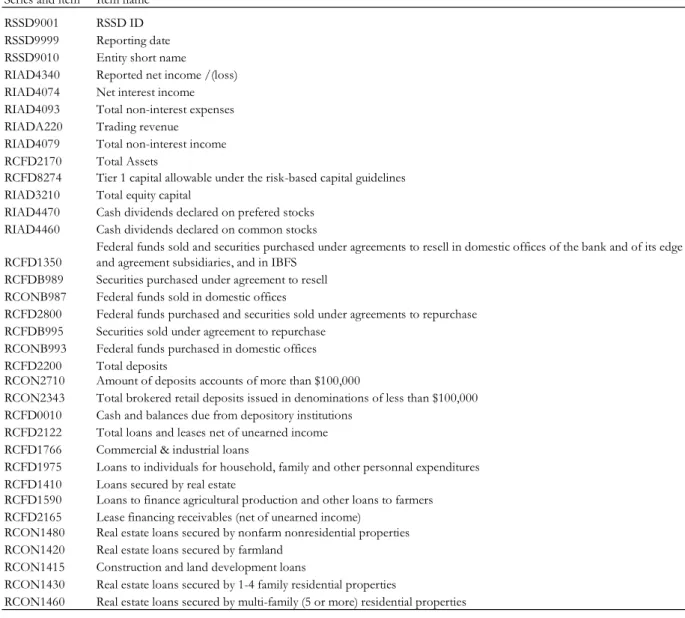
The data are extracted from the quarterly Call Reports filed by all FDIC insured banks with the Federal Financial Institutions Examination Council (“FFIEC”), which collect them on behalf of several banking regulators (the Federal Deposit Insurance Corporation (FDIC), the Federal Reserve (Fed), and the Office of the Comptroller of the Currency (OCC))12. The data are taken from the Call reports on a quarterly basis. They include income statement, balance sheet and off-balance sheet items for the period 2001-2009. The data on bank failures are disclosed by the FDIC on its website and provide the name, the certificate number and the closure date of individual banks.
11 Statistics from the Bank of International Settlements (BIS), reported by Minton et al. (2008) 12
We observe 10,504 individual banks over the 2001-2009 period, of which 7,608 have data available over the entire time period. The other banks have either failed or been acquired or closed during the 2001-2009 time period. As only 189 banks have failed, most of the remaining 2,666 banks which have disappeared may have been acquired. This again emphasizes the increasing concentration of the industry developed in section 2. We have 302,027 bank-quarters observations in the panel data, representing on average 28,8 bank-quarters per bank over a period of 36 quarters. Our primary identifier for the banks in the database is the RSSD ID which is also the primary identifier of the Call Reports database. An entity has one and only one RSSD ID over its lifecycle, even though it may change its name or its bank charter number.
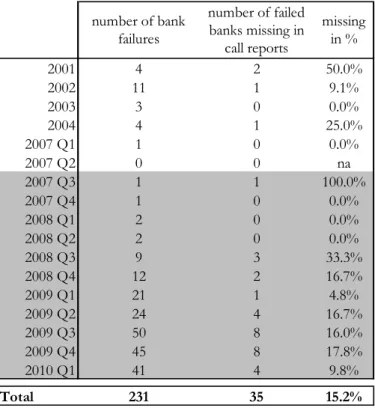
The list of failed banks, disclosed on the FDIC website, shows that 230 banks failed between 2001 and the end of the first quarter of 2010. For the purpose of this study, we consider that the so-called subprime crisis began on August 9, 2007, when BNP Paribas freezed withdrawals from three funds and suspended net asset value calculations because the rising illiquidity of ABS on the market made them difficult to trade and to value fairly. As a consequence, all banks which failed after July 1, 2007 are included in our sample. We drop from the panel banks which have failed between 2001 and June 30, 2007. However, the number of failed banks represented in our panel is lower than the 208 banks which failed between Q3 2007 and Q1 2010 (Table 1). When we
Table 2: Bank failures in the US over time
number of bank failures number of failed banks missing in call reports missing in % 2001 4 2 50.0% 2002 11 1 9.1% 2003 3 0 0.0% 2004 4 1 25.0% 2007 Q1 1 0 0.0% 2007 Q2 0 0 na 2007 Q3 1 1 100.0% 2007 Q4 1 0 0.0% 2008 Q1 2 0 0.0% 2008 Q2 2 0 0.0% 2008 Q3 9 3 33.3% 2008 Q4 12 2 16.7% 2009 Q1 21 1 4.8% 2009 Q2 24 4 16.7% 2009 Q3 50 8 16.0% 2009 Q4 45 8 17.8% 2010 Q1 41 4 9.8% Total 231 35 15.2%
failed banks were not included in our data, which represents 14.8% of the banks which failed between Q3 2007 and Q1 2010. As a consequence, our model is based on the data available for the 140 banks which are in our database and which failed between Q3 2007 and Q4 2009. We add to these banks the 37 banks for which we have information and which failed in Q1 2010, only for our historical comparison.
The fact that some banks are missing comes as a surprise as all commercial banks are registered with the FDIC and have a legal obligation to fill the quarterly Call Reports. We find that 27 of the missing banks are Savings Banks, 3 are Savings & Loans Associations, which are both supervised by the OTC, and the last one is a National Bank supervised by the OCC. Washington Mutual, which was the U.S sixth largest bank and whose failure has been making the headlines in 2008, is included in the 27 Savings Banks.
These institutions are supervised by the Office of Thrift Supervision (OTS), which has its own financial reports (Thrift Financial Reports) disconnected from the Call Reports. This explains why a number of failed banks could not be found in our database.
When looking at the timing of bank failures, it is striking to observe that the number of failures has reached its peak until now over the last three quarters (Q3 2009, Q4 2009 and Q1 2010). We see that the bulk of the failures has happened after Lehman Brothers’ bankruptcy in September 2008. This is unexpected given that i) the liquidity crisis has been partly resolved thanks to the massive injection of liquidities in the financial system by central banks and governments, which has eased the situation for most banks and provided them which cheap and abundant funding ii) the financial markets have been recovering after Q1 2008 and this despite the recent turbulences. Even more surprising, despite the shock created by the bankruptcy or near bankruptcy of large Wall Street firms and commercial banks (e.g. Washington Mutual and Wachovia), local and federal authorities have let banks fail, which may indicate that these failures had little impact on the strength of the financial system and did not increase systemic risks because these banks were much smaller and “too-small-to-save”. Another reason which may explain this distribution of failures overtime is that most US banks are small-sized local institutions with a rather traditional lending business model. We think that even though the situation has improved on financial markets, banks with large loan portfolios are still facing a significant credit risk in the aftermath of the credit bubble and have to deal with high delinquency rates on their loans.
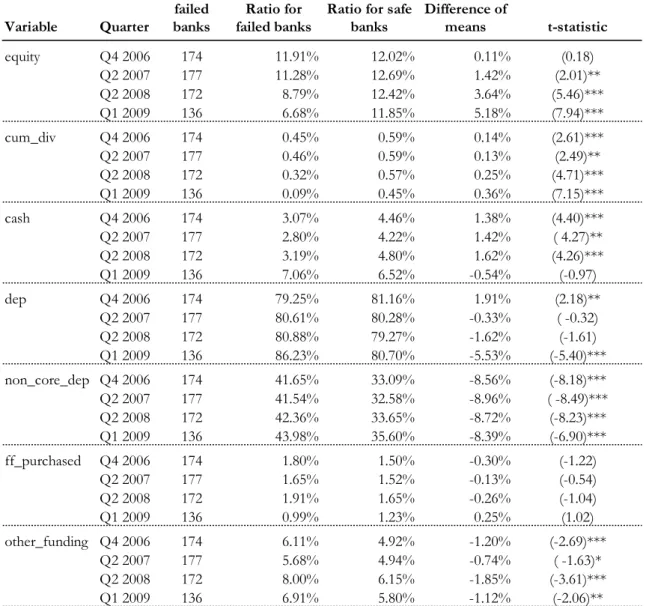
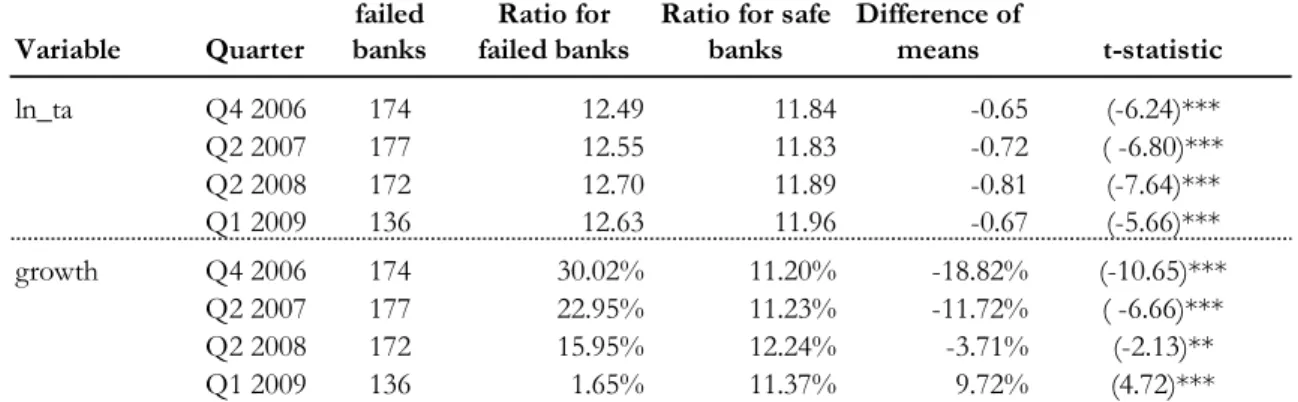
We now present the data that we have extracted from the Call Reports in order first to compare failed banks and safe banks on several key metrics to understand the potential differences between the two categories of banks and second to build a dynamic logistic model.