HAL Id: tel-02309362
https://tel.archives-ouvertes.fr/tel-02309362
Submitted on 9 Oct 2019
HAL is a multi-disciplinary open access archive for the deposit and dissemination of sci-entific research documents, whether they are pub-lished or not. The documents may come from teaching and research institutions in France or abroad, or from public or private research centers.
L’archive ouverte pluridisciplinaire HAL, est destinée au dépôt et à la diffusion de documents scientifiques de niveau recherche, publiés ou non, émanant des établissements d’enseignement et de recherche français ou étrangers, des laboratoires publics ou privés.
French-English interlanguage : a quantitative approach
of the acquisition of the /�/-/i�/ and /�/-/u�/ contrasts
Adrien Meli
To cite this version:
Adrien Meli. A longitudinal study of the oral properties of the French-English interlanguage : a quantitative approach of the acquisition of the /�/-/i�/ and /�/-/u�/ contrasts. Linguistics. Université Sorbonne Paris Cité, 2018. English. �NNT : 2018USPCC097�. �tel-02309362�
de l’Université Sorbonne Paris Cité
Préparée à l’Université Paris Diderot
École doctorale “Sciences du langage” (ED 132)
CLILLAC-ARP (EA 3967)A longitudinal study of
the oral properties of the French-English interlanguage
A quantitative approach of
the acquisition of the /I/-/i:/ and /U/-/u:/ contrasts
Adrien M
ÉLIThèse de doctorat en linguistique anglaise
Dirigée par Nicolas BALLIER
Soutenue publiquement à Paris le 4 avril 2018
Directeur de thèse : Nicolas BALLIER Professeur à Paris Diderot
Examinateurs : Emmanuel FERRAGNE Maître de Conférences à Paris Diderot Richard WRIGHT Professeur à University of Washington Rapporteurs : Sophie HERMENT Professeure à Aix-Marseille Université
Noël N’GUYEN Professeur à Aix-Marseille Université
This work would not have seen the light of day without the infinite, infinite patience of my wife Claire and my supervisor Nicolas BALLIER. I stand in debt to them.
Without fear of repeating myself, I would like to thank Nicolas BALLIERfor his infinite,
infinite, patience, wisdom, knowledge and bienveillance.
For their patient and knowledgeable support, I would like to thank the rest of my thesis
committee: Emmanuel FERRAGNE, Sophie HERMENT, Noël NGUYEN, Richard WRIGHT.
For their help on so many issues, Geoff MORRISSON, Aurélie FISCHER; HUMA-NUM
and Gérald FOLIOT; Taylor ARNOLD.
Résumé
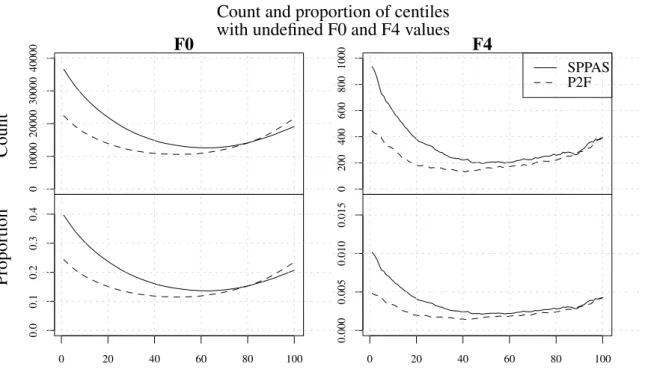
Ce travail entreprend d’évaluer l’évolution de l’acquisition phonologique par des étudiants français des contrastes anglais /I/-/i:/ et /U/-/u:/. Le corpus étudié provient d’enregistrements de conversations spontanées menées avec des étudiants natifs. 12 étudiants, 9 femmes et 3 hommes, ont été suivis lors de 4 sessions espacées chacune d’un intervalle de six mois. L’approche adoptée est résolument quantitative, et agnostique quant aux théories d’acquisition d’une deuxième langue (par exemple Flege (2005), Best (1995), Kuhl et al. (2008)). Afin d’estimer les éventuels changements de prononciation, une procédure au-tomatique d’alignement et d’extraction des données acoustiques a été conçue à partir du logiciel PRAAT (Boersma & Weenink (2013)). Dans un premier temps, deux autres logiciels, SPPAS (Bigi (2012a)) et P2FA (Yuan & Liberman (2008)) avaient aligné les transcriptions des enregistrements au phonème près. Plus de 90 000 voyelles ont ainsi été analysées. Les données extraites sont constituées d’informations telles que le nombre de syllabes du mot, de sa transcription acoustique dans le dictionnaire, de la structure syllabique, des phonèmes suivant et précédant la voyelle, de leur lieu et manière d’articulation, de leur appartenance ou non au même mot, mais surtout des relevés formantiques de F0, F1, F2, F3and F4. Ces
relevés formantiques ont été effectués à chaque pourcentage de la durée de la voyelle afin de pouvoir tenir compte des influences des environnements consonantiques sur ces formants. Par ailleurs, des théories telles que le changement spectral inhérent aux voyelles (Nearey & Assmann (1986), Nearey (2012), Assmann et al. (2012)), ou des méthodes de modélisation du signal telles que la transformation cosinoïdale discrète (Harrington (2010)) requièrent que soient relevées les valeurs formantiques des voyelles tout au long de leur durée. Sont successivement étudiées la fiabilité de l’extraction automatique, les distributions statistiques des valeurs formantiques de chaque voyelle et les méthodes de normalisation appropriées aux conversations spontanées. Les différences entre les locuteurs sont ensuite évaluées en analysant tour à tour et après normalisation les changements spectraux, les valeurs
for-mantiques à la moitié de la durée de la voyelle et les transformations cosinoïdales. Les méthodes déployées sont les k plus proches voisins, les analyses discriminantes quadratiques et linéaires, ainsi que les régressions linéaires à effets mixtes. Une conclusion temporaire de ce travail est que l’acquisition du contraste /I/-/i:/ semble plus robuste que celle de /U/-/u:/.
Mots-clefs : réalisations vocaliques, acquisition phonologique, deuxième langue, ap-proche quantitative, analyses formantiques, méthodes de normalisation, modélisation du signal.
Summary
This study undertakes to assess the evolution of the phonological acquisition of the English /I/-/i:/ and /U/-/u:/ contrasts by French students. The corpus is made up of recordings of spontaneous conversations with native speakers. 12 students, 9 females and 3 males, were recorded over 4 sessions in six-month intervals. The approach adopted here is resolutely quantitative, and agnostic with respect to theories of second language acquisition such as Flege (2005), Best (1995) or Kuhl et al. (2008). In order to assess the potential changes in pronunciations, an automatic procedure of alignment and extraction has been devised, based on PRAAT (Boersma & Weenink (2013)). Phonemic and word alignments had been carried out with SPPAS (Bigi (2012a)) and P2FA (Yuan & Liberman (2008)) beforehand. More than 90,000 vowels were thus collected and analysed. The extracted data consist of information such as the number of syllables in the word, the transcription of its dictionary pronunciation, the structure of the syllable the vowel appears in, of the preceding and succeeding phonemes, their places and manners of articulation, whether they belong to the same word or not, but also especially of the F0, F1, F2, F3and F4formant values. These
values were collected at each centile of the duration of the vowel, in order to be able to take into account of the influences of consonantal environments. Besides, theories such as
vowel-inherent spectral changes (Nearey & Assmann (1986), Nearey (2012), Assmann et al. (2012)), and methods of signal modelling such as discrete cosine transforms (Harrington (2010)) need formant values all throughout the duration of the vowel. Then the reliability of the automatic procedure, the per-vowel statistical distributions of the formant values, and the normalization methods appropriate to spontaneous speech are studied in turn. Speaker differences are assessed by analysing spectral changes, mid-temporal formant values and discrete cosine transforms with normalized values. The methods resorted to are the k nearest neighbours, linear and quadratic discriminant analyses and linear mixed effects regressions. A temporary conclusion is that the acquisition of the /I/-/i:/ contrast seems more robust than that of the /U/-/u:/ contrast.
Key-words: vocalic realizations, phonological acquisition, second language, quantitative approach, formant analysis, normalization methods, signal modelling.
List of figures xv
List of tables xix
Nomenclature xxi
Introduction 1
Theories in SLA . . . 2
Main purposes . . . 3
Chapter content . . . 5
1 Corpus and Data 9 1.1 Corpus . . . 9
1.1.1 Participants and metadata . . . 9
1.1.2 Recordings and tasks . . . 11
1.2 Workflow . . . 16
1.2.1 Global procedure . . . 17
1.2.2 PRAAT03 . . . 22
1.2.3 The multitier TextGrid . . . 27
1.2.4 The generated dataframes . . . 30
1.4 Theoretical justifications . . . 36
1.5 Vowel reductions and weak forms . . . 39
1.6 Syllabification: technical details . . . 45
1.6.1 Coding principles and challenges for syllabification . . . 45
1.6.2 Errors in syllabification . . . 49
1.7 Preliminary analyses . . . 54
1.7.1 Formant tracks and vowel durations . . . 54
1.7.2 Speech rate . . . 58
1.8 Conclusion . . . 64
2 Speaker-independent Analyses 67 2.1 Technical Preliminaries . . . 68
2.2 Assessing alignment and extraction quality . . . 72
2.2.1 Assessment with predefined formant ranges . . . 73
2.2.2 Vowel trapezoids . . . 78
2.3 Disparities in phonemic distributions . . . 81
2.3.1 Standard deviations . . . 81
2.3.2 Type/Token Ratios . . . 87
2.4 Issues in normalization . . . 91
2.4.1 Requirements of normalization . . . 91
2.4.2 Phoneme-gating . . . 95
2.5 Contrasts and vowel space . . . 103
2.6 Conclusion . . . 106
3 Speaker-dependent analyses 107 3.1 Preliminary remarks . . . 109
3.2.1 Onset-to-offset distances and vowel tokens . . . 113
3.2.2 Standard deviations of OODs . . . 117
3.3 k-Nearest Neighbours . . . 121
3.3.1 Method . . . 121
3.3.2 Results . . . 128
3.4 A longitudinal effect? An LMER analysis . . . 136
3.4.1 Purpose and issues: a warning . . . 138
3.4.2 Fixed and random effects . . . 145
3.4.3 Models . . . 146
3.4.4 Results . . . 149
3.5 Discrete Cosine Transformations . . . 153
3.5.1 Presentation and justification of DCTs . . . 153
3.5.2 Experimental design . . . 157 3.5.3 DCTs vs. mid-temporal values . . . 165 3.5.4 Conclusion . . . 174 3.6 Conclusion . . . 175 Conclusion 177 References 185 Appendix A Extra tasks for Session 4 193 A.1 Map task . . . 193
A.2 Reading lists . . . 194
A.2.1 Reading task n°3: list of words . . . 194
A.2.2 Reading task n°4: Le géant égoïste . . . 194
Appendix C Code snippets 199
C.1 P2FA Bash script . . . 199
C.2 Calculation of EPENTHETIC . . . 199
C.3 Modified list of English phonemes for SPPAS syllabification algorithm . . . 200
C.4 Pitch in PRAAT03 . . . 201
C.5 Syllable check . . . 201
C.6 Common R code . . . 203
C.7 Code for Optimal Centiles . . . 205
C.8 Multimodel Comparisons . . . 206
Appendix D Dataframes: column names and lists of words 209 D.1 English dataframe . . . 209 D.2 French dataframe . . . 212 D.3 Subfiles . . . 212 D.3.1 Duration file . . . 212 D.3.2 Word file . . . 213 D.3.3 PVI file . . . 213
D.3.4 Phoneme duration file . . . 213
D.4 Syllable mismatches . . . 213
D.4.1 SPPAS syllable mismatches . . . 213
D.4.2 P2FA syllable mismatches . . . 214
Appendix E Extra graphs and tables 217 E.1 Extra-graphs for the French and English reading lists . . . 217
E.2 Extra graphs: Onset-to-Offset Distances . . . 217
E.3 Mean differences of OOD standard deviations . . . 219
E.5 Corrected response variables . . . 220
E.6 Multimodel comparisons with log-transformed response variables . . . 222
E.7 DCT: extra-graphs . . . 223
E.7.1 Procedure to calculate intra- and inter- phoneme proportions . . . . 223
E.7.2 Per-session, per-speaker evolution of k2 . . . 224
E.7.3 QDA model results . . . 224
Appendix F List of papers and conferences 227
1 Parallelism in the phonemic structures of the two contrasts . . . 2
1.1 Aggregated per-session summary of recording durations. . . 12
1.2 Chosen questions for Session 1 & 2 . . . 13
1.3 Per-speaker recording durations. . . 16
1.4 Flow chart of the alignment procedure . . . 18
1.5 Kernel density plot of short interval durations. . . 19
1.6 Per-speaker aggregated durations of extracted speech. . . 20
1.7 Intervals scanned by PRAAT03 . . . 25
1.8 Multitier TextGrid . . . 29
1.9 Undefined formant values . . . 33
1.10 F1and F2values of the SPPAS-aligned vocalic nuclei of “the” and “to” . . . 41
1.11 F1and F2values of the P2FA-aligned vocalic nuclei of “the” and “to” . . . 44
1.12 Number of occurrences of words featuring syllabing mismatches . . . 50
1.14 Example of a varying transcription . . . 52
1.15 Example of formant tracks . . . 55
1.16 Distribution of vowel durations in spontaneous speech . . . 57
1.17 Scatter-plot of the number of syllables . . . 59
1.18 Scatter-plot of the number of phonemes . . . 61
2.2 Colour codes of phonemes . . . 71
2.3 Phoneme counts and proportions of centiles with plausible formant values . 75 2.4 Phoneme proportions of within-range centiles against their counts . . . 76
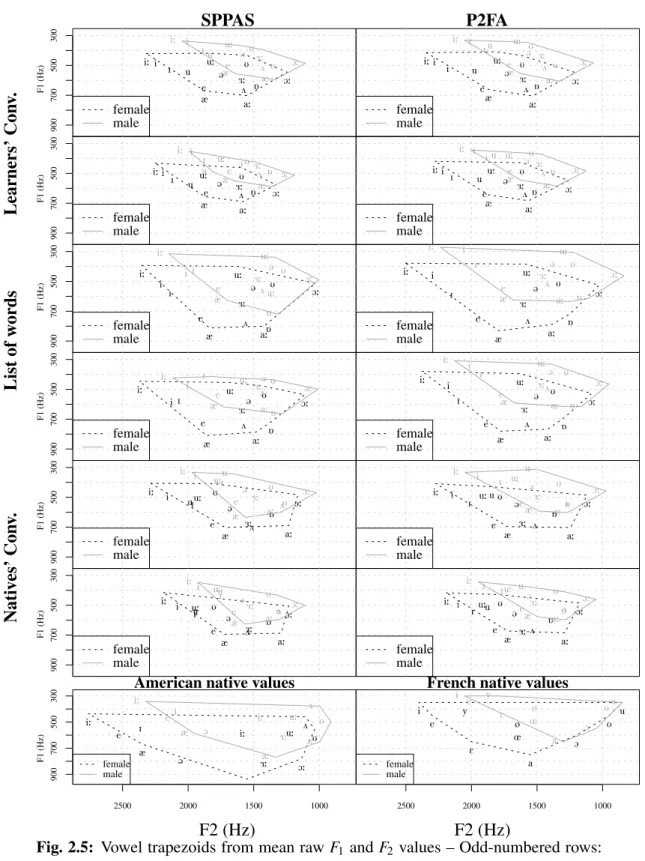
2.5 Vowel trapezoids from mean raw F1and F2values . . . 79
2.6 Per-centile, per-phoneme mean F1& F2standard deviations . . . 83
2.7 Optimal centiles . . . 85
2.8 Per-centile SDs across corpora . . . 86
2.9 Per-session types and tokens . . . 87
2.10 Native types and tokens . . . 88
2.11 Per-phoneme lexical distribution . . . 89
2.12 Scatterplot of the mid-temporal F1& F2standard deviations of monophthongs against their number of occurrences. Black: SPPAS-aligned data; grey: P2FA-aligned data; top panel: main learners’ corpus; bottom panel: natives’ subcorpus. . . 94
2.13 Counts and proportions of gated phonemes (P&B) . . . 98
2.14 Counts and proportions of gated phonemes (subcorpus) . . . 100
2.15 Per-method, per-session means of gated phonemes . . . 101
2.16 Contrast distances against the vowel space . . . 104
3.1 Per-session, per-speaker vocalic trapezoids . . . 109
3.2 Native speakers’ vocalic trapezoids . . . 111
3.3 Per-session VISC . . . 112
3.4 OODs against syllable types . . . 114
3.5 Differences in OODs . . . 116
3.6 Standard deviations of OODs against syllable types and tokens . . . 118
3.7 Differences in OOD SDs . . . 119
3.9 Counts of optimal k-values . . . 126
3.10 KNN: per-phoneme proportion of correct labels . . . 128
3.11 Classification accuracy against numbers of occurrences . . . 131
3.12 Learners’ confusion matrices for KNN classification . . . 132
3.13 Multiplot: TTRs and response variables . . . 141
3.14 Means of the 4 response variables . . . 144
3.15 Plots of the mean fitted response variables . . . 150
3.16 Example of BDM-normalized F1 and F2 formant tracks (dots) with the superimposed DCT-smoothed signal (lines). . . 154
3.17 Cosine-waves and DCT-smoothing . . . 156
3.18 DCT coefficients and differences with native values . . . 158
3.19 Inter- and intra- phoneme proportions of phonemes for k0, k1and k2. . . 162
3.20 Per-session, per-speaker evolution of k0and k1 . . . 164
3.21 Proportions of accurate identification by QDA . . . 168
3.22 Proportions of accurate identification by QDA . . . 169
3.23 Per-speaker, per-session proportions of accurate predictions by QDA . . . . 172
3.24 QDA proportions of accurate predictions . . . 173
A.1 Map task for Session 4 . . . 193
E.1 Distribution of vowel durations in the reading tasks . . . 218
E.2 Native standard deviations of OODs against syllable types and tokens . . . 219
E.3 Mean differences of OOD standard deviations . . . 220
E.4 KNN: per-phoneme proportion of correct labels . . . 221
E.5 Corrected response variables . . . 222
E.6 Explanatory graph for the DCT proportions . . . 224
1.1 Summary of the participants’ metadata . . . 10
1.2 Summary of the participants’ chosen tasks for Sessions 1 & 2 and individual recording durations. . . 15
1.3 Summary of tier names, sources and dependencies . . . 24
1.4 Correspondences between the different transcription systems . . . 26
1.5 Summary of the subcorpora data . . . 35
1.6 Counts of SPPAS-aligned phonemes succeeding “the” and “to” . . . 41
1.7 Counts of P2FA-aligned phonemes succeeding “the” and “to” . . . 43
1.8 Correspondences between the different transcription systems (shortened version) . . . 46
1.9 Table of skeletal syllabic structures . . . 48
1.10 Minimum and maximum vowel durations (in seconds) . . . 58
1.11 Linear models of speech rate . . . 60
1.12 Summary of speech rates . . . 63
2.1 Per-phoneme minimal formant SDs and centile location . . . 84
2.2 Specificities of normalization methods . . . 96
3.1 Example of 10 folds for the female British speakers . . . 127
3.3 Most frequently predicted phonemes . . . 133
3.4 Number of occurrences of /I/, /i:/, /U/ and /u:/ in the dataset of words common to both the main corpus and the NSS. . . 139
3.5 Working hypotheses and statistical models . . . 147
3.6 Per-phoneme, per-response variable results of the multimodel comparisons. AICcWt: weight of evidence; p-value: p-value of the Shapiro-Wilk test carried out on the residuals of the fitted models. . . 148
3.7 Dispersion coefficients for each vowel and each DCT coefficient . . . 160
3.8 Models subjected to the QDA . . . 166
3.9 Prior probabilities of the sex-specific datasets . . . 167
E.1 Confusion matrix of the last pass of the KNN algorithm on the British female natives (NSS). . . 219
E.2 Per-phoneme, per- log-transformed response variable results of the multi-model comparisons. AICcWt: weight of evidence; p-value: p-value of the Shapiro-Wilk test carried out on the residuals of the fitted models. . . 223
Roman Symbols m Median ˆ y Predicted value Greek Symbols µ Mean σ Standard deviation Acronyms / Abbreviations
AIC Akaike Information Criterion
BDM Bark Difference Metric
CCI Control/Compensation Index
CMUPD Carnegie Mellon University Pronouncing Dictionary DNV Distance to Native Values
EPD English Pronouncing Dictionary
HSD Honest Significance Difference
IPA International Phonetic Alphabet
KNN k-Nearest Neighbours
LDA Linear Discriminant Analysis LMER Linear Mixed Effects Regression
LPD Longman Pronunciation Dictionary
MCP Mean Centile Product MoA Manner of Articulation
NLMe Native Language Magnet Theory expanded nPVI normalized Pairwise Variability Index
NSS Native Speakers’ Subcorpus
OC Optimal Centile
OOD Onset-to-Offset Distance
P2FA Penn Phonetics Lab Forced Aligner
PoA Place of Articulation
PVI Pairwise Variability Index
QDA Quadratic Discriminant Analysis
RP Received Pronunciation
SAMPA Speech Assessment Methods Phonetic Alphabet
SCP Sigma Centile Product
SL Source Language
SPPAS SPeech Phonetization Alignment and Syllabification
TAD Theory of Adaptive Dispersion
TL Target Language
TRP Time Reference Point
TTR Type/Token Ratio
VISC Vowel-Inherent Spectral Change VOT Voice Onset Time
The main purpose of this study is to compare the acquisition over time by French students of two English phonological contrasts, /i:/-/I/ and /u:/-/U/. The data used consist of recordings of task-driven spontaneous conversations between French learners of English
from Université Paris Diderot and American or British assistants as part of the LONGDALE
project (Goutéraux (2013)). 11 learners were recorded over three sessions at six-month intervals, and 12 learners over four sessions, also at six-month intervals. The approach adopted is resolutely quantitative and data-driven. An automatic process, based on two aligners, the SPeech Phonetization Alignment and Syllabification (SPPAS, Bigi (2012b), Bigi & Hirst (2012)), and the Penn Phonetics Lab Forced Aligner Toolkit (P2FA, Yuan & Liberman (2008)), was designed to extract information for all the vowels pronounced by the learners, not only the four phonemes, /I/, /i:/, /U/ and /u:/, under study. The extracted data for each vowel contains extra-linguistic, linguistic and acoustic information, available in two 92,000 × 542 spreadsheets (one for each aligner). The procedure of data extraction was also applied to three subcorpora: two subcorpora from recordings of the 12 learners who took part in all four sessions, with read lists of English words on the one hand, and a text read in French on the other; and another subcorpus of spontaneous conversations of native English speakers.
This brief introductory chapter has three aims: (i) to situate our investigation among the dominant frameworks in Second Language Acquisition (SLA); (ii) to discuss the perspective
followed to analyse our data; (iii) to outline how the chapters of this work partially contribute to the analysis of the interlanguage.
Theories in SLA
The source language (SL) of this study, French, features vowels, /i/ and /u/, which theories in Second Language Acquisition call “similar” (c.f. in particular Flege (1995), Flege (2005)) to these two contrasts. The French learners’s task, represented in figure 1, therefore consists in dissassociating the two contrasts in the Target Language (TL). Such a parallel process, such a phonological symmetry between the SL and the TL make it possible to
/i:/ /i/ /I/ /u:/ /u/ /U/ FRENCH ENGLISH
Fig. 1: Parallelism in the phonemic structures of the two contrasts
validate, or invalidate, the predictions of most SLA models, which only factor in phonemic structures when assessing the difficulty of acquisition. These models traditionally posit prosodically bijective predictions, whereby acquiring a given prosodic level in a target language is correlated to the structures of that same prosodic level already accessible to the learner. For phonemes, this is the case with models such as Kuhl et al. (2008) Native Language Magnet Theory expanded (henceforth, NLMe), or Flege (1995) Speech Learning Model (SLM), or Best (1995) Perceptual Assimilation Model (PAM). In the case at hand here, the predictions of such models form the Null Hypothesis, and can be formulated in the following way:
H0: no differences exist in the acquisition of the two contrasts
/i:/-/I/ and /u:/-/U/.
The potential influence of extra-phonemic parameters such as phonemic or lexical frequency, syllabic structure, phonological neighbourhood, the existence and number of minimal pairs, etc., is therefore generally not taken into account. However, outside the field of SLA, formalizations of inter-level interactions exist: for instance, exemplar theories (Pierrehumbert (2001), Bybee (2007), Bybee (2010)) relate phonemic pronunciation to frequency of use; prosodic positions have been shown to influence the realization of phonemes (Keating et al. (2004)); syllabic structure and places of articulation have been shown to be connected (Tabain et al. (2004)); phonemic processing and speech-errors likewise depend upon phonological neighbourhood density and clustering coefficients (the similarities between phonological neighbours, Chan & Vitevitch (2010)).
Main purposes
The original goals of the study were therefore twofold: to establish whether the /I/-/i:/ and /U/-/u:/ contrasts followed the same patterns of acquisition; and to establish whether extra-phonemic parameters might play a role in that acquisition. It is particularly in order to provide an answer to this second question that the nature and the purpose of this work evolved. In the process of fine-tuning the PRAAT (Boersma (2001)) scripts that generated the TextGrids from which the data was extracted, and as the quantity of collected information kept growing and growing, the nature of the research evolved from a perhaps more classic, results-driven, purpose-oriented study to one concerned with methods of processing and visualizing information. The unique nature of the extracted data, being altogether longitudinal, conversational and focused on vocalic realizations, demanded that specific methods of treatment and visualization be devised.
By being longitudinal, the collected information makes it possible to trace the various steps of the evolution of the learners’ interlanguage, and more specifically of the quality of their vocalic realizations. Positing the existence of an “interlanguage” implies the existence of a transition between multiple states. These states have been investigated for consonants (c.f. e.g.Strik et al. (2007) for an example with computer assisted language learning), disfluences (Brand & Götz (2013)) or prosody (c.f. e.g. Trouvain & Barry (2007)), but less frequently for vowels (c.f. Gnevsheva (2015)). Longitudinal studies are particularly appropriate to unveil the properties of interlanguage, but such studies on learners’ pronunciations are rare: Abrahamsson (2003) investigated the evolution of the production of Swedish codas by three Chinese learners in conversational speech, and demonstrated a U-shaped curve of acquisition. The present focus on vocalic realizations, also in conversational speech, challenges the possibility of resorting to the same methods of acoustic analyses as those used in experiments based on recorded lists of words. A lot of production studies focusing on vowel realizations thus resort to embedding the vowels in controlled consonantal environments such as /hVd/ (c.f. e.g. Hillenbrand et al. (1995), Ferragne & Pellegrino (2010), Clopper et al. (2005)) in order to minimalize and predict the potential influence of the consonants on the vowels’ formants values.
Along the way, and because of the unique combination of features (longitudinal, con-versational and on vocalic realizations), the purposes of the study therefore mutated, from an SLA contribution to proposals on how to visualize, process and analyze the complex, multi-layered data. Some of the major concerns this study of learners’ vocalic realizations tries to address are the following: to provide reproducible protocols for the investigation of vocalic realizations on the basis of recordings; to determine the best processing treatments of acoustic data that make it possible to retain the maximum amount of information while preserving the specificities of conversational speech; to design methods of concisely and effectively representing longitudinal data for several speakers.
The philosophy of this work is resolutely neutral and unassuming, and based on a quanti-tative, data-driven approach. The methods used to process the information are compared to one another with the sole purposes of clarity and computational efficiency – not of obtaining results, not of rejecting or accepting the Null Hypothesis.
Chapter content
Chapter 1 details the procedures used to extract information from the original recordings; specifies what sort of information was collected; provides the explanations why these types of data were collected; and attempts to assess the quality of the extraction for the parts of the data which are not directly related to the phonemic categories of vocalic realizations. Chapter 1 is the answer to the original question whether extra-phonemic parameters might play a role in the acquisition of the phonemic contrasts /I/-/i:/ and /U/-/u:/. Do different prosodic categories, such as syllable or words, permeate interlanguage? To find out, syllables and words also had to be aligned by the two aligners used, and collected for each vocalic realization collected. With the potentially infinite variety of consonantal environments pertaining to conversational speech, some sort of control had to be introduced too. This goal led to the retrieval of formant values at each centile of the vowels’ durations, in keeping with theories such as vowel inherent spectral change (VISC, Nearey & Assmann (1986), Morrison & Nearey (2006), Hillenbrand (2012), Morrison (2012)) or mathematical transformations of the raw signal in Hertz such as discrete cosine transforms (DCT, Harrington (2010)). But in order to distinguish, within the formant values, what exactly pertained to natural formant transitions from what might pertain to interlanguage, bases for comparison, i.e. native references, were needed. This realization led in turn to the creation of the native subcorpus, using the same procedure as the one applied to the main corpus and the two
LONGDALE subcorpora. In an attempt to assess the quality of the automatic alignment
the datasheets are investigated, along with the natures of the syllabic structures. These are verified and compared to the pronouncing dictionaries used by the aligners and the algorithm designed in this work. Finally, a study of the durations of the vowels and of speech rate aims at assessing the quality of both the extraction and the learners’ discourses.
Chapter 2 sets out to determine whether certain aspects of interlanguage independent from speakers’ idiosyncrasies exist – more specifically, whether cross-speaker patterns of acquisition of the two /I/-/i:/ and /U/-/u:/ contrasts exist. It begins by ensuring that the formant values on all centiles are within reasonable ranges. In keeping with studies of vowel inventories, such as Al-Tamimi & Ferragne (2005) or Gendrot & Adda-Decker (2007), how the phonemes are distributed in the vocalic trapezoid is investigated, and compared with native both French and English native values. The length of the /I/-/i:/ and /U/-/u:/ vectors is measured against the convex hulls linking the outermost vowels in the F1/F2space. The
skewness in the distribution of the phonemic categories is then also surveyed, based on the assumption that the gaps in the frequencies of occurrences between the different vocalic categories is very likely to exert influence on the learners’ interlanguage. This observation led to a comparison of the various methods of normalization, in order to find out which suits best a dataset with uneven number of occurrences across the phonemic categories.
The acquisition of a language being often a very different experience from one learner to another, chapter 3 focuses on trying to specify the evolution of the interlanguage of each of the 12 speakers who took part in all four sessions of the LONGDALEproject. The theory of
VISC is applied to the main corpus and to the native subcorpus, and the lengths of the learners’ vectors starting at 20% of the vowels’ durations, and ending at 80% in the F1/F2 vocalic
space are compared to their native counterparts. In a further attempt to assess the states of acquisition, the robustness of the findings are tested by looking at the standard deviations of the vectorial values. With a growing body of evidence pointing to actual differences in the acquisition of the four phonemes under study, a machine learning classification method,
the k-nearest neighbours, was run on the main corpus, with a native dataset from Peterson & Barney (1952) used as the training set. Confusion matrices are then investigated, more specifically the phonemic distributions of the predictions for /I/, /i:/, /U/ and /u:/. This experiment making it hard to visualize the longitudinal evolution of the interlanguage, a study using linear mixed-effects regressions was then carried out. The formant values and their standard deviations served as response variables, and the effect of session, i.e. the evolution over time, was investigated. Models predicting several sorts of changes were compared, and the acquisition of the four phonemes showed different evolutions. Finally, the entire signals for the first three formants were modelled using DCTs, and comparisons were there again made with native values. The dispersions of /U/ and /u:/ were greater, and the acquisition of /u:/ in particular seemed to be less robust than those of the other phonemes. The chapter ends on an ultimate comparison of models based on mid-temporal formant values on the one hand, and on DCTs on the other. From this comparison, one of the strongest recommendations of this work is formulated – that DCTs are particularly appropriate for the study of conversational data.
Corpus and Data
This chapter details the procedure implemented to obtain the data which is analyzed in chapter 2.
1.1
Corpus
Subsection 1.1.1 describes the profile and background of the participants of the study. Subsection 1.1.2 details the content and characteristics of the recordings.
1.1.1
Participants and metadata
25 participants, 20 women and 5 men, were recorded between September 2009 and May
2013 as part of the LONGDALEproject (Goutéraux (2013)). Metadata was collected from
a form the participants filled in themselves. There are two sets of participants, all of them students from Université Paris Diderot.
The first set comprises students, 8 females and 2 males, who completed three sessions. The second set is made up of the students, 10 females and 3 males, who attended all four recording sessions. Of lesser interest perhaps, but still worthy of note, is the fact that students whose ID number are inferior to 110 were recorded in September 2009 for Session 1, June
Table 1.1: Summary of the participants’ metadata
Student ID Sex Number of sessions Native languages Days spent in ESC
DID0014 Male 4 French, Vietnamese 37
DID0020 Female 3 French 380
DID0024 Female 4 French 7
DID0035 Female 4 French 7
DID0039 Female 4 French 0
DID0062 Female 4 French 14
DID0068 Male 4 French 14
DID0071 Female 4 French 44
DID0096 Female 4 French 35
DID0106 Female 4 French 44
DID0108 Female 4 French 3
DID0119 Female 3 French 30
DID0126 Female 3 French 400
DID0127 Female 3 French 7
DID0128 Female 4 French 7
DID0129 Female 3 French 7
DID0135 Female 4 French 7
DID0138 Female 3 French 270
DID0145 Female 3 French 30
DID0146 Female 3 French 30
DID0156 Male 3 French, Greek 30
DID0168 Male 4 French 14
DID0213 Male 3 French 450
or November 2010 for Session 2, April 2011 for Session 3, and May 2012 for Session 4. Students with ID numbers superior to 110 were recorded one year later: in September 2010 for Session 1, October 2011 for Session 2, April 2012 for Session 3 and finally May 2013 for Session 4.
All students were beginning a three-year course in English at Université Paris Diderot at the time of recording of their first session. This was a second course or a minor for three participants: student DID0213’s major was history; student DID0138 had obtained a Bachelor in biology; and student DID0035, a Master in sociology.
None of the participants reported proficiency in any other language than French or English, except student DID0156 who reported Greek as her native language, along with
French; and student DID0014, who reported Vietnamese and French as native languages, and said he spoke French, Vietnamese and English at home. The number of days spent in an English-speaking country (ESC) was also collected after each session, but reported numbers did not change between the first and the last session.
Two students, DID0128 and DID0213, took the Test of English as a Foreign Lan-guage (TOEFL), and reported a score of 107/120 and 111/120 respectively. Other students (DID0014 and DID0024) reported scores without mentioning what test or examination they had been taking. Table 1.1 summarizes the participants’ metadata.
1.1.2
Recordings and tasks
All 82 interviews were recorded in an individual stereo 16-bit resolution sound file at a sampling rate of 44100 Hz captured in an uncompressed, pulse code modulation format using an Apex435 large diaphragm studio condenser microphone with cardioid polar pattern. They all begin with an interview of the learner conducted by a native speaker. The learner was then presented with a task which changed with the session (cf. below). The native speaker and the learner each had a microphone, and were recorded on a separate channel, although some crossover between the two channels happened (e.g. the interviewer’s utterances were recorded on the interviewee’s channel). The interviews were not conducted in a deaf room: the quality therefore varied greatly from one recording to another, or from one moment during the interview to another, with background noises such as footsteps, cars or distant chatter sometimes audible. The recordings lasted 656 seconds on average, with great per-speaker and per-session variability, as shown in figure 1.1. The comparatively shorter aggregated duration for Session 4 displayed in figure 1.1b can be explained if we recall the lower number of participants for that session: 13 students, against 25 for all other three sessions. However, too much importance should not be granted to total recording durations. Section 1.2 will present a more accurate assessment of learners’ actual speaking time and speech rate.
S001 S002 S003 S004 400 600 800 1000 1200 1400 1600 Recording durations (s.) Session 1 Session 2 Session 3 Session 4
(a) Medians and quartiles of recording durations. S001 S002 S003 S004 Recording durations (s.) 0 5000 10000 15000 Session 1 Session 2 Session 3 Session 4 (b) Recording durations.
Fig. 1.1: Aggregated per-session summary of recording durations.
Tasks and questions asked changed at each session. The design of the tasks and questions replicated those of the Louvain International Database of Spoken English Interlanguage (LINDSEI, Brand & Kämmmerer (2006)).
Sessions 0 & 2
In session 1 and 2, participants were to answer one of the three following questions: 1. Suppose you have time and money to travel or move to a different country/city, where
will you go? Why? How will you organise your new life?
2. Can you tell me about an important event, experience or meeting which has made a difference or changed your life in the past six months?
3. Do you feel creative? Tell me about a work of art you would like to create or participate in: a play, a film, a musical event, a book, a painting, a computer game, etc. How
would you go about it?
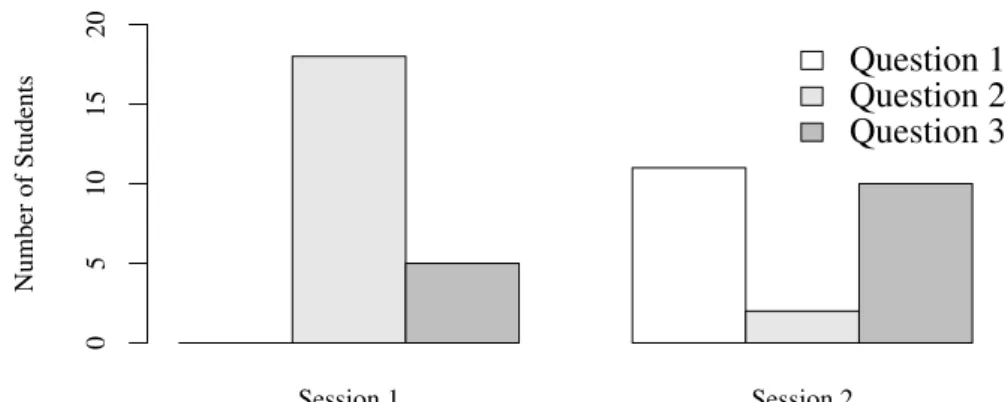
Figure 1.2 shows how many students selected one of the three possible subjects in the two sessions. Question 2 was overwhelmingly chosen in Session 1, only to be discarded in
Session 1 Session 2 Number of Students 0 5 10 15 20 Question 1 Question 2 Question 3
Fig. 1.2: Number of students who chose to answer questions 1, 2 or 3 in Sessions 1 & 2.
Session 2. Besides, out of the 5 students who chose task 3 (“Do you feel creative?”) in Session 1, only one, DID0062, answered the question. The other four spoke of a film they had seen, and therefore failed to answer the question in a relevant manner. The same mistake did not happen again with any of the 10 students (who sometimes turned out to be the same, in the case of speakers DID0035, DID0106, DID0119 & DID0128) whose chose to answer that question in Session 2. This fact may serve as an indication of a certain improvement in understanding tasks formulated in English after a year at university studying the language.
Session 3
In session 3, the interviewers were requested to read the following prompt:
You are going to see four works of art (paintings), one after the other. I’d like you to react to
each of them quite spontaneously and tell me how you feel about them.
They were also given the following optional additional questions:
• Can you justify, explain why you like or dislike picture one, two, three, four? • Which of these four pictures would you like to have at home, in your room?
• If you were to take one of those pictures to illustrate a book you want to write, which one would you choose?
The four paintings they were to describe were shown to the participants in the following order1:
1. Carnation, Lily, Lily, Rose, by John Singer Sargent (1885-1886). 2. Nude, Appledore, Isle of Shoals, by Childe Hassam (1913). 3. Carcass of Beef, by Chaim Soutine (1925).
4. The Garden, by Andreas Schulze (2009).
Recordings of Session 3 were the longest on average: they lasted 704 seconds, against 452s., 607s. and 694s.2 for Sessions 1, 2 and 4 respectively. Student DID0020’s interview in Session 3 was by far the longest (1571s.): student DID0024’s fourth session, the second longest recording in the corpus, lasted 1200s., i.e. it was 5 minutes shorter.
Session 4
In session 4, the participants had to perform a map task as designed by Anderson Anderson et al. (1991). Figure A.1 in section A.1 shows the two maps that were given to the learner and the native speaker. The maps share common landmarks, but some of these landmarks are unique to each map. The map that was given to the learner contains an itinerary, with a starting point and a finishing point. The native speaker was given the map without the itinerary. This informational gap aimed at eliciting questions from the learner.
Of interest also for this study are the extra reading tasks the learners were given at the end of this session. The students were asked to read lists of words featuring all the vowels in English. These words were grouped according to the vowels they contained. They were also asked to read a short text in French. Both this list and the text in French can be found in Appendix A. The recordings of the 13 students who completed these tasks have also been analyzed, and the acoustic information extracted from the text in French and the list of
1Three of the four paintings that were presented are copyrighted and may not be reproduced here.
2All means were calculated using the respective number of participants in each session, i.e. 25 in all
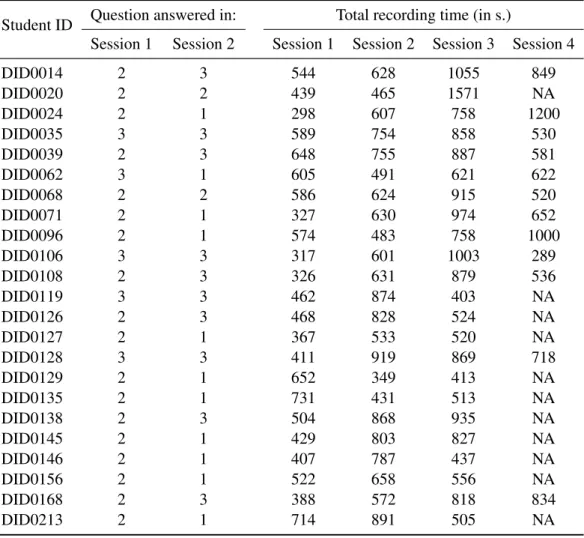
Table 1.2: Summary of the participants’ chosen tasks for Sessions 1 & 2 and individual recording durations.
Student ID Question answered in: Total recording time (in s.)
Session 1 Session 2 Session 1 Session 2 Session 3 Session 4
DID0014 2 3 544 628 1055 849 DID0020 2 2 439 465 1571 NA DID0024 2 1 298 607 758 1200 DID0035 3 3 589 754 858 530 DID0039 2 3 648 755 887 581 DID0062 3 1 605 491 621 622 DID0068 2 2 586 624 915 520 DID0071 2 1 327 630 974 652 DID0096 2 1 574 483 758 1000 DID0106 3 3 317 601 1003 289 DID0108 2 3 326 631 879 536 DID0119 3 3 462 874 403 NA DID0126 2 3 468 828 524 NA DID0127 2 1 367 533 520 NA DID0128 3 3 411 919 869 718 DID0129 2 1 652 349 413 NA DID0135 2 1 731 431 513 NA DID0138 2 3 504 868 935 NA DID0145 2 1 429 803 827 NA DID0146 2 1 407 787 437 NA DID0156 2 1 522 658 556 NA DID0168 2 3 388 572 818 834 DID0213 2 1 714 891 505 NA
English words serves as reference for native formant values and phonological knowledge of the target language respectively.
Finally, in all sessions, the students were asked questions about their personal and academic projects, and, from Session 2 onwards, what they thought about the course they had been following.
Table 1.2 lists the questions the learners chose to answer in sessions 1 & 2, as well as the duration of each recording. A per-speaker graphical representation of these durations can be found in figure 1.3. DID0014 DID0020 DID0024 DID0035 DID0039 DID0062 DID0068 DID0071 DID0096 DID0106 DID0108 DID0119 DID0126 DID0127 DID0128 DID0129 DID0135 DID0138 DID0145 DID0146 DID0156 DID0168 DID0213 0 500 1000 1500 2000 2500 3000 Session 1 Session 2 Session 3 Session 4
Fig. 1.3: Per-speaker recording durations.
1.2
Workflow
The purpose of this section is to detail the method that was implemented in order to obtain the final database. Section 1.2.1 presents the procedure from the original sound files to the final multitier TextGrids. The main script to generate the data is described in section 1.2.2;
the resulting TextGrids are presented in section 1.2.3; details for the final .csv spreadsheet can be found in section 1.2.4.
1.2.1
Global procedure
The goal to reach when designing the alignment process was to obtain a high number of automatically aligned transcriptions in an efficient way. One key aspect was that aligners naturally work best with native speech. It was therefore critical that alignment errors due to learners’ mispronunciations should be contained. It was decided that the best course would be to feed the aligners as short extracts as possible in order to minimize the risk of a domino effect, whereby an alignment error might spread and create other errors in the extract.
The initial documents consisted of the original recordings and their transcriptions. The transcriptions were compliant with the requirement of the LONGDALEproject, and contained
XML-like tags that flagged events such as speakers’ turns, overlapping speech, whispers, laughter. Transcribers had also been instructed to mark certain aspects of pronunciation such as pauses or “the” pronounced /i:/. The exact guidelines can be found in Appendix B. The following paragraphs present the procedure for a single recording. The procedure is also summarized visually in figure 1.4.
First a Python script (later, a more efficient Perl script) edited out all tags, punctuation marks and pronunciation-related flags, and formatted the text so that lines contained no more than 80 characters. The corresponding recording was then downsampled to 16kHz. The reason is that the two aligners used, the SPeech Phonetization Alignment and Syllabification (SPPAS, Bigi (2012b), Bigi & Hirst (2012)), and the Penn Phonetics Lab Forced Aligner Toolkit (P2FA, Yuan & Liberman (2008)), both require 16kHz sampling (P2FA recommends 11kHz but accepts 16kHz). The sound file was therefore downsampled from 44kHz to 16kHz using Sox (Bagwell (2018)), and then opened in Audacity (version 2.1.0), where a Label Track was created. It was then played in Audacity, and a label was added at the end of
Original Recording
Original Transcription SOX
AUDACITY scriptPerl
Label Tracks
Bash script
Edited
Labels Edited Tran-scription
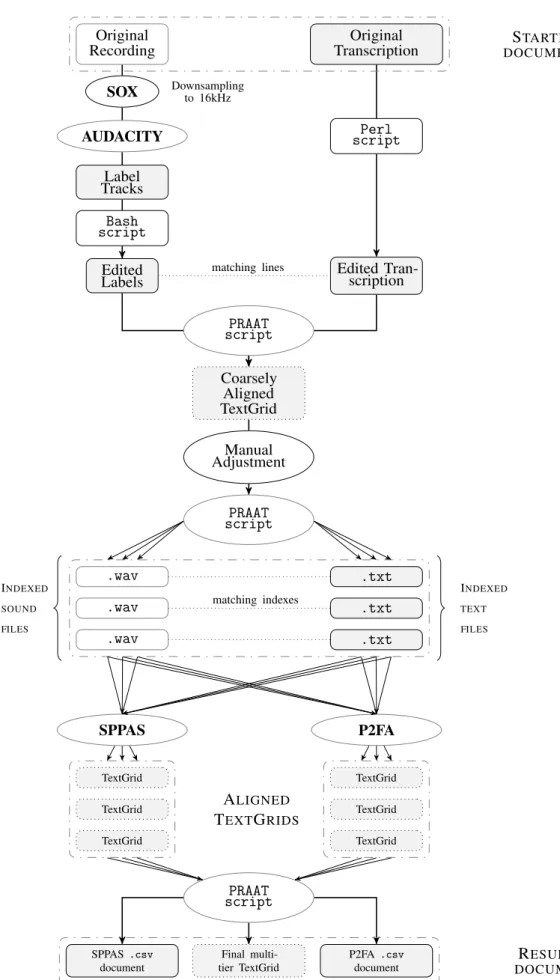
PRAAT script Coarsely Aligned TextGrid Manual Adjustment PRAAT script .wav .txt .wav .txt .wav .txt SPPAS P2FA TextGrid TextGrid TextGrid TextGrid TextGrid TextGrid PRAAT script SPPAS .csv document Final multi-tier TextGrid P2FA .csv document INDEXED SOUND FILES INDEXED TEXT FILES matching indexes matching lines Downsampling to 16kHz ALIGNED TEXTGRIDS STARTING DOCUMENTS RESULTING DOCUMENTS
Fig. 1.4: Flow chart from the original LONGDALErecordings and transcription files to the final .csv spreadhseet and multitier TextGrid.
every 80-character line. The labels were then exported in Audacity to a two-colum textfile containing the time stamps corresponding to each line of the transcription file. Another Python script (later a far simpler bash line) deleted one column along with any labels that may have been added while listening to the file. At that stage, two files had been obtained: the 80-character transcription file, and the label file with the time stamp. The latter contained exactly one line less than the former. Both files were then fed to a Praat script (Boersma & Weenink (2013)), which created a TextGrid. Version 5.4.08 was used to perform the calculations. The script (PRAAT01) added boundaries at times matching the time stamps from the label file, and labeled the newly created interval with the corresponding line from the transcription file. This yielded a coarsely aligned TextGrid, which was then manually edited: the recording and the TextGrid were opened in Praat, and boundaries were added or adjusted manually. Boundaries were added with the two following concerns: (i) to select speech which was likely to be correctly aligned; (ii) to obtain reasonably short sequences. Noisy parts, extreme overlapping speech, non-existing expressions, grunts, coughs, fits of
0 1 2 3 4 0.0 0.2 0.4 0.6 0.8 N=24100 Bandwidth = 0.05213 Recording durations (s.) Density
laughter, were therefore labeled as non-exploitable in the TextGrid, and boundaries were added, sometimes in the middle of sentences. When adding a boundary, the spectrogram was visible. More often than not, mid-sentence boundaries mark the beginning of easily recognizable phonemes, especially voiceless plosives or fricatives. Boundaries were added with no considerations of meaning or syntax. The average duration of these intervals over the whole corpus is 0.95 second, and 24,398 such intervals were created and processed. The maximum duration of their corresponding sound files is 3.69 seconds. Figure 1.5 shows the kernel density plot of the durations of these short manually aligned intervals. Figure 1.6
DID0014 DID0020 DID0024 DID0035 DID0039 DID0062 DID0068 DID0071 DID0096 DID0106 DID0108 DID0119 DID0126 DID0127 DID0128 DID0129 DID0135 DID0138 DID0145 DID0146 DID0156 DID0168 DID0213
Aggregated recording durations (s.)
0 500 1000 1500
Session 1 Session 2 Session 3 Session 4
Fig. 1.6: Per-speaker aggregated durations of extracted speech.
shows the aggregated duration of the learners’ speech actually extracted and analyzed, i.e. with pauses, backchanneling, grunts, laughter and the interviewer’s own speech, removed. These durations correspond to the sum of the length of each short .wav file for each speaker in each session. At that point, the TextGrid has three tiers: one for the learner’s transcription, one for the native speaker’s, and an empty tier. Once this lengthy procedure was over, the newly adjusted TextGrid and the original recording were fed into another Praat script
(PRAAT02), which did two things: (i) it created a sound file and a corresponding transcription file for each selected interval in the main file. The transcription file is a simple .txt file containing the label of its matching interval in the main TextGrid. Both the sound file and this transcription file were put in a subfolder. Intervals corresponding to non-exploitable passages were left aside; (ii) each pair of .txt and sound file was indexed with the number of the interval in the main file they corresponded to. After the completion of the script, the subfolder therefore contained as many short .txt and sound files as intervals selected for analysis in the main TextGrid.
The next step was to align these transcriptions with their sound files automatically. The first aligner used was SPPAS. The version used for processing the files was v1.7.0. One setting was modified from default, Syllabification, in which an interval tier was used, “PhnTokAlign”, and not the default “TokensAlign”. This was to ensure syllabic alignment on the phonemic tier, not on the word tier. SPPAS takes .txt and .wav files as input and returns PRAAT TextGrids with tier intervals aligned on phonemic and syllabic boundaries. For syllabic alignment, SPPAS uses an algorithm based on a set of rules which ranks phoneme classes according to their likelihood to be in onset or coda position. However, as v1.7.0 did not ship with an algorithm for English syllables3, the built-in list of rules for French was adapted for English phonemes. The modification can be checked in section C.3 in appendix C. The reasoning underlying these changes is that French syllabic structures may have an effect on English realizations at the phonemic level. Having SPPAS syllabify learners’ utterances using its own built-in algorithm for French provides the means to test this assumption. The syllabifying processes are explained in more detail in section 1.6. Once the subfolder was processed, it contained a merged TextGrid with tiers for phonemes, syllables and words. The second aligner used in this study was P2FA (v1.002), which is based on version 3.4 of the Hidden Markov Model Toolkit (HTK, Young et al. (2006)). Just like SPPAS, P2FA uses a
3Earlier versions did, but unfortunately syllabification in English cannot work with rules that only access
the phonemic level. One simple example can show this: “present” (v.) ⇒ /pri."zent/ – “present” (adj.) ⇒ /"prez.@nt/.
.txt file (but with a capitalized transcription) and a .wav file as inputs. A simple bash script:
(i)capitalized the transcription files; (ii) downsampled the sound files; and (iii) ran P2FA in the entire subfolder. P2FA returns a TextGrid with word and phoneme alignment for each sound file.
Finally, another homemade4PRAAT script (PRAAT03) performed the following things:
(i)it reintegrated the merged SPPAS TextGrid and the P2FA TextGrid into the original main TextGrid (from which the short intervals had been extracted); (ii) parsed the SPPAS and P2FA phonemic tiers and collected acoustic information (cf. section 1.2.3 below) about each phoneme; (iii) retrieved the pronunciation of each word from the Longman Pronunciation Dictionary (LPD, Wells (2008)); (iv) created dedicated syllabic tiers, a process described in the next section 1.2.2.
This workflow was applied to all 82 recordings. 92,332 SPPAS-aligned and 92,059 P2FA-aligned vowels5were automatically extracted. The next subsections detail the process of extraction: section 1.2.2 describes the structure of PRAAT03; the structure of the Praat multitier TextGrid obtained is described in section 1.2.3; the dataframes and their headers are detailed in section 1.2.4.
1.2.2
PRAAT03
All the data collected for analysis in the following chapters comes from script PRAAT03. This section explains how the script works in detail.
PRAAT03 has three6main loops: (i) loop 1 parses the TextGrid file names in the subfolder; retrieves the index, contained in those names, which matches the interval number in the main TextGrid; selects the SPPAS merged TextGrids and the P2FA TextGrids; copies and pastes their boundaries and labels to the main file at the indexed interval number; deletes
4“Homemade” is not perfectly accurate. A lot of inspiration was drawn from Mietta Lennes’s scripts,
especially in terms of what could be done.
5The reasons why the total count of vowels differ between SPPAS and P2FA are explained below.
micro-intervals (i.e. intervals with durations inferior to 0.001 second caused by tiny variations in interval timing when extracting and concatenating the short files from and to the main file). (ii) the second loop scans the SPPAS-aligned phonemic tier of the multitier TextGrid created in the first loop; retrieves its pronunciation in the LPD for each phoneme at the beginning of a word; looks for English syllable boundaries in the succeeding phonemes; adds a syllable boundary on the specifically added dedicated tier if the phoneme is the syllable coda; identifies whether the current phoneme is the syllable nucleus, i.e. whether it is a vowel; if so, a .csv textfile is appended with information of a form extensively presented in Appendix D and explained in section 1.2.4. (iii) the third loop is the P2FA version of the second loop. The only significant difference is that the French syllable tier had to be inferred from its SPPAS-generated counterpart.
The script adds 9 tiers – i.e. tiers which were not created by the aligners and imported from the shorter TextGrids: for both aligners, the English syllable tiers, the LPD pronunciation syllable tiers and the stress tiers (referred to below as the “English syllable tiers”). For P2FA, the French syllable tier is inferred from the SPPAS French syllable tier. Finally, the Pairwise Variability Indices (PVI) tiers, which fuse adjacent consonants and vowels together regardless of syllable or word boundaries. The order of creation varies: the English syllable tiers are created at run-time, and so is the P2FA French syllable tier. However, this tier requires SPPAS tiers to have been created prior to its creation, which explains why the loop dedicated to SPPAS tiers must take place before the loop dedicated to P2FA tiers. The consonantal and vocalic intervals for the PVI tiers are calculated for each main TextGrid after completion of the two aligners’ loops. Table 1.3 summarizes the origin of each tier and what their dependencies are. Word and phoneme tiers were aligned by the aligners’ internal algorithms. English syllable and stress tiers are created in PRAAT03, with boundaries aligned on the LPD syllabic transcriptions. PVI tiers essentially consist in duplicating the phonemic tiers of the two aligners and then merging adjacent intervals featuring the same manner
Table 1.3: Summary of tier names, sources and dependencies
Tier Number Tier Name Boundary Source Dependencies
1 Student Manual None
2 Assistant Manual None
3 Empty N/A N/A
4 P2FA: phonemes P2FA Student
5 P2FA: words P2FA Student
6 P2FA: FS PRAAT03 SPPAS: FS
7 P2FA: ES PRAAT03 P2FA: phonemes
8 P2FA: LPDS PRAAT03 P2FA: ES
9 P2FA: Stress PRAAT03 P2FA: ES
10 SPPAS: phonemes SPPAS Student
11 SPPAS: words SPPAS Student
12 SPPAS: FS SPPAS SPPAS: phonemes
13 SPPAS: ES PRAAT03 SPPAS: phonemes
14 SPPAS: LPDS PRAAT03 SPPAS: ES
15 SPPAS: Stress PRAAT03 SPPAS: ES
16 PVI: SPPAS PRAAT03 SPPAS: phonemes
17 PVI: P2FA PRAAT03 P2FA: phonemes
of articulation (reduced to vowels or consonants only). The French syllable tiers feature crucial differences, from one aligner to the other, in the way they were generated. Compared to P2FA, SPPAS features an extra syllabifying algorithm based on a set of user-definable rules (c.f. section C.3). The SPPAS-aligned French syllable tier was generated from the default French rules provided with SPPAS, but modified to remove sounds specific to French (e.g. nasal vowels), and to include specifically English sounds (e.g. interdental fricatives or /h/). The list of English phonemes, converted from the list of French phonemes natively provided by SPAAS, can be found in section C.3. The P2FA-aligned French syllable tier was generated by PRAAT03 from the SPPAS-aligned French syllable tier. To understand how it was generated, a closer look at how the data was collected is necessary. The rough outlines of the process and the obstacles that were encountered are explained in the paragraph below.
The acoustic parameters used to extract the pitch, the formants and the intensity are standard: they follow the recommendations of the PRAAT manual. The code (c.f. section C.4) used to generate pitch, formant and intensity values is sex-dependent. For pitch analysis, the
WORDTIER
PHONEMETIER
FRENCHSYLLABLETIER
ENGLISHSYLLABLETIER
C1 C2 V1 C3 V2 C4 ...
WORD
CCV CVC
CCVC VC
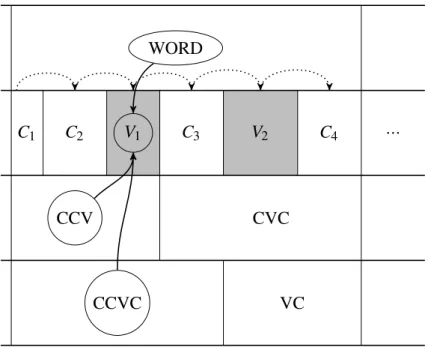
Fig. 1.7: Representation of the intervals scanned (dotted arrows) by PRAAT03 on the phonemic tier for either aligner (SPPAS or P2FA). When a vowel is parsed (grey rectangles), the corresponding labels of the other tiers are retrieved (circled nodes), and the aligner’s dataframe is appended. Cxand Vxindex consonants and vowels respectively.
time step was set to 0; the pitch-floor, to 75 Hz for men, 100 for women; the pitch ceiling was set to 300 Hz for men, 500 Hz for women. In formant analyses, the time step was also set to 0; the maximum number of formants per frame was 5; the maximum frequency was set to 5,500 Hz for women, and 5,000 Hz for men; the window length was kept at its default value of 0.025 second, with a pre-emphasis of 50 Hz.
This paragraph7focuses on the processes taking place in loops (ii) (for SPPAS) and (iii) (for P2FA), briefly described above, and presents some of the coding obstacles that were encountered. The procedure common to both aligners is symbolically represented in fig-ure 1.7. Each interval on a given aligner’s phonemic tier is parsed by PRAAT03. The moment when a given phoneme is scanned in either loop is defined as the Time Reference Point (henceforth, TRP). Data collection, i.e. the appending of the aligner’s .csv dataframe, takes place when the currently parsed phoneme is a vowel. This entails that a lot of calculations are made on the first phoneme of a given word, e.g. its duration, its CELEX frequency, its
numbers of syllables in French, in the LPD or in the aligner’s dictionary. Syllabification in particular has to be carried out before the nucleus is parsed, even though syllable boundaries have not yet been created in the TextGrid: each vowel, i.e. each datapoint, must include the total number of syllables contained in the word it appears in (columns LPDSC and SC, c.f. section 1.2.3). As the word’s phonemes get parsed, i.e. as the TRP moves forward from one
Table 1.4: Correspondences between the different transcription systems
IPA LPD SPPAS P2FA
/æ/ & { AEx /e/ e E EHx /I/ I I IHx /@/ @ @ AH0 /6/ Q A AAx /2/ V V AHx /U/ U U UHx /i:/ i: i: IYx /u:/ u: u UWx /3:/ œ: 3:r ERx /A:/ A: A AAx /O:/ O: O: AOx /aI/ aI aI AYx /aU/ aU aU AWx /eI/ eI eI EYx /OI/ OI OI OYx /I@/ I@ Ir IHxR /e@/ e@ Er EHxR /U@/ U@ Ur UHxR /D/ D D DH /T/ T T TH /N/ N N NG /S/ S S SH /tS/ tS tS CH /Z/ Z Z ZH /dZ/ dZ dZ JH /j/ j j Y
interval to the next, PRAAT03 must identify whether the current phoneme is a coda, in order to create a boundary on the TextGrid. This process is made more complicated by two factors: (i)the differences in transcription systems, shown in table 1.4. These differences require checks for matches between transcription systems to be made, since English syllabification is indicated by the LPD transcription, but parsed phonemes are transcribed in either SAMPA or ARPAbet8. (ii) the variations in numbers of syllables, often caused by the diverging degrees of rhoticity between the British (LPD) and American (SPPAS & P2FA) dictionaries. This
8This issue is compounded by the fact that stress and syllabification in the LPD transcription are indicated
issue is discussed in greater detail in section 1.6.2. Code-wise, the key to align syllables correctly is to identify both syllabic nuclei and codas, regardless of how they are transcribed. This identification was harder with vowels than with consonants, but variations happened with the latter too: intervocalic /t/ and /d/ are flapped in the CMUPD used by SPPAS (e.g. “water” is transcribed /w O: 4 3:r/, /"wO:R@~/, with “4” indicating a flap, but the /t/ is not
transcribed as flapped in either the LPD or the CMUPD used by P2FA). With such hurdles, errors are likely - and happened. Section D.4 lists all the words whose vowels9feature differ-ent numbers of syllables between the LPD and the aligner’s CMUPD, listed in the LPDSC and
the SC columns (c.f. section 1.2.3): 1,45010monophthongs have syllable count mismatches
in the SPPAS-generated dataset, with 1,318 monophthongs in the P2FA-generated dataset. These two figures account for 2.18% and 2.05% of the total number of monophthongs as aligned by SPPAS and P2FA respectively. More details about these mismatches can be found in section 1.6.
The next two sections present the resulting documents (c.f. figure 1.4) generated by PRAAT03: first, the multitier TextGrid, then the .csv spreadsheets based on the SPPAS and
P2FA alignments.
1.2.3
The multitier TextGrid
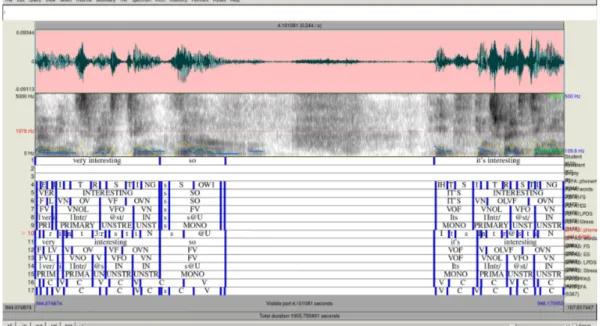
This section lists the 17 tiers of the final TextGrids generated by PRAAT03. These final TextGrids are aligned with the original recordings of the students in each session. Figure 1.8 is a screenshot of a short section of one of the 102 final TextGrids after running SPPAS, P2FA and PRAAT03.
The 17 tiers respectively correspond to: (i) Transcription of the learner’s speech / the short interval extracted with PRAAT02. (ii) Transcription of the native speaker’s speech.
The string retrieved by PRAAT03 from the dictionary therefore contained metaphonemic information which needed to be both stored (for syllable placement) and dispensed with (for phoneme parsing and matching).
9More precisely, monophthongs, since the focus of this work is on monophthongs.
(iii) Empty tier. Tiers 4 to 9 are P2FA-aligned mirrors of SPPAS-aligned tiers 10 to 15:
(iv) P2FA-aligned phonemic tier. (v) P2FA-aligned word tier. (vi) P2FA-aligned French
syllabic tier with manners of articulation (MOA) – based on the SPPAS algorithm for French syllables (V=vowel, O=occlusives, F=fricatives, N=Nasals, G=Glides). classes (C=consonants, V=vowel). (vii) P2FA-aligned English syllabic tier, using the same MOA-based transcription. (viii) LPD-MOA-based phonetic transcription of the current P2FA-aligned syllable. (ix) Stress of the current P2FA-aligned syllable (Primary/secondary/tertiary stress, unstressed or monosyllabic). (x) SPPAS-aligned phonemic tier. (xi) SPPAS-aligned word tier. (xii)SPPAS-aligned French syllabic tier with manners of articulation. (xiii) SPPAS-aligned English syllabic tier. (xiv) LPD-based phonetic transcription of the current SPPAS-aligned syllable. (xv) Stress of the current SPPAS-aligned syllable. (xvi) SPPAS-aligned consonantal and vocalic intervals (regardless of word and syllable boundaries); this tier is to calculate pairwise variability indices. (xvii) P2FA-aligned consonantal and vocalic intervals. The first, second and third tiers are the exact same as those from the main original TextGrid. The first tier is therefore the one that was adjusted manually, and the one from which the shorter sound files and TextGrids to be used by the two aligners were extracted. The numbers of intervals of this tier correspond to header REFINT in the final dataframes (c.f. section 1.2.4): with possible differences in transcriptions and syllable counts from one of the three dictionaries to another, these intervals are the only truly firm basis on which cross-comparisons between the two aligners can be made: they are a necessary (but more often than not, not sufficient) condition to the accurate retrieval of a given vowel in a given recording. Word and phonemic tiers (i.e. tiers 4 & 5 for P2FA, and 10 & 11 for SPPAS) are imported straight from the TextGrids created by the aligners, and merged into the main TextGrid. All other tiers are created by PRAAT03, although at different moments in the script (c.f. section 1.2.2). If we exclude tiers 2 & 3, which are neither affected by PRAAT03 nor useful for the current purpose of our analyses, 1 tier out of 14 preexisted PRAAT03 (tier 1), 3 were imported from SPPAS
Fig . 1.8: Section of the final multitier T extGrid after running SPP AS, P2F A and PRAAT03 .
(the phoneme tier, the word tier, the French syllable tier), 2 from P2FA (the phoneme and word tiers), and the rest were created by PRAAT03 based on the aligners’ boundaries.
The reasons why these tiers were created are given in section 1.4, and the error-prone obstacles that were encountered are described in section 1.6.
1.2.4
The generated dataframes
Section D.1 gives the names of the 542 columns of the two final dataframes. There is one dataframe for each aligner, but the names of the columns are common to the two files, in order to make comparisons, and script-writing, easier. This section explains the content of each column.
The first dataframe is based on SPPAS-aligned data, which was extracted from tiers 10 to 15 of the multitier TextGrid (c.f. section 1.2.3 and figure 1.8). Likewise, the second dataframe is based on P2FA-aligned data, extracted from tiers 4 to 9 of the multitier TextGrid. Each dataframe is the end result of a dedicated loop in PRAAT03: the second loop in the case of SPPAS-aligned data, the third loop for P2FA-aligned data (c.f. section 1.2.2). The two dataframes are interchangeable: their only difference is the aligner used to extract the data, with all the changes this entails, especially with respect to the aligner-dependent transcription method. Because transcriptions vary (c.f. section 1.4 for details), the safest way to cross-reference data between the two dataframes (i.e. to ensure the correct retrieval of a given vowel in a given word in a given recording) is by using the very last column of both dataframes, REFINT, which indexes the interval number of the first tier in the multitier TextGrid: recall from section 1.2 that this number corresponds to the short TextGrids from
which alignment was accomplished, and which the two aligners therefore have in common. The first four columns (SPEAKER, SEX, SESSION, and WORD) are self-explanatory – WORD corresponds to the label of the interval of the SPPAS-aligned word tier at the current
TRP11.The fifth column, CLXFREQ, gives the frequency of use of the word as mentioned in CELEX2 (Baayen et al. (1995)). Column LPDPRON gives the transcription of the LPD pro-nunciation of the word; the next column, PRON, the propro-nunciation of the word in the aligner’s transcription method. LPDSC and SC indicate the word’s number of syllables according to the transcription of the LPD or of the aligner respectively. Likewise, columns 10 & 11, LPDPHONEME and PHONEME, list the phoneme (i.e. the vowel) being scanned. The next six
columns provide data on the syllable structure the phoneme is the nucleus of: columns 13 (ESYLLSTRUC), 15 (ECVSTRUC) & 17 (ESKELS) deal with English syllables, whereas columns 14 (FSYLLSTRUC), 16 (FCVSTRUC) & 18 (ESKELS) deal with French syllables. xSYLLSTRUC columns encode the manner of articulation of the syllable’s phoneme in the following fash-ion: “O” for “occlusives”, “F” for “fricatives”, “N” for “nasals”, “G” for “glides”, “L” for “liquids” and “V” for vowels (e.g. “strings” would be encoded as “FOLVNF”). xCVSTRUC columns subsume all consonantal MoAs under a “C” category (e.g. “strings” would be
encoded as “CCCVCC”). Finally, xSKELS12 columns compounds all adjacents “Cs” into a
single “C” (e.g. “strings” would be encoded as “CVC”, i.e. a closed syllable). Whether the vowel’s syllable is stressed is shown in STRESS; STRESS can be of values “MONO” for monosyllabic words, “PRIMARY” if the syllable carries the primary stress, “SECONDARY” and “TERTIARY” for secondary and tertiary stresses, or “UNSTRESSED”. Column 20, PHONDUR, measures the vowel’s duration. The next one, LOCINFILE, locates the
begin-ning of the SPPAS vowel interval, while INTNB corresponds to the interval number of the phoneme’s interval on the phoneme tier. INTENSITY gives the mean intensity of the SPPAS-aligned vowel from 10% of the vowel’s duration to 90%. In the next eight columns, six give the preceding (PHONBEFORE) and succeeding (PHONAFTER) phonemes, along with their MoAs(BEF/AFTMOA), PoAs(BEF/AFTPOA) and voice features. Columns 25 & 30, PRECOART and POSTCOART address coarticulatory effects: if the vowel is preceded or succeeded: (i) by
11Recall that the TRP is the beginning of the interval on the phonemic tier which is currently scanned by
PRAAT03 (c.f. section 1.2.2 for more details).