HAL Id: inserm-00433012
https://www.hal.inserm.fr/inserm-00433012
Submitted on 17 Nov 2009HAL is a multi-disciplinary open access archive for the deposit and dissemination of sci-entific research documents, whether they are pub-lished or not. The documents may come from teaching and research institutions in France or abroad, or from public or private research centers.
L’archive ouverte pluridisciplinaire HAL, est destinée au dépôt et à la diffusion de documents scientifiques de niveau recherche, publiés ou non, émanant des établissements d’enseignement et de recherche français ou étrangers, des laboratoires publics ou privés.
Relationships of job and some individual characteristics
to occupational injuries in employed people: a
community-based study.
Ashis Bhattacherjee, Nearkasen Chau, Carmen Otero Sierra, Bernard Legras,
Lahoucine Benamghar, Jean-Pierre Michaely, Apurna Kumar Ghosh, Francis
Guillemin, Jean-François Ravaud, Jean-Marie Mur, et al.
To cite this version:
Ashis Bhattacherjee, Nearkasen Chau, Carmen Otero Sierra, Bernard Legras, Lahoucine Benamghar, et al.. Relationships of job and some individual characteristics to occupational injuries in employed people: a community-based study.. Journal of Occupational Health, Japan Society for Occupational Health, 2003, 45 (6), pp.382-91. �inserm-00433012�
J Occup Health 2003; 45: 382–391
Journal of
Occupational Health
Relationships of Job and Some Individual Characteristics to
Occupational Injuries in Employed People: A Community-Based
Study
Ashis B
HATTACHERJEE1, Nearkasen C
HAU2, Carmen O
TEROS
IERRA2, Bernard L
EGRAS3,
Lahoucine B
ENAMGHAR2, Jean-Pierre M
ICHAELY2, Apurna Kumar G
HOSH1,
Francis G
UILLEMIN4, Jean-François R
AVAUD5, Jean-Marie M
UR2and Lorhandicap Group
1Department of Mining Engineering, Indian Institute of Technology, Kharagpur, India, 2National Institute for
Health and Medical Research (Inserm), U 420, IFR25-RFRH, Réseau Fédératif de Recherche sur le Handicap, Faculté de Médecine, 3Laboratoire d’Informatique Médicale, Faculté de Médecine, 4EA 3444, Ecole de Santé
Publique, Faculté de Médecine and 5Inserm U 502, CERMES, IFR25-RFRH, Réseau Fédératif de Recherche sur
le Handicap, Campus CNRS, France
Abstract: Relationships of Job and Some Individual Characteristics to Occupational Injuries in Employed People: A Community-Based Study: Ashis BHATTACHERJEE, et al. Department of Mining
Engineering, Indian Institute of Technology, K h a r a g p u r, I n d i a —T h i s s t u d y a s s e s s e d t h e
associations of job and some individual factors with occupational injuries among employed people from a general population in north-eastern France; 2,562 workers were randomly selected from the working population. A mailed auto-questionnaire was filled in by each subject. Statistical analysis was performed with loglinear models. The annual incidence rate of at least one occupational injury was 4.45%. Significant contributing factors for occupational injuries were job category (60.8%), sex (16.2%), regular psychotropic drug use (8.5%), age groups (7.5%), and presence of a disease (7.0%). The men had higher risk than the women (adjusted odds-ratio 1.99, 95% CI 1.43–2.78). Compared to executives, intellectual professionals and teachers, labourers had the highest risk (6.40, 3.55– 11.52). They were followed by farmers, craftsmen and tradesmen (6.18, 2.86–13.08), technicians (3.14, 1.41– 6.70), employees (2.94, 1.59–5.48) and other subjects (3.87, 1.90–7.88). The young (≤29 yr) showed an increased risk. Similar odds–ratios were observed for regular psychotropic drug use (1.54, 1.16–2.05) and the presence of a disease (1.50, 1.11–2.02). Univariate analysis showed that smoking habit, overweight and excess alcohol use were also associated with injuries. The loglinear model results showed that there were
Received May 6, 2003; Accepted Sep 18, 2003
Correspondence to: N. Chau, INSERM U420, Faculté de Médecine, BP 184, 54505 Vandœuvre-lés-Nancy, France
associations between some of these independent factors. It was concluded that job, sex, young age, smoking habit, excess alcohol use, overweight, psychotropic drug use, and disease influenced the occupational injuries. Preventive measures concerning work conditions, risk assessment and job knowledge should be conducted in overall active population, especially in men, young workers, smokers, alcohol users, overweight workers and in individuals with a disease or psychosomatic disorders.
(J Occup Health 2003; 45: 382–391)
Key words: Occupational injury, Job, Sex, Age,
Overweight, Diseased people, Smoking habit, Alcohol use, Psychotropic drug use, Employed people
Occupational injuries have severe consequences for workers and society (disabilities, lost of working time, medical care, etc.)1–3). In France, the annual incidence of occupational injuries with sick leave was about 4.4% in 1996 to 2000 for the “Régime général de sécurité sociale”. There are many hazards and causes,4) and their roles have been hardly documented. The severe consequences of the occupational injuries pointed out the importance of epidemiological knowledge for determining appropriate preventive measures.
First, there have been only a few statistics on the incidence of occupational injuries for the overall active general population. In France, the available statistics concern only the “Régime général de sécurité sociale” and some specific systems (agricultural system for example). It is useful to know the incidence for the overall active population, the differences amongst various job categories, sexes and other characteristics of the subjects.
It is known that occupational injuries are mainly caused by work conditions5, 6), especially the environment, tasks, work organisation, and lack of training which result in lack of know-how and job knowledge. Nevertheless, certain individual factors which concern many employed people such as young age7–11), body weight12, 13), lack of training14), lack of experience9, 15), smoking14, 16–19), alcoholic drink consumption18, 20), sleep disorders11, 13, 21–26), and some disabilities27), have been identified as risk factors for occupational injuries. Although prevention measures are mainly concerned with the work conditions, the knowledge of jobs at risk and the related risk factors could help occupational physicians to make workers, who are exposed to higher risk, more sensitive to the injury risks during the yearly medical examination. In this context, a limited number of investigations have been conducted which were concerned with some particular populations (construction workers, railway employed people, drivers, etc.). It was not certain whether these factors play a role only for certain jobs or professional activities or, on the contrary, they also play a role in the overall active population. Such knowledge is important because it shows that preventive measures concerning these factors can be carried out for all professional activities and not limited to certain sectors only. It is also important to investigate psychotropic drug use and the presence of diseases as they could increase the risk of occupational injuries by decreasing physical and mental abilities, especially at work26).
The present study aimed at assessing the relationships of job, sex, young age, smoking habit, alcohol use, psychotropic drug use (for headache, tiredness, anguish and sleeping pills), and diseases to the incidence of occupational injuries in the overall active population from the Lorraine (north-eastern France). In addition, we would like to show that the loglinear model can be used to compute the odds ratios and the contributions of various factors, and to assess the multiple interactions between these variables.
Materials and Methods
Subjects
The sample consisted of all the people aged 15 or more from 8,000 households (family or person living alone) randomly selected from the Lorraine community (north-eastern France, 2.3 millions inhabitants). The selection of the households was made from those possessing a telephone.
Study design
Before the survey, a campaign was conducted for a period of three months with the help of the media (television, journals, radio) to make the population sensitive to the survey. The investigation had received a favourable view from the “Commission Nationale
d’Informatique et des Libertés”, and written consent from the participants.
The study protocol included: (1) a request of participation by means of a questionnaire to ascertain the number of people in the household, then (2) sending out standardised auto-questionnaires with a covering letter and a pre-paid envelope for reply, then (3) sending a solicitation letter without a questionnaire, and finally (4) sending questionnaires with a covering letter and a pre-paid envelope. These communications were addressed to the households at one month intervals. When the number of individuals was unknown, two questionnaires were sent first, and a complementary one was sent later. The standardised auto-questionnaires were filled in by the subjects themselves. Adolescents were free to ask their parents or tutors if they did not understand some questions. The questionnaires included: sex, birth date, height, weight, job coded according to the INSEE classification28), smoking habit, excess alcoholic drink consumption with the DETA questionnaire (including four items: (i) consumption considered as excessive by the Table 1. Distribution (%) according to gender and age of the sample studied and of the Lorraine general population30)
The sample The Lorraine studied general population No. of subjects 6,214 1,848,579 Percentage of women 52.4 51.5 Men No. of subjects 2,962 896,683 Age (yr) 15–19 6.4 10.2 20–29 17.3 20.5 30–39 22.0 19.8 40–49 17.2 16.1 50–59 12.8 13.7 60–69 14.6 11.8 70–79 8.9 5.2 80 or over 2.0 2.6 Women No. of subjects 3,252 951,896 Age (yr) 15–19 5.7 9.1 20–29 20.2 18.5 30–39 19.4 18.6 40–49 15.4 14.4 50–59 12.0 13.1 60–69 14.9 13.0 70–79 9.4 7.5 80 or over 3.2 5.8
384 J Occup Health, Vol. 45, 2003
subject himself/herself, (ii) by people around the subject, (iii) wish to reduce consumption, and (iv) consumption on waking; excess consumption was defined by at least two positive responses out of these four items)29), various diseases diagnosed by the physician, regular psychotropic drug consumption (for headache, tiredness, anguish, sleeping pills), and the presence of at least one occupational injury during the two-year period before the survey (the questionnaires were filled in by the subjects between May and July 1996). Occupational injury was defined as damage to the body, whatever may be its severity, which resulted from an accident at work with sick leave of at least one day in addition to the day when the accident occurred and for which the subject got compensation. A two-year period was chosen to have a sufficient number of occupational injuries.
Among the 8,000 households included in the sample, 193 (2%) commnications were lost (due to wrong address or death). Of the 7,807 households contacted, 3,460 (44.3%) participated (one subject at least), out of which in 86% of cases every member of the family participated. Altogether, 6,214 subjects filled in a questionnaire. The distributions of the sample gathered according to age and sex are close to those of the Lorraine population30) (Table 1). This study only concerned the individuals who had been employed at the time of the survey, that is 2,833 subjects out of 6,214.
Statistical analysis
The variables studied were: sex, job, age, body mass index, smoking habit, excess alcohol use, regular psychotropic drug use, presence of a disease, and presence of at least one occupational injury during the two-year period considered. Age was categorised into 4 groups:
≤29, 30–39, 40–49, ≥50 yr; body mass index (BMI) into
three groups: ≤19, 20–24, ≥25 kg/m2; jobs into six groups: executives, intellectual professionals and teachers; labourers (salaried persons with manual jobs in production for an employer); employees (salaried persons who work in offices, administration, shops, or for private individuals, without management responsibility); farmers, craftsmen and tradesmen; technicians and others. All other variables were dichotomised: smoking habit (smokers including current and ex-smokers, non-smokers), excess alcohol use (yes, no), regular psychotropic drug use (yes, no), all diseases combined (at least one disease, no disease), and occupational injury (presence, absence).
The occupational injury data were cross-classified according to the variables of interest. The data presented in the form of a multidimensional contingency table were analysed by examining all the two dimensional tables which can be arrived at by summing up the other variables, but this may lead to misleading conclusions that could be drawn about the data. The analysis of a
multidimensional contingency table was primarily aimed at investigating the statistical associations of the variables of interest. In addition, the strength of association between two or more variables can also be measured. While explaining a contingency table the variations in the observed cell counts can be attributed to main and interaction effects of the different variables. In this study, the log-linear model was investigated as a statistical representation of the contingency table to quantify the relative importance of various factors and to detect occasions where the effects of these factors could be presumed to be real or merely random variations31–34). The loglinear model for the contingency table is expressed as follows:
Log (expected cell frequency)
=Grand mean + Main effects parameters + Second and higher order interactions.
As the number of dimensions of a contingency table increases the number of possible models also increases, so that some procedures are clearly needed to indicate which models may prove reasonable for the data set and which are likely to be inadequate. One such procedure is to examine the likelihood-ratio Chi-square values of all effects in the saturated loglinear model. The other approach is to examine the standardised parameter values in the saturated loglinear model. These values may indicate which parameters may be excluded and consequently which unsaturated models may be worth considering. The odds ratios of different factors were computed based on the second order interaction parameters of the significant factors34). All statistical tests were made with significance level p=0.05. All the analyses were performed with the SPSS program35).
Results
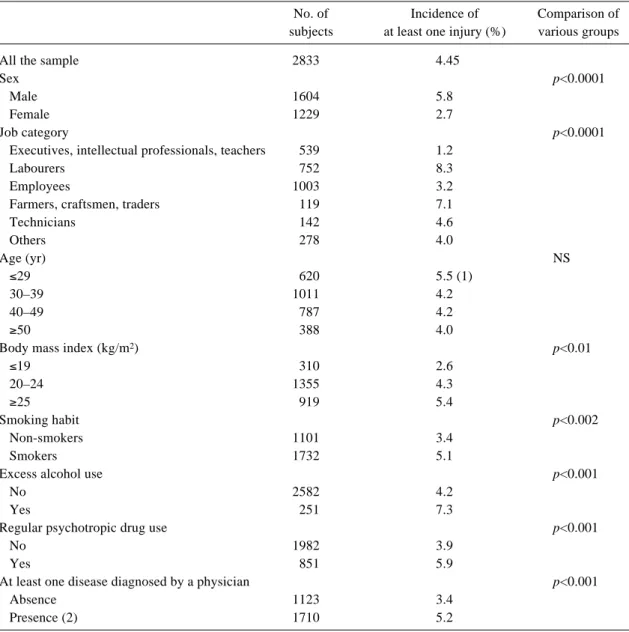
The annual incidence rate of at least one occupational injury was 4.45%. Table 2 provides the incidence rate according to various factors. Significant differences were observed between men and women, various job categories, body mass index groups, smokers and non-smokers, excess alcohol users and limited users, the people suffering from a disease and the healthy subjects, and between the individuals who regularly used a psychotropic drug and the others.
Table 3 presents the effects of the main and second order interaction terms of the saturated loglinear model run and the partial association of each of the effect terms, the third order and higher order interaction terms being non-significant. Further, the model run showed that the second order interaction parameters INJURY*ALCOHOL, INJURY*BMI and INJURY*SMOKE were not significant and the interaction term INJURY*AGE was close to significance (p=0.07). As it is a saturated loglinear model, the goodness of fit statistic revealed that the value
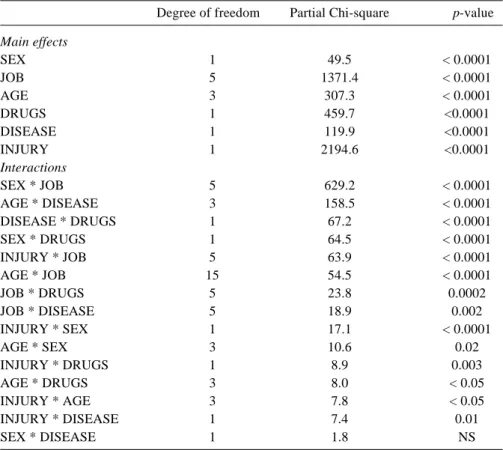
of the Chi-square statistic is as expected: always 0 with a significance level of 1. Finally, the model retained was the unsaturated model including all the main effects of the six variables INJURY, AGE, SEX, JOB, DISEASE and DRUGS and all their two-way interaction terms (Table 4). All terms were significant (p<0.05) except SEX*DISEASE. In the unsaturated model obtained, the goodness of fit statistic revealed that the resulting likelihood ratio (Chi-square value) of 316.97 has an observed significance level of 0.51. Since the significance level is large we can consider it to be an acceptable model for this study. Overall the factors job category, age,
disease, and psychotropic drug use were associated with each other. The job category appeared to be the major factor contributing to occupational injuries (60.8%) followed by sex (16.2%), whereas psychotropic drug use, age and disease had similar and much lower contributions (8.5, 7.5, and 7.0% respectively).
Table 5 shows the estimated parameter values of the final model as well as the adjusted odds ratios (OR) for the various risk factors. It was observed that, compared with the women, the men had an OR of 1.99 (95% CI 1.43 to 2.78). Amongst the various job categories, the labourers and farmers, craftsmen and tradesmen had the Table 2. Annual incidence of at least one occupational injury-according to various risk factors
No. of Incidence of Comparison of subjects at least one injury (%) various groups
All the sample 2833 4.45
Sex p<0.0001
Male 1604 5.8
Female 1229 2.7
Job category p<0.0001
Executives, intellectual professionals, teachers 539 1.2
Labourers 752 8.3
Employees 1003 3.2
Farmers, craftsmen, traders 119 7.1
Technicians 142 4.6 Others 278 4.0 Age (yr) NS ≤29 620 5.5 (1) 30–39 1011 4.2 40–49 787 4.2 ≥50 388 4.0
Body mass index (kg/m2) p<0.01
≤19 310 2.6 20–24 1355 4.3 ≥25 919 5.4 Smoking habit p<0.002 Non-smokers 1101 3.4 Smokers 1732 5.1
Excess alcohol use p<0.001
No 2582 4.2
Yes 251 7.3
Regular psychotropic drug use p<0.001
No 1982 3.9
Yes 851 5.9
At least one disease diagnosed by a physician p<0.001
Absence 1123 3.4
Presence (2) 1710 5.2
(1) The difference from subjects aged 30 or over was significant with p<0.05. (2) The prevalences of various diseases were: musculoskeletal disorders (44.9%), cardiovascular diseases (10.9%), scoliosis and cyphosis (10.8%), respiratory diseases (6.7%), mental disturbances (2.5%), diabetes (3.4%), nervous system diseases (1.5%), genito-urinary diseases (1.6%), carpal tunnel (2.8%), cancers (0.8%), other diseases (1.2%)
386 J Occup Health, Vol. 45, 2003
Table 3. Saturated loglinear model run for occupational injury and various risk factors (n=2,562) Degreee of Partial likelihood-ratio
p-value freedom Chi-square Main Effects SEX 1 49.1 < 0.0001 JOB 5 1295.4 < 0.0001 AGE 3 291.2 < 0.0001 BMI 2 714.3 < 0.0001 SMOKE 1 124.3 < 0.0001 ALCOHOL 1 2018.1 < 0.0001 DRUGS 1 410.9 < 0.0001 DISEASE 1 127.9 < 0.0001 INJURY 1 2008.8 < 0.0001 Interactions SEX * JOB 5 505.8 < 0.0001 SEX * BMI 2 228.8 < 0.0001 AGE * BMI 6 146.6 < 0.0001 AGE * DISEASE 3 127.7 < 0.0001 SEX * DRUGS 1 77.2 < 0.0001 DISEASE * DRUGS 1 56.8 < 0.0001 INJURY * JOB 5 52.4 < 0.0001 SMOKE * ALCOHOL 1 52.1 < 0.0001 AGE * JOB 15 52.0 < 0.0001 SEX * ALCOHOL 1 46.9 < 0.0001 SEX * SMOKE 1 44.8 < 0.0001 JOB * DRUGS 5 22.0 0.0005 JOB * DISEASE 5 20.2 0.001 DISEASE * ALCOHOL 1 16.9 < 0.0001 BMI * DISEASE 2 13.3 0.001 SMOKE * DRUGS 1 10.5 0.01 JOB * SMOKE 5 9.2 NS INJURY * DRUGS 1 8.8 0.003 AGE * SEX 3 8.3 0.04 SEX * DISEASE 1 8.1 0.004 BMI * SMOKE 2 7.4 0.02 AGE * DRUGS 3 7.2 NS INJURY * AGE 3 7.2 NS BMI * JOB 10 7.1 NS INJURY * DISEASE 1 6.6 0.01 INJURY * SEX 1 6.4 0.01 AGE * SMOKE 3 5.1 NS JOB * ALCOHOL 5 4.4 NS AGE * ALCOHOL 3 3.0 NS INJURY * BMI 2 2.7 NS INJURY * ALCOHOL 1 2.1 NS INJURY * SMOKE 1 1.7 NS BMI * DRUGS 2 1.5 NS SMOKE * DISEASE 1 0.2 NS BMI * ALCOHOL 2 0.1 NS DRUGS * ALCOHOL 1 0.1 NS
JOB: job category, BMI: body mass index, SMOKE: smoking habit, DRUGS: regular psychotropic drug use, ALCOHOL: excess alcohol use. The third order and higher order interactions are not shown as they were not significant. The subjects with at least one missing value (9.6%) were eliminated.
Table 4. Final unsaturated loglinear model with six retained variables (n=2,562) Degree of freedom Partial Chi-square p-value Main effects SEX 1 49.5 < 0.0001 JOB 5 1371.4 < 0.0001 AGE 3 307.3 < 0.0001 DRUGS 1 459.7 <0.0001 DISEASE 1 119.9 <0.0001 INJURY 1 2194.6 <0.0001 Interactions SEX * JOB 5 629.2 < 0.0001 AGE * DISEASE 3 158.5 < 0.0001 DISEASE * DRUGS 1 67.2 < 0.0001 SEX * DRUGS 1 64.5 < 0.0001 INJURY * JOB 5 63.9 < 0.0001 AGE * JOB 15 54.5 < 0.0001 JOB * DRUGS 5 23.8 0.0002 JOB * DISEASE 5 18.9 0.002 INJURY * SEX 1 17.1 < 0.0001 AGE * SEX 3 10.6 0.02 INJURY * DRUGS 1 8.9 0.003 AGE * DRUGS 3 8.0 < 0.05 INJURY * AGE 3 7.8 < 0.05 INJURY * DISEASE 1 7.4 0.01 SEX * DISEASE 1 1.8 NS
JOB: job category, DRUGS: regular psychotropic drug use, ALCOHOL: excess alcohol use.
Table 5. Relationships between presence of at least one injury and various risk factors: estimated parameter values, adjusted odds ratios, and 95% CI calculated with loglinear model (n=2,562)
Estimated parameter Odds ratio, 95% CI
Male vs female 0.69 1.99‡ 1.43 – 2.78
Job category(1):
Labourers 1.85 6.40‡ 3.55 – 11.5
Employees 1.08 2.94‡ 1.59 – 5.48
Farmers, craftsmen, tradesmen 1.81 6.18‡ 2.86 – 13.1
Technicians 1.14 3.14† 1.41 – 6.70 Others 1.35 3.87‡ 1.90 – 7.88 Age(2): ≤29 yr 0.53 1.70* 1.07 – 2.72 30–39 yr 0.13 1.14 0.73 – 1.78 40–49 yr 0.08 1.08 0.68 – 1.72
Psychotropic drug use vs the others 0.43 1.54† 1.16 – 2.05
Diseased vs the others 0.41 1.50† 1.11 – 2.02
*: p < 0.05, †: p<0.01, ‡: p<0.001, (1) vs executives, intellectual professionals and teachers, (2) vs ≥50 yr.
388 J Occup Health, Vol. 45, 2003
highest risks (OR of about 6) in reference to the executives, intellectual professionals and teachers. People aged 29 or younger were found to be prone to occupational injuries (OR 1.70, 95% CI 1.07 to 2.72, compared with those aged 50 or more). Subjects who regularly consumed psychotropic drugs and those who suffered from a disease had ORs of 1.54 (95% CI 1.16 to 2.05) and 1.50 (95% CI 1.11 to 2.02), respectively.
Discussion
The present study shows that although the occupational injuries affected all categories of workers, the men, the young subjects, the smokers, the workers with excess alcohol use, individuals who regularly used psychotropic drugs, and workers suffering from a disease had increased risk of occupational injuries. Labourers, farmers, craftsmen and tradesmen had a six times higher risk and employees and technicians had a three times higher risk than executives, intellectual professionals and teachers. This is an original study on workers from a large geographic area.
This study shows that a loglinear model can be used for analysing cross-tabulated data due to the multifactorial nature of the causes of occupational injuries6, 31–34). It shows that it is appropriate to begin the analysis with the saturated model, then with unsaturated models by eliminating the non-significant terms. It may be noted that the adjusted odds ratios found were similar to those observed with logistic regression models36). Nevertheless, we preferred to use in this study the loglinear model as it gives valuable results and also provides information on multiple interactions between various factors which are useful for understanding the overall problem.
The bias of selection of the sample would be small. Indeed, the households with a telephone represented 96% at the time of the study. The households for whom the addresses were kept confidential represented only 16%. According to our discussions before the survey, for example, with several associations for persons with disabilities, this list would not be related to health status and life conditions. The participation rate was similar to that habitually reached in surveys with mailed questionnaires in France37). It should be noted that the distributions according to age and sex of the sample gathered are close to those of the Lorraine population30). The quality of the filling in of the questionnaire was very good. The non-responses for each of the various items represented less than 4%. As the number of the subjects with one or several missing values was small (9.6%), we preferred not to consider them in the loglinear models. Although this study was conducted on a large sample, the interpretation of the results needs caution due to the presence of a possible bias of selection and the use of an auto-questionnaire, but it should be indicated that the incidence rate of at least one injury in the sample was
close to that of all the French “Régime général de sécurité sociale” (17.2 million working people, 4.4%)1). A study analysing the non-response bias in a mailed health survey on 1,424 respondents and 398 non-respondents showed that the two groups were of similar sex and age distributions and the proportion of persons who had health care expenditures greater than zero francs was only slightly higher in respondents (75% vs 69%, p=0.03)38). Note that the incidence rate of at least one injury in the sample was similar to the directly standardized adjusted rate39) computed in reference to the Lorraine population30). This is due to the fact that, as quoted above, the distributions according to age and sex of the sample are close to those of the Lorraine population.
It should be noted that the investigated factors studied concerned the living conditions and lifestyle for a long period. Only the body mass index was determined at the time of the survey and not at the time of the injury for the subjects with an injury. We believe that it did not greatly vary between the two periods for most workers as nearly all the injured subjects were at work at the time of the survey and they did not experience any disability due to injury.
For age groups, we considered the four following groups: ≤29, 30–39, 40–49 and ≥50 yr. In another study
a significant increased risk of occupational injury was also found for the ≤29 yr age group only11). It was not suitable to divide the ≤29 yr group into several groups as
these groups contained too small a number of subjects and this results in a lack of power for statistical tests.
In the present study which was conducted on all categories of employed people from the general population, the job categories were used to define working conditions. The strength of this choice was that they represented main homogeneous working conditions. It had the weakness that it was not concerned with other occupational hazards. It should be noted that it is difficult to assess the working conditions for all categories of workers, especially through a self-questionnaire. In addition, this approach would introduce many variables, so that a greater sample would be necessary.
Our study points out that among the factors considered, the job played a major role (60.8%) in occupational injury, whereas the other factors (sex, age, regular psychotropic use and disease) had significant roles. This is consistent with a study by our team on railway workers which reported that most occupational injuries were caused by work conditions (physical environment, organisation, technical problems, etc.) and lack of job knowledge and know-how40). The differences between various job categories concern several types of factors which can increase the risk of injury. First, the task, work environment, work organisation and other hazards are different. Work conditions can have an impact on health status and physical and mental ability41–44) which can also
increase the risk of injury. For example, night shift workers would be more common among labourers than among other job categories; and it was reported that, for a similar job, the risk of sleepiness was 6–14 times higher in the night shift and about twice as high in the morning shift than in the day shift45). Labourers, farmers, craftsmen and tradesmen experienced more musculoskeletal disorders than other workers46). These findings highlight that improvement in work conditions and training should be carried out4) for all workers, but especially for workers with higher risk i.e. labourers, farmers, craftsmen, tradesmen, employees, and technicians.
Regarding age groups, a higher risk was only found in subjects younger than 30 yr. This fact was also reported by other investigators11). Young age is associated with a lack of experience which predisposes to the occurrence of injuries9, 15). It could also be associated with a lack of job knowledge and know-how. A study on railway workers emphasised that occupational injuries in young subjects were more due to lack of job knowledge and know-how than in other subjects, and no significant differences were noted for environmental factors, technical problems, work organisation or other factors40). But training and experience cannot eliminate injury when the level of hazards is high and when the use of reliable techniques and safe work organisations are limited47). The difference between the two sexes is well known25). This would be explained in part by the differences in jobs and tasks for the same job category, and possibly by the differences in the perception of risks and in behaviour.
Our study shows that regular psychotropic drug use and the presence of a disease made a similar contribution to occupational injury. This was expected as they are health-related factors which result in decreased physical and mental ability. It should be mentioned that the psychotropic drugs considered include sleeping pills. The effect found in psychotropic drug use was consistent with that of sleep disorders observed for some specific populations11, 13, 21–24, 26). Sleep disorders affect the ability to maintain wakefulness23), concentration, performing duties, and health status26).
As in some surveys on specific populations11, 18, 19) we also observed that smokers had a significantly higher incidence of injuries than non-smokers, but the difference did not remain significant in a multivariate loglinear model. This could be explained by the interdependence of smoking habit with sex, regular psychotropic drug use, excess alcohol use and BMI; some of these being related to injury. In the same way, our study shows that workers with excess alcohol use also had a higher risk than other subjects, but the differences did not also remain significant in a multivariate loglinear model. As for the smoking habit, this factor was related to several other factors (sex, smoking habit and disease). This is an interesting finding considering that, in our experience, it
is difficult to show the role of alcohol use in all occupational injuries combined11, 19). Indeed, the risks induced greatly vary with the activities at work. A study on occupational injuries due to imbalance in railway workers stated that the individuals who consumed alcoholic drink nearly every day did not have a higher risk for all injuries combined, but only for descending from a vehicle which is a complex locomotion activity that needs coordinating function by the cerebellum in orientation and stabilization mechanisms19).
As for body weight, we observed that the incidence of at least one occupational injury increased significantly with increasing BMI (p<0.01), but the loglinear model did not show significant differences for under-weight workers (BMI≤19 kg/m2) or for over-weight individuals (BMI≥25 kg/m2) compared with the other subjects (20≤BMI≤24 kg/m2). And no significant role was found for all occupational injuries combined in construction and railway workers11, 19). In fact, the risk greatly varies with the activities. The people with a BMI over 30 kg/m2 were found to have an increased risk for falls to a lower level in construction workers11) and for traffic injuries in truck drivers13). It was stated that BMI influences the rate of industrial injuries12). Body weight could be associated with health status. Among truck drivers, hypertensive subjects were more overweight, slept more restlessly, took more naps, and woke up more frequently during the night48). In our study, BMI was significantly associated with the presence of a disease (p<0.001) and smoking habit (p<0.02).
Relationships between various risk factors
Even though the objective of this study was assessing the relationships between occupational injuries and various risk factors, a knowledge of the relationships between these factors allows better understanding of the mechanism of occupational injury. This investigation shows that job category was associated with regular psychotropic drug use and disease, and these two factors were linked. In addition, age was related to sex, BMI, disease and job category; sex was linked to BMI, smoking habit, excess alcohol use, psychotropic drug use, disease and job category; and most of the factors: disease, smoking habit, excess alcohol use and psychotropic drug use, were related to each other. The relationships between smoking habit, sleep disorders and sick leave have been reported49, 50). In the present study, occupational injury was significantly linked to psychotropic drug use but not with smoking habit based on the loglinear model runs. This interdependence of the different risk factors pointed out the need for loglinear model in investigating these relationships. Although theoretically the loglinear model can be used to explore all order interactions, in practice it is difficult to interpret higher order interaction terms. A model should fit the data and be substantively
390 J Occup Health, Vol. 45, 2003
interpretable and as simple as possible. If models with and without higher order interaction terms fit the data well, the simpler models are usually preferable35). In this study, as all the third and higher order terms were not significant, the model selected includes the main effects and all second order interaction terms of the significant variables.
In conclusion it can be mentioned that valuable results were obtained with loglinear models, and that the factors job, sex, young age, regular psychotropic drug use, and diseases influence the occupational injuries for overall active population. Separately, the smokers, the overweight subjects, and the excess alcohol users also had increased risk. The job category made the highest contribution to injury involvement. Labourers, farmers, craftsmen and tradesmen had the highest risk, and employees and technicians also had greater risk than executives, intellectual professionals or teachers. Preventive measures concerning work conditions, risk assessment and job knowledge should be conducted in overall active populations, especially in men, young workers, smokers, excess alcohol users, overweight workers and in individuals suffering from a disease or psychosomatic disorders. A campaign could be devised to make these workers, who are exposed to higher risk, more sensitive to occupational injuries, particularly by the occupational physician during the medical examination.
Acknowledgments: The authors would like to thank D Saouag, M Weiss, M Depesme-Cuny, and B Phélut for their help in the study. The work is granted by the Pôle Européen de Santé.
Lorhandicap Group
The group includes N Chau, F Guillemin, JF Ravaud, J Sanchez , S Guillaume, JP Michaely, C Otero Sierra, B Legras, A Dazord, M Choquet, L Méjean, N Tubiana-Rufi, JP Meyer, Y Schléret, JM Mur
References
1) Caisse nationale de l’assurance maladie des travailleurs salariés (CNAMTS). Statistiques financières et technologiques des accidents du travail (années 1998, 1999, 2000). Paris: CNAMTS, 2002.
2) M Gillen, JA Faucett, JJ Beaumont and E McLoughlin: Injury severity associated with nonfatal construction falls. Am J Ind Med 32, 647–655 (1997)
3) TJ Larsson and U Bjornstig: Persistent medical problems and permanent impairment five years after occupational injury. Scand J Soc Med 23, 121–128 (1995)
4) Jorgensen K. Concepts of accident analysis. In: International Labour Office, ed. Encyclopaedia of Occupational Health and Safety. Chapter VIII. Accidents and safety management—Accident
prevention. Vol. 3, 4th edition. Genova: ILO, 1998. 5) S Melamed, D Yekutieli, P Froom, E Kristal-Boneh
and J Ribak: Adverse work and environmental conditions predict occupational injuries. The Israeli cardiovascular occupational risk factors determination in Israel (CORDIS) study. Am J Epidemiol 150, 18– 26 (1999)
6) J Maiti, A Bhattacherjee and Bangdiwala: Loglinear model for analysis of cross-tabulated coal mine injury data. Injury Control and Safety Promotion 8, 229–236 (2001)
7) JC Bastide: Accidentabilité au travail selon l’ âge. Cahiers de Notes Documentaires 156, 361–364 (1994) 8) E Cloutier: The effect of age on safety and work practices among domestic trash collectors in Québec. Safety Science 17, 291–308 (1994)
9) N Chau, D Pétry, C Gavillot, S Guillaume, C Beaucaillou, E Bourgkard, M Gruber, N Monhoven and JM André: Implications professionnelles des lésions sévères du membre supérieur. Arch Mal Prof 56, 12–22 (1995)
10) LF McCaig, CW Burt and BJ Stussman: A comparison of work-related injury visits and other injury visits to emergency departments in the United States, 1995– 1996. J Occup Environ Med 40, 870–875 (1998) 11) N Chau, JM Mur, L Benamghar, C Siegfried, JL
Dangelzer, M Francais, R Jacquin and A Sourdot: Relationships between some individual characteristics and occupational accidents in the construction industry: a case-control study on 880 victims of accidents occurred during a two-year period. J Occup Health 44, 131–139 (2002)
12) P Froom, S Melamed, E Kristal-Boneh, D Gofer and J Ribak: Industrial accidents are related to relative body weight: the Israeli CORDIS study. Occup Environ Med 53, 832–835 (1996)
13) RA Stoohs, C Guilleminault, A Itoi and WC Dement: Traffic accidents in commercial long-haul truck drivers: the influence of sleep-disordered breathing and obesity. Sleep 17, 619–623 (1994)
14) TW Wong: Occupational injuries among construction workers in Hong Kong. Occup Med (Oxf) 44, 247– 252 (1994)
15) ST Salminen: Epidemiological analysis of serious occupational accidents in southern Finland. Scand J Soc Med 22, 225–227 (1994)
16) J Ryan, C Zwerling and E John: Occupational risks associated with cigarette smoking: A prospective study. Am J Publ Health 82, 29–32 (1992)
17) JJ Sacks and DE Nelson: Smoking and injuries: an overview. Prev Med 23, 515–520 (1994)
18) Di Lorenzo L, Zocchetti C, Platania A, De Francesco G, De Metrio R, Pirris A, Gigante MR. Minor and major work accidents in a Puglia business in the food sector: a 10-year study. Med Lav 89, 499–513 (1998) 19) G Gauchard, N Chau, C Touron, L Benamghar, D
Dehaene, PhP Perrin and JM Mur: Individual characteristics in occupational accidents due to imbalance: a case-control study in the employees of a railway company. Occup Environ Med 60, 330–335
(2003)
20) S Wells and S Macdonald: The relationship between alcohol consumption patterns and car, work, sports and home accidents for different age groups. Accid Anal Prev 31, 663–665 (1999)
21) J Ulfberg, N Carter and C Edling: Sleep-disordered breathing and occupational accidents. Scand J Work Environ Health 26, 237–242 (2000)
22) Horne J, Reyner L. Vehicle accidents related to sleep: a review. Occup Environ Med 56, 289–294 (1999) 23) M Harma, S Suvanto, S Popkin, K Pulli, M Mulder
and K Hirvonen: A dose-response study of total sleep time and the ability to maintain wakefulness. J Sleep Res 7, 167–174 (1998)
24) S Melamed and A Oksenberg: Excessive daytime sleepiness and risk of occupational injuries in non-shift daytime workers. Sleep 25, 315–322 (2002)
25) T Akerstedt, P Fredlund, M Gillberg and B Jansson: A prospective study of fatal occupational accidents -Relationship to sleeping difficulties and occupational factors. J Sleep Res 11, 69–71 (2002)
26) D Léger, C Guilleminault, G Bader, E Lévy, M Paillard: Medical and socio-professional impact of insomnia. Sleep 25, 625–629 (2002)
27) C Zwerling, PS Whitten, CS Davis and NL Sprince: Occupational injuries among workers with disabilities: the national health interview survey, 1985–1994. JAMA 278, 2163–2166 (1997)
28) Institut National de la Statistique et des Etudes Economiques (INSEE). Nomenclature des professions et catégories socio-professionnelles PCS. Index analytique. Paris: INSEE, 1983.
29) F Baudier and J Arène: Baromètre santé adultes 95/96. Paris: Editions CFES, 1997.
30) Institut National de la Statistique et des Etudes Economiques (INSEE). Recensement de la population de 1990. Sondage au 1/4. Nancy: INSEE, 1993. 31) JE Grizzle, CF Starmer and GG Koch: Analysis of
categorical data by linear models. Biometrics 25, 489– 503 (1969)
32) LA Goodman: The multivariate analysis of qualitative data: Interactions among multiple classifications. J Am Stat Assoc 65, 226–256 (1970)
33) JA Davis: Hierarchical models for significance tests in multivariate contingency table: an exegesis of Goodman’s recent papers. In: Costner H, editor. Sociological Methodology 1973–74. San Francisco: Jossey-Bass, 1974: 189–231.
34) Upton JG. The analysis of cross-tabulated data. New York: John Wiley and Sons, 1977.
35) SPSS (Statistical Package for Social Sciences) Inc. Chicago, III.: SPSS, 1993.
36) A Bhattacherjee, N Chau, L Benamghar, JP Michaely, AK Ghosh, F Guillemin, JF Ravaud, JM Mur and Lorhandicap group. Associations between individual characteristics and occupational injuries: a community-based study. 16th EPICOH 2002, Barcelona, 2002. 37) Lorhandicap group. Approches méthodologiques dans
une enquête épidémiologique sur les handicaps en Lorraine. Handicap—Revue de Sciences Humaines et
Sociales 88, 1–23 (2000)
38) Etter JF, Perneger TV: Analysis of non-response bias in a mailed health survey. J Clin Epidemiol 50, 1123– 1128 (1997)
39) Breslow NE, Day NE. Statistical methods in cancer research. Vol 1—The analysis of case-control studies. Lyon: IARC Scientific Publications No. 32, 1980. 40) D Dehaene, JM Mur, L Benamghar, N Chau and C
Touron: Analyse statistique d’un échantillon d’accidents du travail parmi les agents d’une entreprise f e r r o v i a i r e ( F r a n c e ) . X X I è m e s J o u r n é e s Méditerranéennes Internationales de Médecine du Travail, Marrakech, 26–28 October 2001.
41) MA Mittleman, G Maldonado, SG Gerberich, GS Smith and GS Sorock: Alternative approaches to analytical designs in occupational injury epidemiology. Am J Ind Med 32, 129–141 (1997)
42) IL Houtman, A Goudswaard, S Dhondt, MP van der Grinten, VH Hildebrandt and EG van der Poel: Dutch monitor on stress and physical load: risk factors, consequences, and preventive action. Occup Environ Med 55, 73–83 (1998)
43) TYF Ma and APC Chan: The attitude of workers toward construction site safety—A study of site safety in Hong Kong. In: A Singh A, Hinze J, Coble RJ, eds. Implementation of safety and health on construction sites. Proceedings of the second international conference of CIB working commission W99. Honolulu, Hawaii, 24–27 March 1999. Rotterdam: A. A. Balkema, 1999: 63–68.
44) Smallwood JJ, Ehrlich R. Stress and construction. In: A Singh A, Hinze J, Coble RJ, eds. Implementation of safety and health on construction sites. Proceedings of the second international conference of CIB working commission W99. Honolulu, Hawaii, 24–27 March 1999. Rotterdam: A. A. Balkema, 1999: 351–357. 45) M Härmä, M Sallinen, R Ranta, P Mutanen and K
Muller: The effect of an irregular shift system on sleepiness at work in train drivers and railway traffic controllers. J Sleep Res 11, 141–151 (2002)
46) Otero Sierra C, Chau N, Macho JM, Cipponeri S, Guillaume S, Michaely JP, Mur JM and Lorhandicap Group. Musculoskeletal disorders for various sociooccupational categories in a French general population: a community-based study. 16th EPICOH 2002, Barcelona, 11–13 September 2002.
47) Bhattacherjee A, Maiti J. New Look into the Quantitative Analysis of Mine Safety Studies. Transactions of the Society of Mining, Metallurgy, and Exploration, Inc (USA), Vol 308, 2000:1–8.
48) RA Stoohs, LA Bingham, A Itoi, C Guilleminault and WC Dement: Sleep and sleep-disored breathing in commercial long-haul truc drivers. Chest 107, 1275– 1282 (1995)
49) V Hoffstein: Relationship between smoking and sleep apnea in clinic population. Sleep 25, 519–524 (2002) 50) M Van Tuinen and G Land: Smoking and excess sick
leave in a department of health. J Occup Med 28, 33– 35 (1986)