Current floristic composition, life form and
productivity of the grasslands in the Hunting Zone of
Djona (Benin)
Myrèse C. Ahoudji1*, Oscar Teka1, Jorgen Axelsen2, Marcel Houinato1
1Faculty of Agronomic Sciences, University of Abomey-Calavi, 01 BP 526, Cotonou, Benin
2National Environmental Research Institute, Aarhus University, Vejlsøvej 25, 8600 Silkeborg, Denmark
*Corresponding author: [email protected]
Original submitted in on 23rd January 2013. Published online at www.m.elewa.org on 30thJune 2014.
http://dx.doi.org/10.4314/jab.v78i1.15
ABSTRACT
Objectives: This paper addressed temporal changes in floristic composition, plant communities’ structures and productivity of grasslands. The study was conducted in the Hunting zone of Djona in the Transboundary Biosphere Reserve of W (TBRW) Benin.
Methodology and Results: For these purpose 30 plots of 900m² were used and “phytosociological relevés” were done following ecological uniformity, floristic homogeneity and samples representativeness to established plants communities. Biomass was estimated in 30 plots of 100 m². Results showed that the greatest productivity value (8320 ± 0.21 kg DM/ha) was observed in Andropogon gayanus-Schizachyrium sanguineum grassland. The dominant life forms in all plants communities of the study area are the phanerophytes followed by therophytes. For chorological types, all plants communities are dominated by the species of the Sudanian base element and species with broad distribution.
Conclusions and application of findings: The identified life forms and chorological types showed an evolution of the post farming pastures to woodlands and savannas vegetation, which explains the current floristic composition of the area. Moreover, it will be possible to model the impact of grasslands exploitation on the viability of the protected area particularly in the context of climate change and for this, it’s important to undertake a long-term study in order to take into account all variations and all causes of these variations. Key-words: Grasslands, productivity, floristic composition, protected area, Benin.
INTRODUCTION
Despite the numerous efforts to arrest land desertification, grassland degradation is advancing over wide areas through overgrazing, cultivation for conversion to meadows, or other operations in the surrounding areas, leading to quantitative and qualitative changes in vegetation (Akiyama & Kawamura, 2007). Vegetation degradation caused by overgrazing is the most serious problem in grasslands that has intrinsically low productivity (Ito et al.,2006). In addition to overgrazing, land-uses
such as traffic and cultivation have recently caused vegetation changes. (Wittemyer et al., 2008) have shown that average human population growth rates on the borders of protected areas in Africa were nearly double the average rural growth, suggesting that protected areas attracted human settlement. This is particularly true for African nature reserves where local species extinctions are directly linked to human population proximity and bushmeat hunting (Brashares et al., 2001; Ogutu et al., 2009).
Journal of Applied Biosciences 78:6753 – 6762
In this context, increasing demands for agriculture productivity, future pressures on grassland ecosystems will intensify (Watkinson & Ormerod, 2001).Thus, understanding the relationships between environmental variables and vegetation is nowadays a central task for land planers. Recently the analysis of the relationship between vegetation and environment gained importance as an instrument to measure the impact of accelerated vegetations changes (Antoine & Nicklaus, 2000) as well as to set up predictive relationship which should help grassland managers in the decision making. Unfortunately, data for such analysis are unavailable
for the Transboundary Biosphere Reserve of W (TBRW) and we crucially miss information relating to changes in the floristic composition of grasslands. So there is an urgent need to assess the changes in floristic composition, life form and productivity of the grasslands in TBRW since previous study in 1993. In this paper address the questions: (i) do the herbaceous life form, floristic composition and productivity remain unchanged in protected area? (ii) If there are changes, what are the factors underlying these changes in the vegetation? (iii) What are the implications of our results for management and the conservation of the grasslands in the TBRW?
METHODOLOGY
Investigation area: Data were collected in the Hunting Zone of Djona, part of the Transborder Biosphere Reserve of W (TBRW) of Benin. The TBRW is located in the North-West of Benin Republic between 11°20’ – 12°23’ N and 02°04’ – 03°05’ E. The TBRW covers about 563 280 ha. The main vegetation types are essentially composed of woodlands, tree-savannas and fallows. The tree layer commonly supports Khaya senegalensis, Diospyros mespiliformis and Daniellia oliveri. The grass layer is composed mainly made of Andropogon gayanus, Andropogon pseudapricus, Andropogon chinensis, Hyparrhenia involucrata and Pennisetum polystachion. Soils are essentially ferruginous usually limited in depth by gravel and lateritic formations (Junge, 2004). The TBRW in Benin is located in the Sudanian zone (White, 1983), characterized by a unimodal rainfall regime with August the wettest month with an average rainfall of 250 mm. The mean temperature varies between 16.8 °C in December and 39.2 °C in April with annual average temperature of 28.1 °C. The relative humidity varies between 24 % in February and 82 % in August. Material and methods: The first trial of this study was conducted in 1993 on grasslands within the TBRW. To this end thirty permanent plots were randomly established following ecological uniformity, floristic homogeneity and samples representativeness. Then, a preliminary field work was run in order to explore native vegetations, current land use habits and localize permanent plots where the first trial was conducted in 1993. General information related to soil conditions (texture) and
Assessing floristic composition of grasslands: To assess grasslands plant communities, Phytosociological relevés (Weber et al., 2000) were carried out within 30 plots of 900 m2 (30 m x 30 m) for tree layer and 30 plots
of 100 m2 (10 m x 10 m) for the herbaceous layer.
Vegetation structure (number of layers, their cover and height) was described. Cover of each species was visually estimated using the Braun Blanquet cover/abundance scale: +: rare, less than 1 % cover, 1: 1-5 % cover, 2: 1-5-21-5 % cover, 3: 21-5-1-50 % cover, 4: 1-50- 71-5 % cover, and 5: 75-100 % cover. A Matrix containing phytosociological relevés was submitted to Nonmetric Multidimensional Scaling (NMS) for ordination, the most generally effective ordination method for ecological community (McCune et al., 2002). A Cluster analysis was performed using the flexible beta method based on Sorensen distance (Bray-Curtis). Number of axes for projection of plants communities was retained with stress reduction. Test for group differences was based on Multi-Response Permutation Procedures (MRPP) testing the hypothesis of no difference between two or more groups of entities. Discriminate species analysis of each group was based on (Dufrêne & Legendre, 1997) method. Discriminate species of a particular group, were species faithful to that group, exclusive to that group and never occurring in others groups. Discriminate value for each species in each group was tested for statistical significance using a randomization (Monte Carlo) technique. P-values for a list of species that was discriminate for group was 5 %. All multivariate analysis
structure, we used phytosociological data to establish life’s form and chorological type spectrum. The life’s forms which were used were those defined by Raunkiaer quoted by Boudet, (1991): Phanerophytes (Ph), Chamaephytes (Ch), Hemicryptophytes (He), Geophytes (Ge) and Therophytes (Th).
Chorological types used are those defined by (White, 1983): Sudanian species (S), Wide distribution species such as Afro American species (AA); Pan tropical species(Pan); Paleotropical species(Pal) and Continental distribution species such as Afro Malgache (AM),Afro-tropical (AT), Pluri regional African (Pt) and Sudano-zambesian (SZ) species.
Productivity of grasslands: Phytosociological data and biomass data were collected every two weeks in 30 plots of 100 m² and the estimation of biomass was realized by the method of the close-cropped. In each plot of 100 m2,
7 squares of 1 m2 were randomly selected for cut and
fresh weights were noted. The biomass and the necromass per square meters were determined from the estimation of dry matter after drying the samples in oven
at 105°C. Biomass data were used for the realization of the ratios graphs with the Excel software. Various parameters making it possible to follow the state of the pastures were calculated: herbaceous productivity and carrying capacity (= maximum biomass * 1000/6.25 * 3 * 365). 1/3: Consumable fraction; 6.25: Ration of the TLU (Tropical Livestock Unit) and 365: A number of grazing days in one year. Analysis of variance was done to compare the phytomass using Newman-Keuls test at 5% significant level. A threshold of 5 % was considered. Biomass harvest date and year were considered as fixed variables then repetitions and observations were considered as random variables. This comparison was done on the one hand between the phytomass of different types of grasslands and on the over hand between the phytomass of different periods of time. Biomass data were collected monthly in the end of august which equal to DO, in the end of September equal to D1 till biomass
peak in October which equal to D2 period of time. The
harvests will be made at 20 cm above the soil.
RESULTS
Floristic composition of grasslands: Phytosociological plots enabled us to obtain a matrix made up to 30 plots and 214 species. This matrix was subjected to hierarchical classification. The first two axes provide greatest reduction in stress (14.07 minimum and 52.70 maximum) so we could conclude that a 2 axes solution is best for this data set. This situation is confirmed with eigen values of each axe (for 54.4 axe 1 and for 22.04 axe 2) and with 2.60 for total inertia. Three groups of plants communities were obtained from hierarchical classification of plots (figure 1). The first community coded 1 by the software is the community of Cochlospermum tinctorium-Afzeliaafricana community and is composed of 11 plots (number of plots: 1; 19; 20; 21; 10; 13; 17; 16; 14; 18; 30)established in woodland.
The second community coded 2 by the software composed of 8 plots (6; 7; 15; 12; 27; 9; 11; 26) mostly established in herbaceous savanna is Andropogon gayanus-Schizachyrium sanguineum community. The third coded 6 by the software is Loxodera ledermannii-Vitellaria paradoxa community and is composed of 11 plots ( 2; 22; 23; 3; 4; 28; 24; 5; 29; 25; 8)installed in shrub and tree savannas. Projection of plant communities in axis system (figure 2) reveals that Cochlospermum tinctorium-Afzeliaafricana community is opposed with Andropogon gayanus-Schizachyrium sanguineum and Loxodera ledermannii-Vitellaria paradoxa communities. Axis 1 separates well the woodlands belonging to savanna and can be interpreted like vegetation type axis.
Distance (Objective Function)
Information Remaining (%)
0 100 1,1E+00 75 2,2E+00 50 3,3E+00 25 4,4E+00 0 R1 R19 R20 R21 R10 R13 R17 R30 R16 R14 R18 R6 R7 R15 R12 R27 R9 R11 R26 R2 R22 R3 R23 R8 R4 R28 R24 R5 R29 R25 G3 126Figure 1 : Dendrogram of the classification of plots into plants communities.
R1 R2 R3 R4 R5 R6 R7 R8 R9 R10 R11 R13 R14 R15 R16 R17 R18 R19 R20 R21 R2 2 R23 R24 R2 5 R2 6 R2 8 R2 9 R30 A x is 2 G3 1 2 6
Grasslands structure: species life’s forms and chorological types
Cochlospermum tinctorium-Afzelia Africana plant community: The figure 3 showed that the most abundant life forms in this plant community were Phanerophytes (57.93 %) and Therophytes (17.68 %). According to the weighted spectrum of this community, we remarked that Therophytes (40.12 %) came in first position and were
followed by Phanerophytes (17.68 %). Proportions of Hemicryptophytes, Chamephytes and Geophytes were low for the spectrum. As for chorological spectrum (figure 3), we noticed that the base – element, Sudanian: S were the most dominant and abundant type. The less dominant and abundant chorological types were species with wide distribution such as Pantropical (Pan ) and Afro-American (AA).
Figure 3: Cochlospermum tinctorium-Afzelia africana community life forms and chorological type’s spectrum Andropogon gayanus-Schizachyrium sanguineum
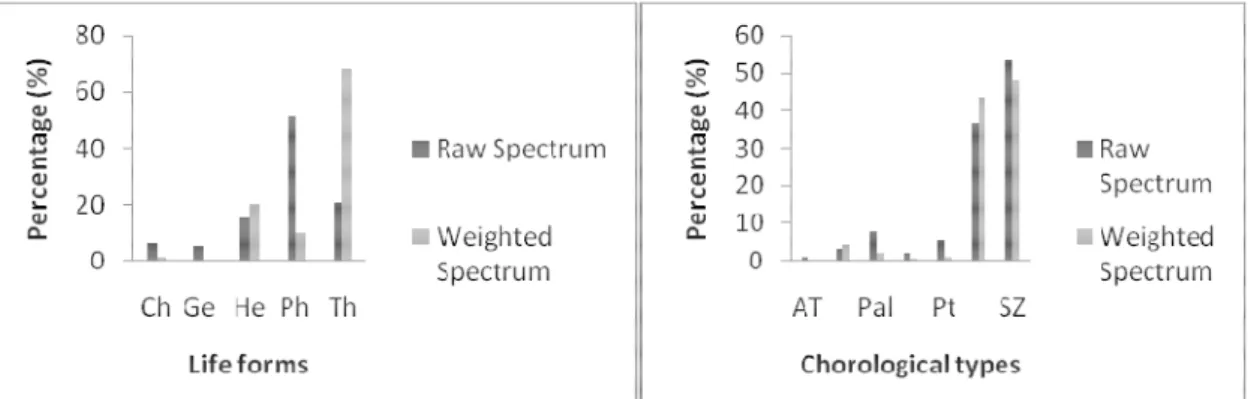
plant community: The abundant life’s forms of this community were Phanerophytes (51.11 %) and Therophytes (21.11 %) (Figure 4). According to weighted spectrum, we remarked that Therophytes (68.1 %) came in first position as the most dominant life forms and are
followed by Hemicryptophytes (20.1 %). For chorological type spectrum (figure 4) of this community, we notice that the Sudano-Zambezian species were the most dominant and abundant type. The others chorological types (Pal, AT, Pt) are less abundant and dominant.
Figure 4: Andropogon gayanus-Schizachyrium sanguineum community life forms and chorological type’s spectrum Loxodera ledermannii-Vitellaria paradoxa plant
community: This community life’s forms spectrum revealed that Phanerophytes were the most abundant (60.65 %) and dominant (45.54 %) life’s forms (figure 5). It was followed by Therophytes and Hemicryptophytes.
The most abundant and dominant chorological type was Sudano-Zambesian species and the other abundant and dominant chorological types are in order, Paleotropical and Afro Malgache species.
Figure 5: Loxodera ledermannii-Vitellaria paradoxa community life forms and chorological type’s spectrum Grasslands productivity
Cochlospermum tinctorium-Afzelia africana plant community: The figure 6 shows the trend of this plant community biomass. Grasses biomass varied from 2.62 ± 0.68 TDM/ha to 3.84 ± 0.68 TDM/ha when the biomass
peak is reached. As for the total biomass, it evolved from 5.41 ± 1.02 TDM/ha to 7.45 ± 1.02 TDM/ha at the end of the dry season (the dry season begin in July and its end is in the first half of November). The total carrying capacity is 1.10 ± 0.15 TLU/ha at biomass peak.
Figure 6: Productivity trend of the forage categories of Cochlospermum tinctorium-Afzelia Africana plant community. Andropogon gayanus-Schizachyrium sanguineum
plant community: The biomass of grasses varied from 3.56 ± 0.68 TDM/ha to 4.49 ± 0.68 TDM/ha (figure 7). Total biomass evolved of 5.49 ± 1.48 TDM/ha at the
beginning of October with 8.32 ± 1.48 TDM/ha at the end of the dry season. The total carrying capacity of this plant community was 1.22 ± 0.22 TLU/ha at the biomass peak.
Loxodera ledermannii-Vitellaria paradoxa plant community: Figure 8 shows the trend of this plant community biomass. We noticed that the grasses biomass varied from 3.43 ± 0.61 TDM/ha to 4.66 ± 0.61 TDM/ha at the beginning of October with the beginning of
November. The total biomass at the biomass peak was 7.69 ± 0.93 TLU/ha. The total carrying capacity moved of 0.85 ± 0.13 TLU/ha with 1.13 ± 0.13 TLU/ha for the same period.
Figure 8: Productivity trend of the forages categories of Loxodera ledermannii-Vitellaria paradoxa plant community. The comparison of the productivity of plant communities
by the Analysis of Variance reveals significant differences between the productivity with respect to time period (table
2). Their hierarchisation (table 3) according to the test of Newman-Keuls at the threshold of 5 % makes it possible to distinguish three homogeneous groupings.
Table 1: ANOVA analysis results
Source DF Type III SS Mean Square F Value Time 2 11.43 5.72 16E18***
Time*pasture 4 14.47 3.61 10E25*** Time*forages 4 0.21 0.06 0E15*** Time*pasture*forages 8 23.07 2.88 8E17*** ***: Significant value
Table 2: Grass productivity variation in plant communities
Plant community Mean ( TDM/ha)Homogenous groups Group1 3.45 A
Group2 3.19 B Group3 3.59 C
NB: The groups followed by the different letters are significantly different. Group1: Cochlospermum tinctorium-Afzelia africana plant community; Group2: Loxodera ledermannii-Vitellaria paradoxa plant community;
Group3: Andropogon gayanus-Schizachyrium sanguineum plant community. DISCUSSION
Floristic composition: Development of tools for phytodiversity requires knowledge on plant communities and how plant communities change over time. In this study, we focused on current floristic composition in the Hunting Zone of Djona in the TBRW. Our results showed that shrub and tree savannas and woodlands constitute
the main part of the plant communities of the study area. Grassy savannas are sparse. (Ogoubiyi, 1995) identified in the same study area only shrub and tree savannas. (Tamou, 2002) also identified in the same area the domination of savannas and fallow. In addition with these formations, we noticed the presence of woodlands. This
last type of vegetation indicates an evolution from the primary vegetation to the secondary succession formation. It might be explained by the fact that protective measures were intensified in the study area since 2002. Grasslands structure: species life’s forms and chorological types: The study highlighted that the high presence of therophytes life forms in plants communities.The high proportion of therophytes indicated a degradation state of grasslands. (Javaid et al., 2009) showed that the high percentage of therophytes explained a high degree of biotic influence on the habitat. (Kala, 2002) has reported that therophytes develop especially in an area where native vegetation has been disturbed by overgrazing. The plant communities of the study area reveal also the low presence of hemicryptophytes. This suggested that disturbance may favor the occurrence of therophytes but induces reduction of hemicryptophytes. These results might likely explained by high grazing pressure which is a factor which reduces the regeneration capacity of hemicryptophytes. Our results corroborated with those of (Todd & Hoffman,1999) and (Sawadogo et al.,2005) who showed that improper grazing may favor establishment of annual grass species and hindered the perennial ones. This situation, for animal production indicates a reduction of forage quality. Considering the phanerophytes dominance and abundance in the plants communities, their high presence suggesting that overgrazing didn’t affect phanerophytes. Indeed, during the course of plant community succession, most woody species in Sudanian regrowth from coppices left during the land clearing and contribute to increase the woody (mainly shrubs) density or abundance in the communal land (Luoga et al., 2004); (Bellefontaine, 2005). This situation might induce apparent high occurrence of woody in the area. Ours finding didn’t show a significative presence of geophytes and chamephytes. We can concluded that the life form composition of plant community can be used as indicator for phytodiversity
monitoring of mainly phanerophytes, therophytes and hemicryptophytes in our study area. The chorotypes are regarded in plant ecological studies as important traits of vegetation, which described the phytogeographical affinity of the community (White, 1983); (Adomou, 2006). Our study revealed that all plant communities are dominated by species of the Sudanian base element.Species with wide distribution followed Sudanian species. These results are in conformity with (Bako, 1994) who found in the same area that Sudanian base elements are the dominated chorotypes and they are followed by the wide distribution species types. The emergence of this last chorotypes species with distribution in a phytocoenosis indicates degradation and loss of soil fertility which supports the local flora. Chorotypes can be used as an indicator of disturbance.
Grasslands productivity: Our findings showed that biomass production is minimal in Cochlospermum tinctorium-Afzelia africana grassland and this production is reached its maximum value in the Andropogon gayanus-Schizachyrium sanguineum grassland at the beginning of November. In Benin, these results were compared to those obtained by others authors: (Bako, 1994) in Karimama TBRW found biomass values which minimum value is 3000 kg DM/ha and maximum value is 7000 kg DM/ha; (Ogoubiyi,1995) in the same area, hunting zone of Djona found production values 2000 kg DM/ha and 5000 kg DM/ha. However, it should be noted that compared with our results, there was a light increase in the biomass. Indeed 7032 kg of DM/ha, maximum value found by one of the authors, it passed to 8320 kg of DM/ha. The maximum value observed in Andropogon gayanus-Schizachyrium sanguineum plant community is due to the fact that these grasslands are located in bottom of slope. The herbaceous layer in particular responds to the structural and functional properties of a tree (Scholte, 2003).
CONCLUSION
At the end of our investigations, the various sites of the Hunting Zone of Djona studied since 1993, subject of our investigations, showed three types of formations: the woodlands, shrub and tree savannas and grassy savannas. These various types of formations are dominated by the phanerophytes and the therophytes.
Andropogon gayanus-Schizachyrium sanguineum grassland. These different characteristics indicated a trend in grassland with a severe state of degradation to a less severe state of degradation.However, of the predictions for the future, by taking account of the various factors of modifications of vegetation structure, it is
appreciate grassland dynamic. Moreover, it will be possible to model the impact of grasslands exploitation
and the viability of the protected area particularly in the context of climate change.
ACKNOWLEDGEMENTS
This work is supported by “Undesert research project” for the financial support. We also thank the Professor Brice Sinsin and all the members of Laboratory of Applied Ecology for their advice and comments on an earlier version.
REFERENCES
Adomou AC, Sinsin B, Van der Maesen LJG, 2006. Phytosociological and chorological approaches to phytogeography: a meso-scale study in Benin. Systematics and geography of plants 76: 155-178.
Akiyama T. and Kawamura K, 2007. Grassland degradation in China: Methods of monitoring management and restoration. Grassland Science 53: 1–17.
Antoine G. and Nicklaus EZ, 2000. Predictive habitat distribution models in ecology. Ecol Modell 135: 147–186.
Bako I, 1994. Productivité et exploitation des pâturages naturels du sous – domaine soudanais septentrional du Bénin ; Périmètre de Karimama. Thèse d’Ingénieur Agronome FSA / UNB ; Bénin 134pp.
Bellefontaine R, 2005. Pour de nombreux ligneux la reproduction sexuée n’est pas la seule voie : Analyse de 875 cas. Texte introductif, tableau et bibliographie. Sécheresse 16 : 315-317. Brashares JS, Arcese P, Sam MK, 2001. Human
demography and reserve size predict wildlife extinction in West Africa. Proc R SocLond, Ser B: BiolSci 268: 2473–2478.
Boudet G, 1991. Manuel sur les pâturages tropicaux et des cultures fourragères. Ministère de la Coopération. Manuel et précis d’élevage n°4, Paris, 266pp.
Dufrêne M. and Legendre P, 1997. Species assemblages and indicator species: the need for flexible asymmetrical approach. Ecological Monographs 67: 53-73.
Gaoué GO and Sinsin B, 2003. Typologie et écologie des pâturages naturels de la zone cynégétique de la Pendjari (Nord-Ouest Bénin) : éléments pour l’aménagement et la gestion rationnelle de la faune sauvage. Actes du IIe séminaire international sur l’aménagement intégré des forêts naturelles des zones tropicales sèches en Afrique de l’Ouest, Parakou, Bénin 25-29 juin 2003.
Houinato M, Affédjou CBG, Brisso N, Yaoitcha A, Sinsin B, 2007. Impact of controlled fire on grassland productivity Transboundary Biosphere Reserve of W in Benin.Rapport de travail, projet ECOPAS.
Ito M, Ao M, Ito K, 2006. Inner Mongolian grasslands: situation and concern. J Weed Sci Tech 51: 256–262.
Javaid MD and Anisa BK, 2009.Floristic composition of alpine grassland in Bandipora, Kashmir. Grassland science 56: 87-94.
Kala CP, 2002. Paradise under fire. Down Earth 11: 46– 48.
Luoga EJ, Witkowski ETF, Balkwill K, 2004. Regeneration by coppicing (resprouting) of miombo (Africa savannah) trees in relation to land use. Forest Ecology and Management 199: 23-35
McCune B, Grace JB, Urban DL, 2002. Analysis of Ecological Communities. United States of America. 300pp.
Ogoubiyi CV, 1995. Productivité et capacité de charge des herbages de la zone Cynégétique de la Djona. Thèse d’Ingénieur Agronome. FSA/UNB. Bénin. 118 pp.
Ogutu JO, Piepho HP, Dublin HT, Bhola N, Reid RS, 2009. Dynamics of Mara-Serengeti ungulates in relation to land use changes. J Zool 278: 1-14. Prach KR and Ehounkova K, 2008.Spontaneous vegetation succession in gravel–sand pits: a potential for restoration. Rest. Ecol. 16: 305-312. Scholte P, 2003. Immigration: a potential time bomb under the integration of conservation and development. Ambio 32: 58-64.
Sawadogo L, Tiveau D, Nygard B, 2005. Influence of selective tree cutting, livestock and prescribed fire on herbaceous biomass in the savannah woodlands of Burkina-Faso, West Africa. Agriculture, Ecosystems and environment 105: 335-345.
Tamou C, 2002. Etat des lieux quantitatif et spatialisé de la transhumance dans la zone d’influence du
parc National du W du fleuve Niger-Benin. Thèse d’ingénieur Agronome, FSA / UAC. Bénin, 107 pp.
Watkinson AR and Ormerod SJ, 2001. Grasslands, grazing and biodiversity: editors’ introduction, Journal of Applied Ecology 38: 233-237. Weber HE, Moravec J, Theurillat JP, 2000.International
Code of Phytosociological Nomenclature.3rd
Edition. Journal of Vegetation Science 11:739– 768.
Wittemyer G, Elsen P, Bean WT, Coleman A, Burton O, Brashares JS, 2008.Accelerated human population growth at protected area edges. Science 321: 123-126.
White F, 1983. The vegetation of Africa. UNESCO, Paris, 356 pp.