,‘/Jl ff .5 (f’-, L/,
Université de Montréal
Méthode d’étude moléculaire des tumeurs rares pédiatriques Alethodsof inolecutar anal‘sis to study rare paediatric titniotirs
Par Papp Eniko
Département de pathologie et biologie cellulaire Faculté des études supérieures
Mémoire présenté à la Faculté des études supérieures En vue de l’obtention du grade de Maîtrise en science (M.Sc)
En Pathologie et Biologie Cellulaire Option cancérologie
Août 2006
Di
L1
U5
V(E
Université
de Montréal
Direction des bibliothèques
AVIS
L’auteur a autorisé l’Université de Montréal à reproduire et diffuser, en totalité ou en partie, par quelque moyen que ce soit et sur quelque support que ce soit, et exclusivement à des fins non lucratives d’enseignement et de recherche, des copies de ce mémoire ou de cette thèse.
L’auteur et les coauteurs le cas échéant conservent la propriété du droit d’auteur et des droits moraux qui protègent ce document. Ni la thèse ou le mémoire, ni des extraits substantiels de ce document, ne doivent être imprimés ou autrement reproduits sans l’autorisation de l’auteur.
Afin de se conformer à la Loi canadienne sut la protection des renseignements personnels, quelques formulaires secondaires, coordonnées ou signatures intégrées au texte ont pu être enlevés de ce document. Bien que cela ait pu affecter la pagïnation, il n’y a aucun contenu manquant.
NOTICE
The author of this thesis or dissertation has granted a nonexclusive license allowing Université de Montréal to reproduce and publish the document, in part or in whole, and in any format, solely for noncommercial educational and research purposes.
The author and co-authors if applicable retain copyright ownership and moral rights in this document. Neither the whole thesis or dissertation, flot substantial extracts from it, may be printed or otherwise reproduced without the author’s permission.
In compliance with the Canadian Privacy Act some supporting forms, contact information or signatures may have been removed from the document. While this may affect the document page count, it does flot represent any Ioss of content from the document.
11
Université de Montréal Faculté des études supérieures
Ce mémoire intitulé:
Méthode d’étude moléculaire des tumeurs rares pédiatriques
Methods of motecular aitalysis toStUd)7 rare paediatric tumours
Présenté par: Papp Eniko
A été évaluéparun jury composé des personnes suivantes: Dr Daniel Sinnett Président rapporteur Dr Jean-Christophe Foumet Directeur de recherche Dr Raouf Fetni Membre du jury
ni
SOMMAIRE:
Après le décès d’origine accidentelle, les cancers représentent la principale cause de mortalité chez les enfants et adolescents de moins de 20 ans. Seule les 5 cancers les plus fréquents dans cette tranche d’êge sont relativement bien caractérisés sur le plan moléculaire. Tout reste à faire pour les 200 restant. Malhecireusement. leur étude reste difficile en raison de nombreuses limitations. Premièrement, l’accès aux échantillons tumoraux frais et congelés est limité du fait même de la rareté de ces tumeurs. Deuxièmement, l’obtention de mitose, indispensable pour l’étude des aberrations chromosomiques, est difficile. Troisièmement, l’étude de l’ADN à partir de prélèvements d’archive est réduite en raison de la dégradation de l’ADN au sein de ces prélèvements inclus en paraffine. Ainsi, dans l’état actuel de nos connaissances, la quantité d’information disponible sur la génétique de ces tumeurs reste faible. Afin d’améliorer l’étude de ces tumeurs et pour acquérir de nouvelles informations sur les voies oncogénétiques moléculaires, nous nous proposons de combiner des méthodes classiques d’analyse (FISR interphasique, allélotypage des tumeurs à laide de marqueurs microsatellites) avec une nouvelle technologique de génotypage tumoral a haut débit. En combinant ces méthodes, nous contournons le problème de mitose et la dégradation en utilisant la méthode de fISH interphasique et nous permettons l’étude a haute débit même avec peu de matériel en utilisant la plateforme Illumina. En premier lieu, nous avons mis
au point une technique de génotypage en utilisant la plateforme Infinium d’Illumina et la puce Sentrix Human-1 SNP. Pour ce faire, nous avons utilisé 25 échantillons de néphroblastome (tumeur de Wilms’) comme référence, ce modèle tumoral ayant déjà fait l’objet d’un allélotypage avec une carte de délétion du chromosome hp. Une fois notre technique validé, nous avons étudié deux tumeurs orphelines à titre de modèles, afin de comparer des techniques génétiques classiques et une méthode de génotypage tumoral de haute performance: la myofibromatose infantile comme premier modèle et la tumeur musculaire lisse associée au virus rapporteur comme deuxième modèle. Notre but est de perfectionner les approches diagnostiques et thérapeutiques des tumeurs pédiatriques rares et, à terme. de permettre une amélioration de la survie des patients. Mots clés Cancer pédiatrique rare, tumeur de Wilms’, myofibromatose infantile, tumeur musculaire lisse associée au virus d’Epstein-Barr. hybridation in situ en fluorescence, allèlotypage, perte d’hétérozygotie, plateforme Illumina.
iv
SUMMARY:
Mter prenatal complications and accidentai deaths, cancer is the most common disease-related cause of death among chiidren and adolescents younger than 20 years of age. Even if the 5 most common paediatnc cancers are weIl characterised, the molecular pathways involved in oncogenesis stili remain unknown in more than 200 paediatric tumours. The reason of this major lack in knowledge is due to limitations when studying rare paediatric and orphan tumours. First, there is a limited access to fresh and frozen cancer tissue samples due to the rarity of these tumours. Second, there is limited amount of mitosis achieved which is however necessary in the study of chromosomal aberration. Finally, the study of the DNA is limited due to the degradation of the DNA in paraffin embedded tissues. Due to these reasons, the study of rare paediatric cancer is chailenging, limiting our knowledge about their genetic information. To overcome these problems, we propose that combining iow-throughput methods (interphasic FISH which does not require mitosis, molecular allelotyping studies using microsatellite markers) with a new high- throughput tumoral genotyping method could improve characterization of samples and increase our knowledge of the molecular oncogenesis. By combining these methods, we are able to study tumor samples contained in paraffin where there is no mitosis by using iFISH. Furthermore, we are able to study small amount of tumoral samples by using high throughput genotyping Illumina platform. To test this hypothesis, we used 25 diagnosed nephroblastoma (Wilms’) tumour samples. Chromosome 1 ‘p ailelotyping was carried out with these samples. With the detailed deletion map as a reference, we validated the Illumina platform and the Sentrix Human-1 SNP BeadChip array. Mterwards, we used two orphan tumours as models to analyse classical genetic and the high-throughput genotyping techniques: Infantile Myofibromatosis as our first model and Intestinal Epstein-Barr virus-associated smooth muscle as our second model. Our goal is to improve diagnostic and therapeutic approaches and, ultimately, enhance individual clinical outcomes.
Key words: Rare paediatric cancer, Wilms’ tumour, Infantile Myofibromatosis, Intestinal Epstein-Barr virus-associated smooth muscle, fluorescent in situ hybridization, alielotyping, loss of heterozygosity, Illumina platform, Sentrix Human-1 SNP BeadChip array.
V
TABLE 0F CONTENT
MEMBERS 0F 111E JURY ii
SOMMAIRE iii
SUMMARY iii
TABLE 0F CONTENT y
LISI 0F TABLES
vii
LIST 0F FIGURES
viii
ABREVIATIONS
xi
ACKNOWLEDGEMENTS
xiii
CHAPTER I 1
-
Introduction
- 11. Study of the constitutional genome 6
1.1. Familial Studies 6
1.2. Constitutional mutations screening in candidate gene 7
2. Study of somatic genome $
2. L Analysis of cell chromosomes (tumoral cytogenetics) $
2.1 a) Chromosomes in tumoral ceils $
2.1 b) Cytogenetic tools in cancer genetics 14
3.
Studies of tumoral genome (somatic anomalies) 213.1. Molecular DNA analysis 21
3.1 a) Southern blotting analysis of restriction fragment length polymorphism 24 3.1 b) Microsatellite rnarker amplification 24 3.1 e) High-resolution single-nucleotide polymorphism anay 25 3.1 d) Genomic imprinting and rnethods of detection 2$
CHAPTER II HYPOTHESIS 30
CHAPTER III OBJECTIVE 0F 111E PROJECT 30
CHAPTER IV MOLECULAR CHARACTERIZATION 0F RARE
vi
A. Single nucleotide polymorphism array to test LOH in Wilms’ tumours 32
1. Introduction 32
2. Sample selection and DNA extraction 32
3. Loss of heterozygosity (LOF!) analyses by (CA) microsatel lites
PCR amplification 33
4. Tumoral genotyping with Illumina SNP array 36
5. Tumoral genotyping restiits 44
B. Infantile Myofibromatosis 60
I .Introduction 61
2. Linkage analysis 63
3. Sample selection and DNA extraction from blood, paraffin, frozen tissue 64 4. LOH analyses of chromosome regions 6q and 9q 67
5. FISH optimisation for paraffin embedded tissues 69
6. Infantile Myofibromatosis SNP anay 79
C. Intestinal Epstein-B arr virus-associated smooth muscle $1
1. Introduction 82
2. Sample selection and DNA extraction 82
3. Clonality assessment by HUMARA analysis 83
4. FISH $5
5. SNP array result 87
CHAPTER V 89
-Discussion- 89
1. Microsatellite amplification for LOI-1 studies 90
1.1. Frozen tisstie 90
1.2. Paraffin embedded tissues 90
2. Karyotype tools application and limitations 91
2.1. Conventional karyotyping 91
2.2. FISH 91
3. SNP array validation 94
4. SNP array can flot detect transiocations 97
5. CGH will be replaced by SNP array 98
6. Perspective, prediction and future studies 9$
A. Importance of data base 98
B. Somatic cancer studies made casier 9$
C. Prognostic and therapeutics ameliorated 9$
vii
LIST 0F TABLES
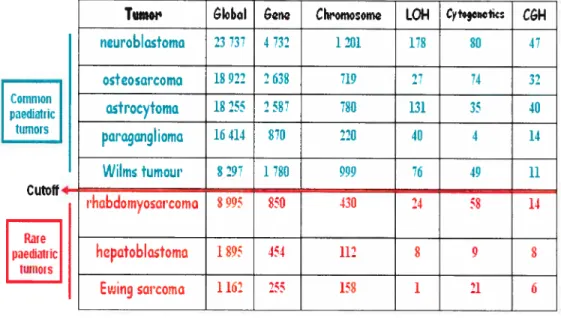
Table I: List of common and rare paediatric cancers with a number of PubMed references for each type
Table II: Some examples of paediatric orphan tumours p.4 Table III: Mapping of breakpoints in non-random chromosomal rearrangements allowed oncogene identification pli Table IV: Examples of isochromosomes-associated tumours p.12
Table V: Online cytogenetic resources p.20
Table VI: Chromosome deletion map after amplification of chromosome 11
markers in 25 Wilms’ tumours p.35
Table VII: LOR results comparison between SNP array and microsatellite
amplification p.5i
Table VIII: LOU results using a variety of chromosome 6 and 9 microsatellite markers in patient’s genomic DNA recovered from frozen tissue or paraffin embedded tissue
Table IX: Summary of DNA FISH Probes Used in this Investigation p.72 Table X: Resuits of fISH on interphase nuclei using the LSI bcr/abl ES dual
color DNA probe to detect chromosome 9 deletions in Infantile
viii
LISI 0F FIGURES
Figure 1: The muti-steps of cancer
Figure 2: Diagram illustrating various genomic techniques Figure 2A: Metaphasic chromosome structure
Figure 3: DNA Amplification p.14
Figure 4a: Principle of array CGH, part 1 p.l8
Figure 4b: Principle of anay CGH, part 2 p.l9
Figure 5: LOH causing TSG inactivation p.21
Figure 6: Chromosomal nondisjunction p.22
Figure 7: Mitotic recombination
figure 8: Alternative mechanism causing the inactivation of tumour suppressor genes
Figure 9: Microsatellite markers used in the LOU study with Wilms’
samples p.34
figure 10: The sentrix Human-1 SNP BeadChip p37
Figure 11: Illumina Work flow p.38
Figure 12: Infinium lis an ASPE-based one colour assay p.39
Figure 13: Summary of the Infinium assay p.40
Figure 14: Normalization Turned Off & Normalization Turned On p.41
Figure 15: Illumina Genome Viewer (IGV)
Figure 16: LOH: Chromosomal deletion causing true reduction to
hemizygosity p.45
Figure 17: LOU size on chromosome liSp
Figure 18: Chromosome 3 deletion p.47
Figure 19: Whole chromosome 7 deletion p.48
Figure 20: Copy number p-value p.48
Figure 21: Illumina Chromosome Browser p.49
Figure 22: Copy-neutral LOH on chromosome hp p.5l
Figure 23: Chromosome 19q amplification p.52
Figure 24: Chromosome 1 amplification p.53
Figure 25: Amplification of chromosome 1p36.ll to 1p35.2 p.54 Figure 26a): Navigating the illumina chromosome browser p.54
ix
Figure 26h): Navigating the illumina chromosome browser, part 2 p.55 Figure 27 A: Tumoral sample 21 compared to its matching normal sample..
.
p.56
Figure 27 B: Tumoral sample 21 compared to the reference cluster p.56 Figure 2$: Tumour sample compared to its normal sample revealing
chromosome 19q duplication p.57
Figure 29: Tumour sample compared to the Illumina reference cluster p.57
Figure 30: Legend for chromosome mapping p.58
Figure 31: Chromosome mapping with Wilms’ samples analysed on the SNP
array p.59
Figure 32: Multi-fluorescence in situ hybridization (FISH) analysis of a metaphase cell in a patient with Infantile Myofibromatosis p.62 Figure 33: First family recruited at CHU Sainte-Justine with a history of
Infantile Myofibromatosis
Figure 34: Second family recruited at CHU Sainte-Justine with a history of
Infantile Myofibromatosis
p.63
Figure 35: Description of the material available to study Infantile
Myofibromatosis
p.64
Figure 36: AutoPixTM laser capture miscrodissection system Arcturus...
.p.66
Figure 37: BAC probes test for their hybridization specificity
Figure 3$: Tonsil tissue embedded in paraffin used to test the BAC
probes
p74
Figure 39: BAC Probe signal MFI paraffin embedded tissues
Figure 40: Interphase nuclei form Infantile Myofibromatosis pre-treated with
citrate and bisulfate buffers p.75
Figure 41: LSI bcr/abl ES (extra signal) dual color DNA probe
Figure 42: Infantile Myofibromatosis sample 04-7883 DNA analysis with
SNParray
p.79
Figure 43: Infantile Myofibromatosis sample 2 DNA analysis with SNP
array
p.8O
Figure 44: Infantile Myofibromatosis sample 3 DNA analysis with SNP
array
p.80
Figure 45: HUMARA results
p.84
X
Figure 47: FISH resuits on interphase nuclei from EBV-smooth muscle
tumour
p.86
Figure 4$: Chromosome 2 result after EBV-SMT resuit
p.88
Figure 49: EBV-SMT genotyping resuit, showing chromosome 2
p.88
Figure 50: Comparison of cytogenetic techniques for identifying chromosomal abnormalities
xi
ABREVIATIONS
% : percent
micro
°C: degree celcius
ALK: anaplastic lymphoma kinase
ASPE: allele-specific primer extension ATBF1 :AT-binding transcription factor 1 BAC : bacterial artificial chromosome
bp: base pair
caR : dinucleotide CA repeat region
CEPH : centre d’étude du polymorphism humaine
CGH: comparative genome hybridization
CHU : centre hospitalier universitaire
dcl: deletion
der: derivé
DM: double minute
DNA: Deoxyribonucleic acid
EBV: Epstein-Barr virus
EBV-SMT: EBV-smooth muscle tumour
FANCA: Fanconi anaemia complementation group A
FISH: fluorescence in siflt hybridization FUS:
http://www.gene.ucl.ac.uk/nomenclature/data/get_data.php?hgnc_ïd=40 10 fusion (involved in t(12;16) in malignant liposarcoma)
g: gram
gDNA: genomic DNA
HD-CGH: high definition CGH
HPLC: high performance liquid chromatography
HSR: homogeneously staining regions
IFM : Infantile Myofibromatosis
ICB: illumina chromosome browser
1GF2: insulin-like growth factor 2
IGV: illumina genome viewer
Kb: 1 thousand base pairs
liter
Log: logarithm
xii
LOI: loss of imprinting
M: mitosis
Mb: I million base pairs
M-FI$H: multiplex-fISH
ml: mililiter
MMP2: matrix metallopeptidase 2
mol: mole
myc: myelocytic leukemia
MYCN: myc myelocytomatosis viral related oncogene, neuroblastoma derived
N: number
NCBI: national center for biotechnology information
NCI: national cancer iristitute
ng: nanogram
NQO1: NAD(P)H dehydrogenase quinine
ONC: oncogene
p: shortarmof the chromosome
PAC: PI-derived artificial chromosome
PCR: polymerase chain reaction
pmol: picomole
POU6F2: thePOU domain, class 6, transcription factor 2
PTCH: patched homolog drosophula
q: long arm of the chromosome
RASSf1: Ras association (Ra1GDS/AF-6) domain family 1
RBL2: retinoblastoma like-2
RFLP: restriction fragment Iength polymorphisms
SKY: spectral karyotyping
SNP: single nucleotide polymorphism
t: translocation
TAQ: thermophilic DNA polymerase
TSG: tumour suppressor gene
U: unit
UPD: uniparental disorny
WGG: whole genome genotyping
WT: wild type
xli’
ACKNOWLEDGEMENTS
firstiy, I would like to thank my supervisor, Dr. Jean-Christophe Fournet. I couid flot have imagined having a better clinicai advisor and mentor, and without lis boidness (who knew Illumina piatform existed!), common-sense, knowiedge and perceptiveness. I would have neyer completed my master’s project.
I express my gratitude to Dr. Daniel Sinnett for lis time, constructive advice and to aiways have considered me as part of the team, well adopted student that is! Also, I will be forever thankful for Dr. Labuda’s generosity and the support I had from bis laboratory team.
A special thank you for Dr. Raouf Fetni who introduced me the cytogenetic world and to have shared lis knowledge about the clinical side of research.
Dr Luc Oiigny, thank you for aiways being proud of your students! I would also like to thank ail the rest of the academic and support staff of the department of pathoiogy and the Hemato-Oncology department, particuiariy those who have put up with my drifting a long way away from my original titie. Thank you Vania for aiways being there and for the support you have gave me.
Finally thank you for ail my friends and family, wherever they are, particuiariy my Mum and Dad; and, most importantiy of ah, to Dorothée, Anne-Laure and Karine for being a support throughout this joumey. A special thank you for Alexandre Montpetit for his constant help and patience during data analysis.
Peace and Solidarity, Eniko
1
CHÂPTER I
-2
During the last several decades, intensive research efforts have increased our undersianding of carcinogenesis and have identified that cancer development is caused by a muiti-step process. Tumors grow through a process of clonai expansion dnven by mutations generating a group of celis geneticaliy identical to a single common ancestor. Clonai expansion is a property obtaïned after the cancer cdl accumulated mutations leading to a survival advantage. The first somatic or constitutional mutation in an oncogene or tumour-suppressor gene causes a clonai expansion, thus initiating the neopiastic process subsequently foiiowed by additionai mutations causing further rounds of clonai expansion. The
genetic abnormalities generated by these mutations contribute to cancer pathogenesis including seif-suffic iency, angiogenesis and metastasis (Figure 1) [1,
TissueInvasion &metastasls
figttre 1: The mttÏti-steps ofcancei Cancerarises through ct se ries ofmutations,
mvolvmg among other oncogenes (ONÇ) and —suppressor genes (TSG). Each nuttation leads to the setective overgrowth ofa monoclonal population of ceils, as weil as to significant properties (invasiveness, metastasis, drtig resistance, etc.) [1, 2]. 2]. ONC hG O\C 15G Genriic plisi iI Nirniil Insenattiv#yto antlgrowth signais roitu 3Enqntufliotit Prirny Œn(er
I
J
I—
“ç Sustalned angiogenesis Copyrkjht JOlIturePuhLislungGrtNature Revewsj
UmIflesNpllcaUve
p-3 Advances in cancer research have ailowed us to gain knowiedge about the molecular level of different aduit cancer types including but not limited to breast, lung, colon and ovarian cancer. However, paediatric cancers are less well characterized and remain an important cause of death among chiidren. After accidentai deaths, cancer is the most common disease-related cause of death among chiidren and adolescents younger than 20 years of age (The national cancer institute of Canada, 2006). Leukemias, lymphomas, central nervous system, neuroblastomas and Wilms’ tumours are the rnost frequently diagnosed cancer categories and are relatively well characterized. However, more than 200 tumours observed in children still need to be characterized in order to provide a better diagnosis and treatment to chiidren affected by cancer.
We have considered a paediatnc tumour to be rare if its incidence is lower than Wiims’ (0.8 cases per 100 000 persons; 7% of paediatsic soiid tumors). We defined that an orphan is a tumoral type with less than 20 PubMed references in Cytogenetics or molecular bïology. Examples of such tumoursare listed in Table I and II.
The goal of this study was to compare varions types of techniques in order to gain knowledge about the molecular and cytogenetic information on rare and orphan paediatnc cancers. We wanted to have an overail idea of the amount of information that can be obtained when studying rare and orphan tumours with limited genetic information.
4
Table I: List ofcommon (in green) and rarepaediatric (in red) cancers with the intmber ofPttblied references for each r’pe. ThecoÏtunns represent the numberof reference fottnd in pubined when gene, chromosome, LOR, c’togenetics or CGH
was typed inthe pubmedsearch.
Table II. Some examples ofpctediatric orpÏian tumours with Iess than 20 PubMed
references in cvtogenetics/oncogenetics (shown in red). The columns represent the nttmber of reference found in pubmed when gene, chromosome, LOI-L cvtogenetics or CGH was typed in the ptibmned search.
lumor GIobI &ng Chromoom LOH CytogQnQtics C&H AIIIotyping
dc:m,d Nmour 1029 58 34 0 1 0 0
ekor cdli :aicomo 201 24 15 0 2 1 0
•f Lidcny otrointcctinoI 1381 221 46 4 0 5 0 :tr,moltum,Ut Hcman9io- 2750 38 19 1 0 1 0 cndothIiomo in:ulrnoma 4234 734 76 14 2 1 2 ipobr.matoi: 7 O 0 0 0 0 0 panrcatic ocInr 210 21 5 0 0 1 1 cdl corcrnomo :,hd 163 10 2 0 1 1 0 p:cudopapillory tumour of thc pancrca
Tumor
GIoboI &n CIwomosom LOI-I Cyfogcnctic CGHncuroblcstomo
23 737 1 732 1 201 178 80 47osteoarcoma
18 922 2 638 719 27 74 32asitocytoma
18 255 2 58 7$0 131 35 40paragangliomo
16 414 870 220 40 4 14 Common pedatnc ttirnors Cutoif4 Rare l)aedÎalric 11111101 SWiIm tumour
lhobdomyosarcoma
8297 1780 999 49 11s
905 850 430 24 58 14hepotoblastoma
1 $5 454 112 $ 9 $Ewing sarcoma
1 12 255 15$ 1 11 65 Mutations generating the genetic abnormalities contributing to cancer pathogenesis can be classified into two main groups (illustrated in figure 2): constitutional mutations gained via germiine ceil mutations; somatic mutations arising in one ceil, from which will ultimately originale the monoclonal proliferation. Thus, the methods employed to collect data in oncogenetics must study the constitutional genome and the tumoral genome. In this study, we have tried to use as much of these techniques to better characterise rare and orphan tumours.
Constitutïonal genome
H
Somatic
genome
Familial stucly
Tumour ceil chromosome anaIysis
Candidate
gene
Iapproach
L__j Moleculai DNA analysis
figure 2: Diagraîn ittustrating various genornic techniques used tostudyboth the constitutionciÏ andsomatictuinou rgenoine.
6
1. Study of the constitutional genome
1.1. Familial Studies
DNA sequences can be analyzed and compared by powerful genetics tools including genome wide linkage scans.
Linkage analysis exploits the phenomenon of recombination to localise disease genes relative to the known position of genetic markers
[31-
The segregation of each marker is compared to the segregation pattern of the disease phenotype within an affected family and measured by a logarithm of the odds (LOD) ratio. This calculates the likelihood that the marker is segregating with the disease gene if there is a lack of recombination. Afthough linkage analysis can pinpoint the legion containing the cancer predisposition gene to a domain much smaller than a chromosomal band, identification of the predisposition gene ultimately requires positional cloning approaches and detailed mutational analyses. Linkage analysis is a powerful tool in the hunt for cancer genes, however, it requires a large number of families to carry out the analysis, thus limiting the study of hereditary cases. Nevertheless, linkage analysis helped to clone many hereditary cancer genes over the years, including tumour stippressor genes [4-6].Tumour suppressor genes protect the cells from deregulated growth and division by controlling celI cycle progression or by driving damaged cells into apoptosis [7]. Knudson’s epidemiological studies on retinoblastoma led to the proposal of the “two-hit” model
[$1.
He prposed that retinoblastoma is a cancer caused by two mutational events causing the inactivation of a tumour suppressor gene. In the dominantly inherited form, one mutation is inherited via the germinal celis and the second occurs in somatic celis. In the nonhereditary form, both mutations occur in somatic cells [8]. Patients with a hereditary mutation of a tumour suppressor geneare at a much greater risk of developing tumors than the general population because the probability of acquiring a single somatic mutation is exponentially greater than the probability of acquinng two such mutations [9].
7 Later on, in 1997, Kinzler and Vogeistein refined this mode! by introducing the knowledge of caretakers and gatekeepers. Unlike the mutation-based definition of tumour suppressor genes, the division is based on function and have added complexity and power to the original hypothesis. Gatekeepers are genes that directly regulate the initiation of tumors by inhibiting growth of malignant celis or promoting death [10]. In contrast, inactivation of a caretaker gene does flot promote tumour initiation directly. Rather, inactivation leads to genetic instabilities which result in increased mutation of ai! genes, including gatekeepers [10].
1.2. Constitutional mutations screening in candidate gene
Another way to discover potential cancer causing genes is by candidate gene mutation screening. After the identification of a putative candidate gene, PCR amplifications of the coding DNA are performed in order to detect mutations. A variety of techniques can be used to peiform the mutation screening including but not limited to: sequencing, denaturing high performance !iquid chromatography (HPLC). and protein truncation test (PTT). Identifying mutations in several unrelated affected individuals strongly suggests that the correct candidate gene lias been chosen. After identification of mutations, several subsequent steps are required to further investigate the roTe of the mutated gene in ce!! lines or in anima! modeis. Identification of nove! genes driving celis to become cancerous can lead to improved diagnosis and patient counseliing. (http://www.ncbi.n!m.nih.gov/books/bv.fcgi?rid=hmg.section. 1959).
8
2. Study of somatic genome
2.1. Analysis of celi chromosomes (tumoral cytogenetics)
2.1 a) Chromosomes in tumoral ceils
Double helix DNA is tightly compacted in a cdl since it is wrapped around hïstone proteins. The nucleosome consists of 1.65 turns of DNA wrapped around the histone octamer complex which is further compacted into chromatin. During celi division, the chromatin strands become more and more condensed causing transcription to stop. This compact form makes the individual chromosomes visible, and they form the ctassic four arm structure, a pair of sister chromatids attach to each other at the centromere. The shorterarms are called p amis and the longer arms are called q amis (figure 2A). Humans have 23 pairs of chromosomes, which makes the diploid number 46. The diploid number is the number of chromosomes of a normal ceil. Chromosomes can be visualized by a technique knows as a karyotype.
atm 5ecs,darv Contrcitoh — Longcrntl rd 5eccndr-y CcrsVict:cn -Ch,rmst Metophasic Chromosome
9
A karyotype, generally done in but flot limited to GTG banding, is a technique that allows geneticists to visualize metaphase chromosomes under a microscope. The discovery of the correct number of chromosomes in humans was achieved in 1956 [11]. Ibis finding revolutionalized the world of genetics and allowed the association of well-recognized syndromes, such as Down syndrome, Turner syndrome and Kiinefelter syndrome with their specific chromosomal anomalies [12]. In cancer. one of the exciting findings was the identification in 1960 of a minute chromosome, later named the Philadelphia chromosome, which was regularly found in the peripheral blood of patients with chronic mye]oid Ieukaemia [13].
Karyotypes can be performed on virtually any population of rapidly dividing ceils either grown in tissue culture or extracted from tumours. However, one of the disadvantages of this technique is the difficulty to grow the tissue cultures. Karyotype analysis can also be performed with celis but requires up totwo weeks
to obtain a sufficient amount of celis for analysis. Even with these limitations, karyotypic abnormalities have been described in more than 10 000 human neoplasms analyzed by means of chromosome banding [14]. These aberrations are of two kinds: structural chromosome abnormalities (translocation, deletion, isochromosome, amplification) and numencal chromosome abnormalities (aneuploidies for example trisomie).
‘o
ï Transiocation
A chromosomal transiocation is a realTangement in which part of a chromosome is detached by breakage and subsequently joined to a non-homologous chromosome [15]. Chromosome transiocation can occur by various mechanisms and require a double-strand break at the chromosome level. Double-strand breaks can arise upon replication across a nick, and hence, ail factors that Iead to a nick might ultimately yield some double-strand breaks [16]. In addition, factors that cause a substantial amount of direct double-strand break formation also may cause transiocations. These include ionizing radiation, oxidative agents, and enzymes (such as type Il topoisomerases and recombinases) [16].
Even if ail genes are present in normal dosages, translocations or even inversions can alter the phenotype because of subtie position effects. The structural changes may involve an equal exchange of material between two chromosome regions (balanced chromosome transiocation) or may be non-reciprocal, such that portions of the genome arelost or gained (unbalanced chromosome translocation) [17].
Balanced reanangements, that have been characterized molecularly act by deregulating a gene in one of the breakpoints or by creating a fusion gene [1$].
Balanced, reciprocal translocations are common in haematological malignancies, while in solid tumours (sarcomas or carcinomas) virtually all rearrangements are unbalanced resulting in loss/gain of chromosome parts [19-21]. A large number of lymphoid malignancies are characterized by the activation of a silent proto oncogene through its relocation at the vicinity of an active regulatory element [221.
Proto-oncogenes are key players in the control of normal cdl growth and proliferation [1].
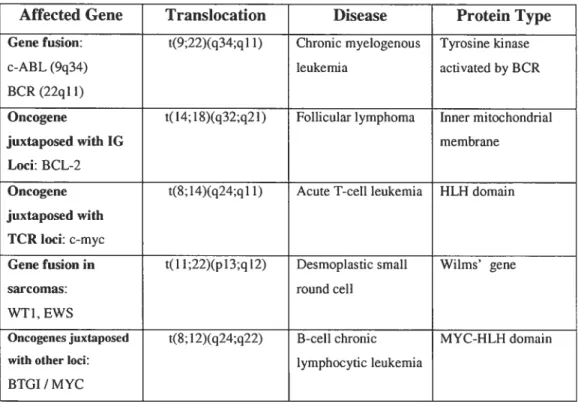
Several strategies were developed to identify oncogenes, representing mutated forms of proto-oncogenes, in human tumours. Methods include DNA transfection techniques and mapping of breakpoints in non-random chromosomal
rearrangements (The genetic basis of hitman cancer, Chapter 10; illustrated in Table IV). The mechanisms that cause these translocations remain poorly understood. Illegitimate V(D)J recombination, class switch recombination,
n
homologous recombination, non-homologous end-joining and genome fragile sites ah have potential roles in the production of non-random chromosomal translocations [15]. More than 100 oncogenes have been identified and associated with some form of cancer.
Table III: Mapping of some breakpoints in non-random chromosomaÏ rearrangements allowed oncogene identification (Table front The genetic basis of human cancer, Chapter 11: Oncogenes,Morag Park, p. 211)
Affected Gene Transiocation Disease Protein Type
Gene fusion: t(9;22)(q34;ql 1) Chronic myelogenous Tyrosine kinase
c-ABL(9q34) leukemia activated by BCR BCR (22q11)
Oncogene t(14;1$)(q32;q21) Follicular lymphoma Inner mitochondrial
juxtaposed with 1G membrane
Loci: BCL-2
Oncogene t($;14)(q24;qll) Acute T-cellleukernia HLH domain
juxtaposed with TCR Ioci: c-myc
Gene fusion in t(Il;22)(pJ 3;q 12) Desmoplastic small Wilms’ gene
sarcomas: round ceil
WTI, EWS
Oncogenesjuxtaposed t($;12)(q24;q22) B-cell chronic MYC-HLH domain
with other Ioci: lymphocytic leukemia
12
ii Deletion
A chromosomal deletion can occur on any chromosome and can vary by size. Consequently, the outcome of the deletion depends on the genes contained in the lost region. The loss of chromosomal regions containing a tumour suppressor gene is a key event in the evolution of epithelial and mesenchymal tumors and it is further discussed later on in the text [23].
iii Isochromosome
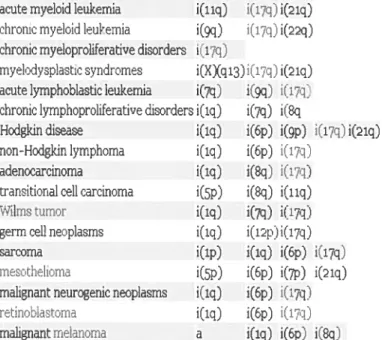
Isochromosome formation resuits when one arm of a chromosome is lost and the remaining arm is duplicated, resulting in a chromosome only consisting of either two short arms or of two long arms. An isochromosome has identical genetic information in both arms. Isochromosomes are observed in 10% of cancer cytogenetic examinations (illustrated in table III).
Table IV: Eramples of isochromosome-assoczatedfor example in solidtumoursor leukemias, table froni: wwu’.huaipath. com
acute myeloidleukernia i(llq) i(17:j) i(21q) chronic myeloid leukemia i(9q) i(17q)i(22q)
chronic myeloproliferative disorders i(17q)
myelodvsoiastic cyndrornes i(X)q13)i(17q) i(21q) acute lyrnphoblastic leukernia i(7q) i(gq) i(ii:;J chronic lyrnphoproliferative disorders i(iq) i(7q) i(8q
Hodgkin disease i(lq) i(6p) i(9p) t17q i(21q)
non-Hodgkin lymphoma i(iq) i(6p) i(17q)
adenoearcinorna i(iq) i(8q) i(i:1
transtiona1 ceil carcinome i(5p) i(q) i(iiq)
Wilrns tum:r i(iq) i(7q) i(r:j)
germ oeil neoplasrns i(iq) i(icpii(17q)
sarcome i(ip) i(iq) i(6p) i(174J
mesothelioma i(5p) i(6p) iQ7p) iQiq) malignant neurogenic neoplaoms i(iq) i(6p) i(17q
retinobiactomna i(iq) i(6p) i(17q)
13
iv Amplification
Another method transforming a proto-oncogene to an oncogene is by amplification of restricted regions of the genome. Amplification represents one of the major molecular pathways by which gene expression is constitutively enhanced above the level of physiologically normal variation
[24].
Increase of the gene dosage by DNA amplification is a common genetic mechanism for upregulating gene expression in tumorigenesis. Amplification values usually are above five copies, often can reach 500 or more gene copies [24]. Neuroblastoma patients’ prognosis can be determined by the copy number of the MYCN (myc myelocytomatosis viral related oncogene, neuroblastoma denved) oncogene [25]. Another example of an oncogene amplification is the EGFR (epidermal growth factor receptor) amplified in 34% of glioblastomas and constitutes a potential target for therapy [26].Amplification of an oncogene can be caused by an unscheduled replication during celi division or if paîÏ of the DNA is excised following ioop formation (Figure 3) [24]. Chromosomal regions which are amplified can be visualized by double minute chromosomes (DMs) or homogeneously staining regions. DMs are small, paired, usually spherical chromatin bodies consisting of genes amplified in an extrachromosomal location [27]. In a later step, they may integrate into chromosomes to generate intrachromosomally amplified structures known as homogeneously staining regions (HSRs). On the other hand, amplifications known as tandem amplification can occur in situ, not extrachromosomally, and can be tandem repeats of varying sizes. DMs and HSRs can be found in virtually any type of solid human tumors.
14
Â!
—j
—
2
A
B
repucation
ik
excisi/
JII[WZ:: ÏZIIi.
11
iflteciratiOr
ampliff cation
• —
HSR
figure 3: DNA amptificcition. Unscheduted reptication during ceÏÏ division (A) or
partial DNA excision fotlowmg toopformcttion (B) can resutts but is not li,nited in DNA amplification. In normdd celis the MYCN gene is tocali:ed as a single copy
on chrc)nwsome 2, wÏzereas ceits
with
ampiificcttion have itp to severat hundredcopies, generallv located in an HSR on another chromosome (in this case
chromosome 1])
[241.
15
y Trisomies
The altered transcript levels in cancer genome can be caused by altered gene copy number changes such as a gain of an indivïduai chromosome. Previous resuits from laboratones have implicated a foie of chromosomal trisomies in various cancers. Hepatoblastoma, the most frequent maiignant iiver tumour in chuidren, is associated with recurring trisomies of chromosomes 2, 8, and 20
[281.
2.1 b) Cytogenetic tools in cancer genetics
I. Molecular Cytogenetic
Cytogenetic approaches are designed to detect aberrations and reanangements under direct examination of chromosomes and chromosomai targets [29]. G banding, fluorescence in situ hybridization (FISH), spectral karyotyping (SKY) and comparative genomic hybridization (CGH) are the commonly used methods.
ii. G-banding
G-banding evaluates stained metaphase chromosome spreads to identify rearrangements and gains or iosses of chromosome hands. The major advantages of G-banding consist of the stabiiity and high resolution of the Giemsa staining; it is aiso easy to use, highly reproducibie, and inexpensive [30]. However, there are major disadvantages to this technique. It requires the analysis of metaphase spreads which are not aiways possibie to obtain due to ecu-culture faiiure or poor chromosome morphology. Aiso, it has a iimited resoiution of one hand (about 2000-4000 kb in size) and cannot be used to detect very smaii deletions impiicated in many microdeletion syndromes [31]. Finaily, it cannot be used to study interphase ceils. In recent years, new moiecuiar cytogenetic technologies have rapidly developed and revoiutionized the diagnostic applications of chromosome analysis.
16
iii. fISH
Fluorescence in situ hybridization (FISil) is a powefful molecular cytogenetic technique which allows rapid detection of aneuploidies, transiocations, on metaphase spreads and interphase celis. FISH technology uses probes that are specific for the sequence of interest and evaluates alterations at the specific locus on a cell-by-cell basis. FISH analysis provides a more accurate assessment of the entire population of celis in a given sample because both interphase and metaphase celis can be assessed. Also, it has advantages over G-banding in terms of speed and celi-scoring ability [32]. However, the numbers of commercially available probes are limited and they do not cover the whole genorne. With the help of the completion of the human genome, it is now possible to use bacterial artificial chromosome (BAC) probes to surpass the lack of commercially available probes. DNA sequences spanning the human genome have been cloned and inserted into different vectors including BACs. BACs are particularly useful tools because they can divide indefinitely in culture, and can be used to package relatively long lengths of DNA sequence [33, 34]. Labelled BACs, usually by nick-translation, can be used to detect chromosomal abnormalities virtually throughout the whole genome.
Advances in FISH technology involve the use of spectral karyotyping (SKY) and multiplex-fish (M-FISH). SKY uses 24 different probe sets to virtually paint each metaphase chromosome with a different color. This technique involves the simultaneous excitation of multiple fluorochromes and the use of an intefferometer to determine the profile at each pixel. Multiplex-FISH is similar to SKY except that a fluorescence microscope is used for the image analysis [13]. Multicolour FISH analysis can contribute to the diagnosis of patients with apparently normal karyotypes displaying minute abnormalities flot detectable with low resolution methods [31].
17 iv. CGH array
The preparation of high-quality metaphase spreads, especially from solid tumours, is often difficuit. To overcome this problem, comparative genomic hybridization (CGH) was developed using extracted tumoral genomic DNA. This is a powerful technique which allows the detection of segmental DNA copy number changes. Differentially labelled tumour DNA and control normal DNA are co-hybridized to a metaphase chromosome spread, producing an average fluorescence ratio profile at approximately 20 Mb resolution [13]. This resolution limitation can be irnproved by the use of array CGH.
In anay CGH, chromosomal targets are replaced by anays consisting of welJ defined genomic clones such as Bacterial Artificial chromosome (BAC), Pi dervided artificial chromosome (PAC), both grown in bacteria or Yeast Artificial Chromosome (YAC) grown in yeast. They are spotted onto a microscopic slide glass using robotic devices. Since the clones spotted on slide-glass contain sequence information directly connected with the genome database, we can easily obtain particular biological aspects of genes mapped within the regions involved in a copy number aberration. This facilitates the identification of genes responsible for cancer as well as unknown genetic diseases. Several companies now offer CGH platforms. For example, NimbleGens human whole-genome array CGH platform and Agilent technologies high-definition CGH (HD-CGH) microarrays permit researchers to design their own CGH microarrays to target specific “hot spots in the genome [35].
The principles of the CGH array are explained in Figure 4a) and 4b) and consist of the following steps:
(A) BAC clones are selected from a physical map of the genome.
(B) DNA samples are extracted from selected BAC clones and their identity is confirmed by DNA fingerprinting or sequence analysis.
(C) A multi-step amplification process generates sufficient material from each clone for array spotting. Each clone is spotted in replicate onto a solid support.
1$
(D) Reference DNA and test DNA are differentially labeled with cyanine 3 and cyanine 5 respectively.
(E) The two labeled products are combined and hybridized onto the spotted siide.
(F) Images from hybndized siides are obtained by scanning in two channels.
(G) Signal intensity ratios from individual spots can be displayed as a simple plot.
(H). or by using more complex software that can display copy number alterations throughout the whole genome
rin’ Preparatioti A.
—. GenoineII))I%%ttHIIl
J
‘ça
0 O0O00 B. st.etgggg
ci 00000000 oooooooo 00000000 00000000IItl’IiI1 iiiH \( I)\
& Ifthsi d pJrtine solttlioits
C. Siuing D’Aotito iiiielu,ntn IitIes
.iiiii I... PIoI)e F’tCI)aflltiOIl D. I Tissue Mieroilis.iciïon & 1)N i.i.iIirlon
L
‘i
w b tÇi•niiI IestIY RcfervneiDNA.
faninv3 (anine5 lahi lcd laheittiE, Uo-h hritlizatiiinid nuimal anti lest DA probes
Figure 4a: Principle ofarray CGH, part] (Image and textform [29])
D
9 r-(n (n t.t () -4 = Lcg2 Signal lntensity G) Rtis -il II -r -iia liii zam il 11 R-I 1 -t— II -ILI .ï.iu • IRLt1II îJ I I -IIIUJ1 — [I 4L -—-L
I’) IIII. •I_r20 One of the main advantages of CGH is that it does not require an a priori knowledge of chromosome imbalance and can be used as a powerful screening tool in the field of genetics. CGH array does have some limitations: it can flot detect smaller deletions than its resolution permits, balanced chromosomal transiocations, inversions and whole genome copy number (ie. the loss of one allele followed by reduplication of the remaining allele is not detected [13]).
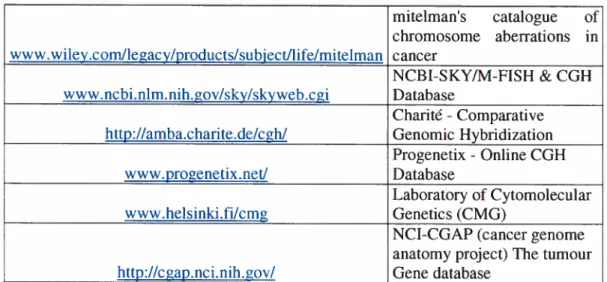
As cytogenetic methods are widely used in both clinics and in research laboratories. profile databases have been assembled for public access. The main public online databases are presented in Table V.
Table V: Online cyrogenetic resources
mitelman’s catalogue of chromosome abetTations in www.wiley.comllegacy/products/subject/hfe/mitelman cancer NC3I-SKY/M-FISH & CGH www.ncbi.nlm.nih.gov/sky/skyweb.cgi Database Charité -Comparative
http://amba.charite.de/cgh/ Genomic Hybndization Progenetix - Online CGH
www.progenetix.net! Database
Laboratory of Cytomolecular www.helsinki.filcmg Genetics (CMG)
NCI-CGAP (cancer genome anatomy project) The tumour http://cgap.nci.nih. goy! Gene database
21
3. Studies of tumoral genome (somatic anomalies)
3.1. Molecular DNA analysis
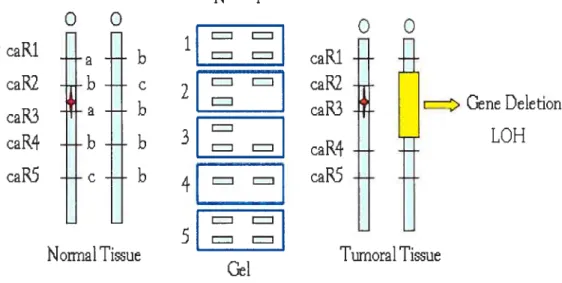
Genomic DNA obtained from tumoral tissues is an essential asset to study genetic variations causing oncogenesis. An important event occurring in the tumoral genome is chromosome deletion involving a suppressor gene. Unlike oncogenes, for most tumour suppressor genes, both alleles need to be inactivated. TSG being recessive, cells that contain one normal and one mutated gene are referred to as heterozygous and stiil behave normally. However, silencing the remaining normal suppressor gene predisposes the ceil to develop into a tumour following a “loss of heterozygosity’ (LOH). In the case illustrated in Figure 5, the allele illustrated by the microsatellite marker caR2 and caR3 is consïdered heterozygous, thus informative. However, if a second hit occurs (in this case a loss of chromosomal region illustrated in yellow) the remaining tumour suppressor gene is inactivated and the cell can no longer sustain normal ceil proliferation. When amplifying the microsatellite marker at this region, a LOH can be observed on the gel upon analysis of the tumoral tissue.
NT
o
o
o
o
caRi
-RcaR2
b
çt
c.aR2
a
b
I
raR3
z>GeneDe1etion
LOH
- - = =caR4
caR5
e
b
_______caPS
Nonïial Ti3ue
Tumoral Tissue
Gel
22
A loss of DNA can occur with unbalanced chromosomal transiocations, chromosomal deletions. and mitotic nondisjunctions [36,
371
(illustrated in Figure 6).WT mutated
—t-I
Heterozygous
I
figure 6: Chromosoinal nondisjunction. One dattghter ce!! caii inherit onÏv oie
chromosome, bearing tue mutant atiele, while tue other iitherits three chromosomes (the one bearing the mutant atiele as well as two normal chromosomes). In this example, LOH reflects a true redttct,on to hemLvgosiev.
However, a hemizygous deletion leading to a copy number reduction is flot the only event causing the inactivation of a tumour suppressor gene. A variety of different genetic events underlie LOI-I, including point mutation, mitotic nondisjunction followed by replication of the remaining chromosomes, mitotic recombination (illustrated in Figure 7) and gene conversion [381. These LOH mechanisms do not lead to DNA copy number changes and are therefore refelTed to as copy-neutral events [39].
23 GI SIG2 M 3IZZEEX) I. ________ L —- - C_LZEX) ____ID
:
10H ___ -I prepIiction recombination seg regation
figure 7: Mitotic recombination. RecombinationaÏ exchange between two sister
chromatids ofhomotogous chromosomes during tate S- or G2-phase ofthe celi
cycle cotises mitotic recombination. When resolution of the recomnbmational
intei7nedtate resutts in u cross—over event, daughter cetïs may, fotiowing in ttosts
(iii), shoi’ loss—of—heterozvgositv (LOI]) withottt u net reduction in chromosomal
copy ntunber [38].
Thus, the use of the term allelic imbalance to describe LOH resuits may be technically more accurate. The most reliable method to characterize allelic imbalances should have the ability on one hand to provide a locus-specific genotyping and on the other hand to quantify accurately the copy number of each allele.
To date, many articles published studies on LOH without necessarily identifying definite genes causing cancer. By combining this enormous amount of data into a LOH database, including both positive and negative resuits would help defining the minimal region of chrornosomal loss and the subsequent identification of putative tumour suppressor genes [40].
24 There are three major techniques used in LOU studies:
a) Southern blotting analysis of restriction fragment length poiymorphism. b) Microsatellite Marker Amplification,
c) High-resolution single-nucleotide polymorphi sm array.
3.1 a) Southern blotting analysis of restriction fragment length polymorphism
Loss of tumour suppressor gene function in the progression from normal to cancerous ceils can be detected by assessing the loss of heterozygosity. These studies have traditionally been performed using Southern blotting-based analysis of restriction fragment iength polymorphisms (RFLP) [41,
421.
This method differentiates an individuals parental alleles at a given locus and allows an assessment of LOH by simple comparison of the allelic patterns detected in matched pairs of normal and DNA samples. The study of LOH by Southern blot is hmited by the low heterozygosity rates of RFLP and by the requirement for reiatively large amounts of homogeneous high molecular weight DNA. It is difficult to study small endoscopic biopsy specimens or microdissected surgical resections by using southern blotting-based analysis of RFLP. Moreover, paraffin embedded archivai pathology samples are not amenable to Southem blot analysis because of extensive DNA degradation[431.
For these reasons, more efficient and less time-consuming methods are used to study LOH.3.1 b) Microsatellite marker amplification
Microsatellites are among the most variable types of DNA sequence in the genome. Among dinucleotides, (CA) repeats are most frequent, followed by (AT), (GA) and (GC) [44J. Genetic variation at many microsatellite loci is characterized by high heterozygosity and the presence of multiple alieles. Thus, microsatellites are a great tool for loss of heterozygosity analysis. PCR amplification of samples is done by using the polymorphic repeat marker and is compared to the matched normal DNA. When LOH analysis is extended to multiple chromosomal arms, a distinct allelotype is generated
[45].
25
Ruorescence-based DNA sequencing technologies facilitated the detection of loss of heterozygosity (LOH) by replacing the use of radionucleotide-based detection with automated generated data. This new system enables automated size determination, linear quantitation of alleles, and computenzed discrimination of true alleles versus stutter hands [461.
Laser capture microdissection can now permit the obtention of highly purified samples, thus allowing a better analysis of LOH [47, 48]. However, the resolution for whole genome scanning is Jimited to 5 cM with commercially available sets of primers, and the process for whole genome analysis is long and tedious and requires a matching normal sample
[491.
Microsatellite markers generally require individual amplification reactions or at best only a limited multiplex assay. An average of 120 microsatellites has been used to determine the allelotype of multiple different human neoplasms in a series of studies before 1995. The highest density allelotyping published before the year 2000 consisted of approximately 280 polymorphic markers [50]. Recently, a more efficient method of genome wide allelotyping by using single nucleotide polymorphism array has been developed.3.1 c) Higli-resolution single-nucleotide polymorphism array
High density single-nucleotide polymorphic allele arrays permit the generation of genome-wide loss of heterozygosity maps [50-53]. Single nucleotide polymorphisms (SNPs) are the most common genetic variation in the human genome and can be used to search for germline genetic contributions to disease. The density, distribution, and allele specificity of SNPs makes them attractive for high-resolution analyses of LOH and copy number alterations in cancer genomes [54-59]. In 2004, we thought it might be interesting to use this high throughput method to study rare paediatric cancers. At the time, only a few studies were published on cancer genetics using the Affymetrix SNP array [53, 60, 61]. These studies showed that most affected LOH regions were consistent with those observed in previous LOH studies using microsatellite marker amplification, lending validity to both the rnethods and their resuits.
26
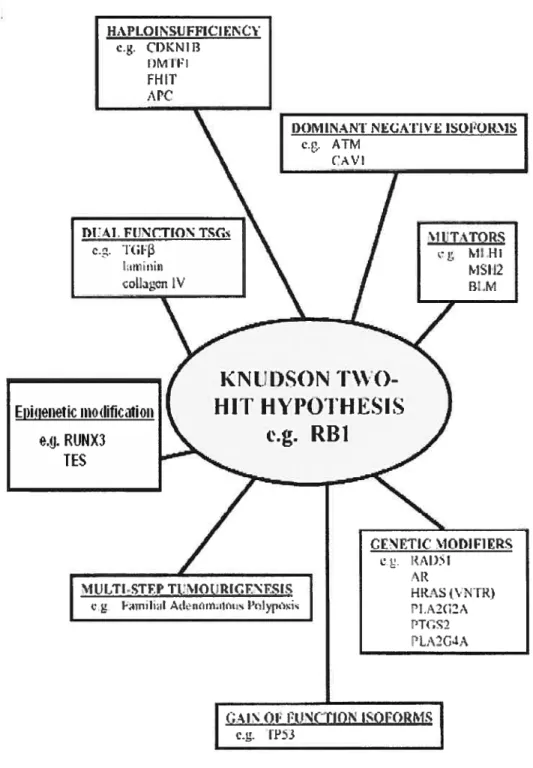
However. LOH studies do flot clearly define a cancer gene; many candidate genes in a region of LOH are needed to be tested for mutation. amplification and promoter methylation before assigning a specific gene to a specific cancer. Methods complementary to DNA analysis, such as mRNA and protein expression microarray, will also provïde important corroborative evidence [40]. These approaches can be limited when genes that do flot follow the classical definition of tumour suppressor genes are studied. Indeed, many tumour suppressor genes do flot fit the classical definition of tumour suppressor genes and the Knudson two hit hypothesis (illustrated in Figure 8) [621.
27
figure 8: Alternativemechanisms causing the inactivation oftumour suppressor
genes. The ittustrated mechanisms represent alternatives to the Knudson two-hit h)lpOthesis [62].
2$
These genes deviate from the classic tumour suppressor gene definition in the sense that they can arise from:
(j) Monoallelic disruption (mainly explained by haploinsufficiency where a reduction of 50% in the level of gene function is sufficient to generate an abnormal cellular phenotype),
(ii) Multiple gene interaction (cg. the Familial Adenomatous Polyposis mode!),
(iii) Epigenetic inactivation in one or both a!leles.
Because of the heterogeneous nature of the alterations observed, a comprehensive approach is required to fully characterize the molecular pattems of tumour suppressor gene inactivation. Another method, not previously discussed, has been developed to analyse genomic imprinting, also known as epigenetic inactivation.
3.1 d) Genomic imprinting and methods of detection
Certain ceils of the embryo are omnipotent; their genes are ail potentially active and available for transcription. During development, some genes need to be activated, whereas others are inactivated to allow differentiation [63]. However, cancer ceils are able to reactivate the once-silenced genes allowing a growth benefit or to inactivate genes that hinder growth. Cancer cells essentially use the same machinery and cascades as do normal cells to benefit their growth. The epigenetic mechanisms contributing to the deveiopment of cancer include global DNA hypomethylation, hypermethylation and hypomethylation of specific genes, chromatin alterations and loss of imprinting [64].
29
Genomic imprinting is an epigenetic modification of a specific parental allele
[641.
These modifications lead to a differential expression of the two alleles of the gene in somatic celis of the offspring. Many mammalian imprinted genes regulate celi growth, differentiation, and apoptosis. It has also been shown that genomic imprinting plays a major role in tumorigenesis. Loss of imprinting (LOI) refers to the activation of the normally silenced allele or the reverse, the silencing of a normally active allele.
Analysis of mice can’ying uniparental disomies or duplications, by microanay screening and stringent bioinformatics allows a large-scale tissue-specific screening for imprinted genes [65].
30
CHAPTER II. HYPOTHESIS
The study of rare paediatnc and orphan tumours has many limitations: they limited access to fresh or frozen cancer tissue samples, absence of mitosis to study chromosomal aberration and degiadation of DNA in paraffin embedded tissue. For ail to these reasons. the study of these tumours is extremely difficuit limiting our knowledge about their genetic information. To overcorne these problems, we hypothesize that combining low-throughput methods (iFISH, microsatellite analysis) with a new high-throughput tumoral genotyping method could improve characterization of tumour samples and increase our knowledge of molecular oncogenetic pathways.
CHAPTER III. OBJECTIVES 0F THE PROJECT
The purpose of the present study was to develop new experimental methods to study rare paediatric cancers. To do so, we examined both well characterized tumours and tumours with limited molecular knowledge to determine which method is best suited to improve information gathenng. Our goal is to improve diagnostic and therapeutic approaches and, uhimately, enhance individual clinical outcome.
The specific objectives were:
1. Use previously diagnosed samples of nephroblastoma (Wilms’
)
with known chromosomal deletions to validate the Illumina Sentrix Human-1 SNP BeadChip array.2. Use two orphan tumors as models to analyse classical genetic and high throughput techniques:
A. First model: Infantile Myofibromatosis,
B. Second model: Intestinal Epstein-Barr vïrus-associated smooth muscle tumour
31
CHAPTER IV. MOLECULAR CHARACTERIZATION
0F RARE PAEDIATRIC TUMOURS
A. SNP array validation
B. Infantile Myofibromatosis
32 A. Single nucleotide polymorphism array to test LOH in Wilms’ tumours
1. Rational for Wilms’ selection
We chose Wilms’ to test the Illumina platform because it is the most common abdominal tumour in chiidren and it permits us to have a good amount of sampies to be tested. Also, its cytogenetic and moiecular data are well known permitting us to recognize known chromosomal aberrations in our Wilms’ samples and allowing us w validate the SNP platform before using it to investigate our rare paediatric tumors.
Sporadic development of Wilms’ tumours is associated with chromosomal deletions at both bands llpl3 and llpl5. In 45% of sporadic cases, sub-band I lp15.5 LOH is present with a selective ioss of the maternai ailele and a duplication of the paternai allele [36]. Other observations of LOI-l at lp, 4q, 7p, 14q, 16q in sporadic Wilms’ tumours identified additional regions of the genome that may harbour important genes in development [36].
With these known chromosomai aberrations in mmd, we used Wilms’ samples to test the Sentnx Human-l SNP BeadChip array. First. we identified LOH in our 25 Wïlms’ samples (DNA was extracted for 25 patients, normal gDNA was extracted from unaffected lddney and tumoral gDNA was extracted from the tumour) by amplifying microsatellite markers on chromosome 11. Once the LOH regions were mapped, we compared the results of microsatellite amplification with the SNP array data in 6 patients, with or without LOF! on chromosome Il.
2. Sampie selection and DNA extraction
25 Wiims’ tumours were collected from patients who underwent surgery at the CHU Ste-Justine. In cadi case, the diagnosis was confirmed by the Pathology Department at CHU Ste-Justine. DNA was extracted with standard phenol/chloroform purification.
33
3. Loss of heterozygosity (LOH) analyses by (CA) microsatellites PCR amplification
a. Methods
Matched normal and tumoral tissues were amplified with microsatellite markers (ordered from Invitrogen and detailed in figure 9) for chromosome covering regions 11p15 to llpl3. In this approach, the forward unlabeled microsatellite primer is synthesized with an M13 forward primer sequence on the 5-end
(5-CAC GAC GTT GTA AAA CGA C-3). An M13 IRDye $00 (LI-COR part # $29-05565) was included in the PCR reaction. The M13 dye is added to the PCR product during the first few cycles of amplification thus labelling the PCR product. This method requires no purification prior to gel analysis.
PCR amplification was carried out in a 10 tl reaction volume containing: 25 ng of
genomic DNA template, iX standard buffer with I U Platinium TAQ (Invitrogen), 0.2 M of forward and reverse primer, 0.2 mM dNTP, and 1.0 pmol M13 FWD
(-29)/IRDye $00. PCR cycles were adapted for each microsatellite, including 10-minute denatunng step at 95°C , 26-30 cycles of 15-second denaturation at 95°C,
30-second annealing step at 55°C, 1-minute elongation step at 72°C and 5-minute final extension step at 72°C. The PCR products were mixed with bromphenol bÏue containing loading buffer (LI-COR part # $30-05629), separated by electrophoresis on 6.5% polyacrylamide gel and detected by laser fluorescence using a LICOR autornated gene sequencer (LI-COR).
34 15.E 14
I)11S133S
1t I _________I)11$131F
I)11S921
14 I _________I)11S928
1I)11S90
11.22I)11S1360
1h1
11 — — 1.7 1a
t 13.1q
14i 14. 14.3 21 12 1 22 1 .7 .7.7 24 2EChromosome 11
figttre
9.
MicrosateÏÏite inarkers ttsecÏ in lie LOH stttdvwith Wil,ns’ sampÏes.These markers were selectedfrom tue 1993-94 Genethon hiinian genetic tinkage mctp publishedin[66].
b. Resuits
As expected [36], some Wilms’ samples (11 out of the 25, representing 44%) showed a loss of heterozygosity in the regions I lp15 and llpl3. The detailed map of chromosome deletion for the 25 patients is illustrated in table VI.
D
D
35 Table VI: Chromosome detetion map after ampttjï cation of chromosome J] markers in 25 Wilms’ tumours. Some microsatettite markers did not ampttfy and are indicated by an interrogation mark(?).
With
the comptetion of the detaited map of the toss of heterozygosity, we setected 6 specific Wilms’ samples (indicated by an X in the table) to test the Illumina ptatform. T19 T20 T21 T22 T23 T24 T25 T22 Legen Non-informative (mooozyouo) Retentiorr of heterozygooity [OH 2 Marker rot arrrplifnd Ti T2 T3 T4 T5 T6 T7 T8 T9 T1OT11 T12T13T14T15T16T17T18SNPplatformX
X
X
X
X
X
CA0markers
Ti T2 T3 T4 T5 T8 T9 T1OT11 T12T13T14T15T16T17T18T19T20T21 T23T24T25 D11S1338 ? D11S1307I
— D11S921 ? ? D11S928 ? ? ? ? ? ? ? ?Z
? ?36
4. Tumoral genotyping with Illumina SNP array
In recent years a variety of studies have emerged measuring total chromosomal copy number at increasingiy high resolution by using the Affymertix SNP platforms [36, 50, 54, 61, 67-69]. Since 2005, Illumina platform is available at Genome Quebec allowing easy access to data analysis for a lower price range.
Illumina Inc. currently manufactures several formats of high-density SNP genotyping arrays; the Sentrix Human-1 SNP BeadChip (109k SNPs, 70% of which are located in exons or within 10kb of transcripts), the HumanHap300 (317k tag SNPs), and a higher-density HumanHap55o (550k tag SNPs) [70]. The Illumina platforms were initially tested by using cancer ccli line HL-60 human promyelocytic leukemia containing several well characterised chromosomal deletions and amplifications [71]. To our knowledge, these platforms were not yet used to examine aberrations in cancer samples obtained from patients. For this reason, it was important to test this new platform with our collection of Wilms’ tumours before using it to study rare paediatric cancer.
4.1. Sentrix Human-1 SNP BeadChip anay
The Sentrix Human-1 SNP BeadChip with a total of 109 000 SNPs was used for this study (illustrated in figure 10). The average spacing between SNPs on the Human-1 SNP BeadChip is 26 kb; median spacing is 13 kb. The Infinium WGG assay was employed for the high resolution analysis and profiling of both LOH and DNA copy number changes in constitutional and samples. The Infinium Whole Genome Genotyping (WGG) procedure is composed of four automated steps: (1) whole genome amplification, (2) hybridization to a specific and sensitive oligonucleotide probe array, (3) an array-based SNP scoring assay, and (4) signal amplification [72]. The procedure is illustrated in figure 11 and summarized in figure 13. The infinium protocol process minimizes the amount of time, sample volume and material required to carry out tumoral genotyping.
37
——4
4figure 10: The sentrix Human-] SNP BeadChip attows processing of 8 samptes at a tirne; cost of approximatelv 600$ per sainpte.
4.2. New array-based whole-genome genotyping (WWG) assay
The DNA sample used for this assay is isothermally amplified overnight. Additionally, a relatively low DNA sample requirement (750 ng) is sufficient to assay 100,000 SNP loci. The amplified product is then fragmented by a controlled enzymatic process which does flot require tedious gel analysïs. After alcohol precipitation and resuspension, the BeadChip is prepared for hybridization in the capillary flow-through chamber; samples are applied to BeadChips and incubated overnight. The amplified and fragmented DNA samples anneal to locus-specific 50-mers (covalently linked to one of over 200,000 bead-types) during the hybridization step. One of two bead-types corresponds to cadi allele per SNP locus. After hybridization, allelic specificity is conferred by enzymatic extension known as allele-specific primer extension and the SNP scores are then analysed with BeadStudio visualization tool Illumina genome viewer (IGV).
3$
(N RGURE 1 INFINIUM PROTOCOL
GENOMIC DNA 750ng:e
I I IïI I
O
PparBedChipQ
Ait-cII gntyps nd enrat IcttSteps 1 and 2: DNA amplification.
Step 3: Fragmentation ofamplified produet. Step 4: Alcohol precipitation and resuspenstol?. Step 5: Preparation ofthe BeadChip.
Step 6: Hybridization step.
Step 7: ProductsarefluorescentÏy stained
Steps 2 aiul 9: Anaiysis of the auto eau genotypes and generated reports. http:Uwww.illumina.com/General/Products/SNP/pdf/INFIATWKFLOW.pdf
DAY2
DAY3
e,O
Etiid!$tai; smpIson adCIip‘I,
ÏO
Fiagrniit arnphfid DNA4
O
PcIpItat& unpo.nd‘t
O
MkmphftedONA‘L
O
Incuba arnpIifitioiifigure 11: Illumina Workflow.
O
Irnag BadChip“r
1
ï---?
e ‘Il
39
4.3. Allele-specific primer extension (ASPE)
For the Infinium I assay adapted for the Sentrix Human- 1 SNP BeadChip, two beads (A and B) for each SNP are used to score the SNP site. The probe sequence of these beads differs only at the 3’ terminal base (opposition SNP site), creating an allelic discrimination in the polymerase extension. In this assay, known as allele-specific primer extension (ASPE), the perfect matched bead type will preferentially extend over the mismatched bead type and gets labelled (Figure 12)
[72].
The genotype state of a given SNP locus (AA, AB, or BB) is determined bythe intensity ratio between the two corresponding bead types. To do so, the BeadChips are scanned with a two colour confocal Illumina BeadAnay Reader. The fluorophors generated during signal amplification/staining extension products are excited, the image intensities extracted, and the resultant data are analysed to determine SNP genotypes using Illuminas BeadStudio software [721.
A
InfiniumiAllele-Specific Primer Extension
£&ici type -- 5 !.lIs A —-—--——--————— —.——-- T • t.vn \. fDNA A ______________ 5• -A A o3ci type
(
B ____________ G t DNA --A -A eI A40
‘o
— —
— —
— —
I
!eAArray
of capture probes (1 bead typelallele)
“A/B”
AIleIe A’ Allele B Aflele A
Extension and unlform, single color labelîng
I
II
Locus One
Locus Two
figure 13: Suinmary ofthe Infinitim assay.
The infinium assay usesthe complete complexity ofthe genome. Afler whole genome amplification, ASPE is used to score the SNP site, requiring two beads Jbr ectch SNP.
41
4.4. Data visualization
To visualize the resuits. the data for a particular SNP is plotted as polar coordinates. The x-axis represents theta which is the angle deviation from pure A signal, where O represents pure A signal and 1.0 represents ptire B signal, and the y-axis represents the distance of the point to the ongin. Data are normalised by the GenTrain/GenCaII normalization algorithm (figure 14). The latter removes outiiers, adjusts for channel-dependent back-ground and global intensity differences, and also scales data [71].
GS0002200-CLt.02-JA1 2707 QSO0OErUUU-DNA402-N12i07 24Ç4 t e...
.-L
— 03 0M 060 003 I [iomTb,tafigttre 14: Normaïi:ation Tttrned Off &Normahzatton Tumed On (© ]llttmina
BeadStudio Genoiyping Moditle User Gttide Mantial) The X anci Ycotor
channels ttndergo anaffine coordtnate trctnsformation to make the data appear as
canonicat as possible with the homozygotes.