HAL Id: halsde-00352350
https://hal.archives-ouvertes.fr/halsde-00352350
Submitted on 25 Jan 2021
HAL is a multi-disciplinary open access
archive for the deposit and dissemination of
sci-entific research documents, whether they are
pub-lished or not. The documents may come from
teaching and research institutions in France or
abroad, or from public or private research centers.
L’archive ouverte pluridisciplinaire HAL, est
destinée au dépôt et à la diffusion de documents
scientifiques de niveau recherche, publiés ou non,
émanant des établissements d’enseignement et de
recherche français ou étrangers, des laboratoires
publics ou privés.
Comparison of nitrogen monoxide emissions from several
African tropical ecosystems and influence of season and
fire
Dominique Serça, Robert Delmas, Xavier Le Roux, Dab Parsons, M. Scholes,
Luc Abbadie, R. Lensi, Ophélie Ronce, L. Labroue
To cite this version:
Dominique Serça, Robert Delmas, Xavier Le Roux, Dab Parsons, M. Scholes, et al.. Comparison
of nitrogen monoxide emissions from several African tropical ecosystems and influence of season
and fire. Global Biogeochemical Cycles, American Geophysical Union, 1998, 12 (4), pp.637-651.
�10.1029/98GB02737�. �halsde-00352350�
GLOBAL BIOGEOCHEMICAL CYCLES, VOL. 12, NO. 4, PAGES 637-651, DECEMBER 1998
Comparison of nitrogen monoxide emissions
from several African
tropical ecosystems and influence of season and fire
D. Ser(;a
•, R. Delmas
•, X. Le Roux
2'3,
D.A.B.
Parsons
4, M.C.
Scholes
5, L. Abbadie
2,
R. Lensi
6, O. Ronce
2, and
L. Labroue
7
Abstract. NO emission
rates
from soils
were
measured
for twelve
major
African
ecosystems
in
four countries
(Congo,
Niger, Ivory Coast,
and South
Africa)
and within four major
phytogeographic domains: the Guineo-Congolese, Guinean, Sahelian, and Zambezian domains. Measurements were performed during wet and/or dry seasons. All the measurements were made
with the same
dynamic
chamber
device,
which
allowed
true comparisons
to be made.
This study
showed
that emission
rates
strongly
differed
between
ecosystems
and exhibited
a marked
temporal
variability.
Ecosystem
effect
was highly significant
during
both the dry and wet seasons.
Emission
rates
were low (<0.6 ng NO-N m s ) m Hyparrhema
and Loudetta
savannas
of the
Guinean or Guineo-Congolese domains. Intermediate NO fluxes were obtained in rain forest and
gallery
forest
ecosystems,
in a broad-leafed
savanna
and in a seasonally
wetted
grassland
(sandy
soil) of the Zambezian domain, and in a dry fallow savanna of the Sahelian domain. Emission
rates
were
maximum
(>7 ng NO-N
rn
-2
s
4) in a seasonally
wetted
grassland
(site
2) and
in
particular
sites
subjected
to various
disturbances,
for example
soil
fauna
activity
(termite
mounds)
or past
human
disturbance
(Acacia
patches-settlement
site).
Microbial
activity
potentials
(i.e.,
carbon
mineralization,
nitrification,
denitfification,
and total net N mineralization)
were
determined
for most
of the soils
where
NO fluxes
were
measured.
In some
sites,
these
potential
activities
were useful
to identify
the major
processes
controlling
NO emission
rates.
Denitrificafion
potential
was very low and could
not explain
substantial
NO fluxes
from broad-
and fine-leafed
savannas
and Hyperthelia
savannas
of the Zambezian
domain.
Very low
potentials of both nitrification and denitrification could be related to the low NO fluxes for the
three Guinean
savanna
sites
studied.
NO fluxes
were significantly
higher
during
the wet season
than
the dry season
in both
savanna
and forest
ecosystems.
Emission
rates
in savanna
ecosystems
were significantly
increased
within a few hours
after
fire. The measurements
presented
here
provide
a unique,
consistent
database
which can be used
to fixabet
analyze
the processes
involved
in the spatial and temporal variations of NO emissions.
1. Introduction
It is recognized
that tropospheric
ozone
production
depends
on the presence of reactive nitrogen oxides (NOx, i.e., NO +
NO2) [Chameides and Walker, 1973; Crutzen, 1973; Fishman et
al., 1979, 1985; Logan et al., 1981; Cros et al., 1987; Liu et al.,
• Laboratoire d'A6rologie - OMP, UMR 5560, Toulouse, France. 2 Laboratoire d'Ecologie ENS, URA 258, Paris, France.
3 Now at Unit6 associ& Bioclimatologie-PIAF, Clermont-Ferrand.
France.
4 Division of Forest Science and Technology, CSIR, Pretoria, South
Africa.
5 Department
of Botany,
University
of the
Witwatersrand,
Johannesburg,
South Africa.
6 Laboratoire d'Ecologie Microbienne des Sols, UMR 5557,
Villeurbanne, France.
? Centre d'Ecologie des Systbmes Aquatiques Continentaux, UMR 5576,
Toulouse, France.
Copyright 1998 by the American Geophysical Union.
Paper number 98GB02737. 0886-6236/98/98GB-02737512.00
1987]. Nitrogen oxides also regulate the production of other
photochemical
oxidants
such
as OH radicals
and peroxyacetyl
nitrates. Furthermore, they have an indirect influence on the
quantity
and distribution
of reactive
gaseous
compounds
of
carbon,
halogens,
and sulfur
in the troposphere
[Crutzen,
1983]
and contribute
to acid deposition
as nitric acid [Galloway
and
Likens, 1981; Lacaux et al., 1992]. Among the sources of nitrogen oxides, the emission of nitrogen monoxide, NO, is a
particularly
important
one. NO may be emitted
either during
anthropogenic or natural biogenic processes [Delmas et al.,
soil NO emission
rates
is 21 Tg N year
'•. This is in the same
order of magnitude as emissions from fossil fuel combustion [Davidson and Kingerlee, 1997].
The factors influencing the quantity and distribution of NO in
the tropical
troposphere
have been identified
as particularly
important in global atmospheric chemistry [Crutzen, 1987; Mc Elroy and Wofsy, 1986]. Thus it is interesting to study the distribution and intensity of NO sources in the tropics. NO emissions and biomass burning in Africa are clearly linked [Andreae, 1991; Delmas et al., 1991; Fishman et al., 1991]. However, tropical atmospheric chemistry is highly dependent on other local processes, including soil NO emissions [Logan et al.,
638 SEROA ET AL.: VARIABILITY OF NO EMISSION FROM AFRICAN ECOSYSTEMS
1981; Kley et al., 1981; Noxon, 1981, 1983]. In addition, NO is short-lived and relatively scarce in the atmosphere of the
intertropical zone; this led to our decision to examine NO
emissions from tropical soils.
Tropical forests and savannas may be major sources of NO [Johansson et al., 1988; Johansson and Sanhueza, 1988; Kaplan
et al., 1988; Bakwin et al., 1990; Davidson et al., 1991; Rondon et al., 1993; Cardenas et al., 1994; Keller and Reiners, 1994;
Neff et al., 1995; Pothet al., 1995]. However, the vast majority of existing data have been collected in Central and South American ecosystems. In contrast, only few data exist on NO emissions from African ecosystems [Delmas and Servant, 1987; Serfa et al., 1994; Levine et al., 1996; Parsons et al., 1996; Meixner et al., 1997; Scholes et al., 1997]. African savannas and forests lie between 20 ø North and 30 ø South. They are of particular interest as they are increasingly subjected to fire [Hao et al., 1990] and land use change as a consequence of
demographic expansion.
The mechanisms controlling NO production from soils have been studied by numerous authors [Lipschultz et al., 1981; Anderson and Levine, 1987; Conrad, 1990]. Nitric oxide may be produced during the first stage of nitrification (ammonium oxidation) and during denitrification [Firestone and Davidson, 1989]. In either case, any HNO2 formed is unstable in acidic environments where organic matter or ferrous iron are present. Chemodenitrification may therefore take place. According to Van Cleeroput and Baert [1984] and Blackmer and Cerrato [1986], this process probably only represents a small fraction of the NO being produced in most environments. However, more recent studies [VeId'kamp and Keller, 1997] consider this phenomenon as non-negligible, even in globally non acidic soil. Nitrification and denitr/fication processes are influenced by soil characteristics such as water content, gas diffusivity, acidity, temperature, and inorganic nitrogen amount ISlemr and Seller,
1984; Rondon et al., 1993; Davidson and Schimel, 1995], as well as other edaphic, climatic, and vegetative factors [Galbally,
1985]. Owing to the great variability of these characteristics, spatial and temporal variability of nitrogen cycling processes (i.e., nitrification and denitrification) and concurrent NO emissions is high [Schimel et al., 1988; Matson et al., 1990; Ambus and Christensen, 1994; Davidson and Kingerlee, 1997; Thornton et aI., 1997]. Davidson and Kingerlee [1997] presented a global inventory of field measurements of nitric oxide fluxes reported in over 60 published papers. In these
articles, over 100 annual estimates of NO emissions were made
for various types of ecosystems. In spite of careful biome
stratification, the variation of NO fluxes within the biomes is
large. The uncertainty associated with the current best estimate
(21 Tg N year
'l) remains
high
(+_20-50%).
A more
sophisticated
ecosystem stratification, linked to the soil physicochemical and microbial properties, is needed to reduce this uncertainty.
However, measurements of NO fluxes associated with key soil
characteristics and microbial activities are not available for all
terrestrial biomes. Thus it has not yet been possible to assess the potential range of NO emissions for these ecosystems or to describe systematic relationships between fluxes and soil physicochemical parameters or microbial activities. This lack of knowledge is a major deterrent for (1) extrapolation from instantaneous measurements to seasonal estimates, (2) reliable extrapolation of emission measurements from the local scale
(i.e.,. point measurements) to the ecosystem, regional, and global scales, and (3) prediction of emission changes in relation to climatic or anthropogenic disturbances [Schimel et al., 1988;
Matson et al., 1989].
The results presented here were obtained between June 1991
and March 1993 for six supersites (see section 2.1.1.) located in
four different African countries. Measurements were carried out
in 12 forest and savanna ecosystems during the dry and/or wet seasons. A biogenically and an anthropogenically disturbed site
(see description section 2.1.3) were also studied for two ecosystems. All measurements were made using the same equipment and methodology based on the dynamic chamber
technique. This method is the most suitable for measuring NO fluxes within a given ecosystem or landscape and correlating these with studies of the processes controlling emissions
[Livingston and Hutchinson, 1995]. The objective of this work was to provide a database of nitrogen monoxide emissions from major African ecosystems. The methodology used was not
designed to study the small-scale variability of NO fluxes in relation to the variation in soil/microsite/nutrient cycling existing within a given ecosystem, even meters apart [Arebus
and Christensen, 1994]. Rather, this work addressed the
variability of NO fluxes between the different ecosystems
studied. Thus our database was used to perform a statistical
analysis between the different ecosystems and the temporal variability of NO emissions. The effects of ecosystem, season, and fire occurrence on NO emissions have been analyzed. For most of the ecosystems studied, complementary measurements of
potential microbial activities (providing indices for total heterotrophic microbial activity, nitrification, and denitrification) were performed for soils where fluxes were
measured. Mean soil biological activities characterizing the
different ecosystems were correlated with mean NO emissions
from the soil of these ecosystems in an attempt to understand the
variability of NO emission rates between ecosystems. The importance of taking into account the marked interecosystem and temporal variability of NO fluxes in the African tropical zone is discussed.
2. Experimental Methods
2.1. Design of NO Flux Sampling2.1.1. Phytogeographic domains and ecosystems studied. The classification of phytogeographic domains in Africa is based
on the contrast
existing
between
the dry and the wet tropics
[Menaut,
1983].
Tropical
Africa
is divided
into two regions:
(1)
the Guineo-Congolese
region, characterized
by a forest
landscape
and a rain forest climax, and (2) the Sudano-
Zambezian
region, dominated
by grassland
communities,
originating
from
a dry forest
climax.
Each
of these
two
regions
is
divided into a number of domains (Figure 1). Fluxes were
measured
in six supersites
chosen to represent
major
phytogeographic domains found in Africa: the Guineo-Congolese domain (Mayombe wet evergreen forest, Congo), the Guinean
domain
(Lamto
humid
s•vannas
and
gallery
forests
mosaic,
Ivory
Coast), the Sahelian domain (Banizoumbou dry savannas, Niger), the Guineo-Congolese/Zambezian regional transitional domain (humid savannas of the Teke plateaus, Congo), and the Zambezian domain (mesic savannas of the Nylsvley Reserve andSERRA ET AL.: VARIAB•,ITY OF NO EMISSION FROM AFRICAN ECOSYSTEMS 639
Figure 1. Map of the major phytogeographic region and
domains in Africa and location of the six supersites (adapted
from Menaut [ 1983]).
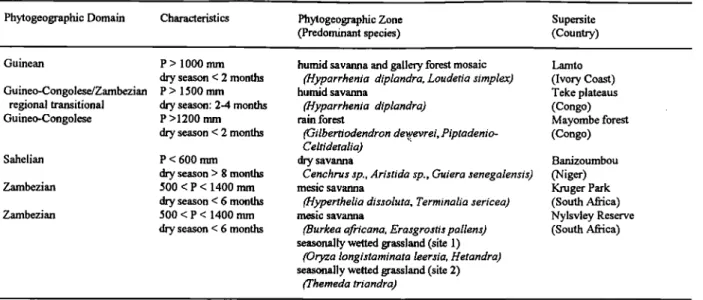
Kruger Park, South Africa) (Figure 1). The main characteristics of the six domains corresponding to the six supersites are
presented in Table 1. Each supersite encompassed an area
coveting
1-10 km
2. However,
they are representative
of
extensive areas of Africa. The major ecosystems encountered at this scale (from one in the rain forest supersite up to five in the forest-savanna mosaic encountered within the Lamto supersite in Ivory Coast) were sampled. The main characteristics of the six supersites are presented in Table 2.
The Congo measurements were taken in the Mayombe forest [Serga et al., 1994] and in the Teke plateaus savanna north of Brazzaville. This savanna is not used for aghculture or
stockËarming but is burned annually. The Niger measurements were taken in the Niamey region on the Hydrologic Atmospheric Pilot Experiment in the Sahel (HAPEX-SAHEL) supersite. The location, near 'the village of Banizoumbou, is fallow and is used for cattle grazing. The Ivory Coast measurements were made at the Lamto Tropical Reserve. This Reserve has not been subjected to agriculture practices for at least the last 40 years. The landscape is a forest-savanna mosaic. Five ecosystems were sampled: gallery forest, Loudetia, Hyparrhenia, and transition (mixed Loudetia and Hyparrhenia) savannas, along with a secondary forest derived from a savanna protected from fke for 35 years. The Kruger National Park is located in the savanna biome of the Mpumalanga Province of South Africa. Emission data were collected during the Southern African Fire- Atmosphere Research Initiative (SAFARI) experiment in October 1992. The Nylsvley Reserve is located in the South African savanna biome (Zambezian domain) [Werger and Coetzee, 1978]. The savanna vegetation is composed of a mosaic of broad-leafed and ffme-leafed savannas with Burkea africana and Acacia tortJills dominating the woody component in the former and latter ecosystems, respectively [Coetzee et al., 1976]. In addition, measurements were also taken on a seasonally wetted grassland. In this ecosystem, two distinct sites were selected based on their very different soil texture: a sandy soil site (85% sand, referred to later as site 1) and a clay soil site (85% clay + silt, referred to later as site 2). A total of 12 ecosystems were studied as detailed in Table 3.
2.1.2 Effects of season and fire frequency. The effect of
season was studied in two supersites. NO emissions were
measured during both the dry and wet seasons in the Mayombe forest, and in the Lamto Tropical Reserve. The location of the chambers frames was marked, and the measurements in the dry and in the wet season were made, as much as possible, on the exact same spot. The effect oœ fire was studied in the Kruger Park and in the Lamto supersites. In this latter supersite, controlled savanna fires occur each year in January and consume much of the grass layer. In the Kruger Park, measurements were taken in the long-term fire experiment plots laid out in the
Table 1. Main Characteristics
of the
Major
African
Phytogeographic
Domains
Studied
Phytogeographic Domain Characteristics Phytogeographic Zone
(Predominant species)
Supersite (Country)
Guinean P > 1000 mm
dry season < 2 months Guineo-Congolese/Zambezian P > 1500 mm
regional transitional dry season: 2-4 months
Guineo-Congolese P >1200 mm
dry season < 2 months
Sahelian P < 600 mm
dry season > 8 months
Zambezian 500 < P < 1400 mm
dry season < 6 months
Zambezian 500 < P < 1400 mm
dry season < 6 months
humid savanna and gallery forest mosaic (Hyparrhenia diplandra, Loudetia simplex)
humid savanna
(Hyparrhenia diplandra)
rain forest
(Gilbertiodendron de ,w:evrei, ?iptadenio-
Celtidetalia) dry savanna
Cenchrus sp., Aristida sp., Guiera senegalensis)
mesic savanna
(Hyperthelia dissoluta, Termmalia sericea)
mesic savanna
(Burkea aJ•icana, Erasgrostis pallens) seasonally wetted grassland (site 1)
(Oryza longistaminata leersia, ttetandra) seasonally wetted grassland (site 2)
(Themeda triandra) Lamto (Ivory Coast) Teke plateaus (Congo) Mayombe forest (Congo) Banizoumbou (Niger) Kruger Park (South Africa) Nylsvley Reserve (South Africa)
SER(•A ET AL.' VARIABILITY OF NO EMISSION FROM AFRICAN ECOSYSTEMS 641 Table 3. Mean Biogenic Emissions of Nitrogen Monoxide From the 12 Ecosystems Studied
Mean Flux
Ecosystems
Phytogeographic
Zone
Season ng
NO-N 95%
Confi- N
ReferenceForest Ecosystems
F 1 a, rain forest Guineo-Congolese dry 1.54 1.23
(Mayombe, Congo)
F 1 b, rain forest Guineo-Congolese wet 4.41 I. 87
(Mayombe, Congo)
F2a, gallery forest Guinean wet 1.47 0.67
(Lamto Reserve, Ivory coast)
F2b, gallery forest termite mound Guinean wet 7.17 1.21
(Larnto Reserve, Ivory coast)
F3, secondary forest derived from Guinean dry 4.95 1.97
protected savanna (Lamto Reserve, Ivory coast)
Savanna Ecosystems
S 1, Hyparrhenia savanna Guinean-Congolese/Zambezian wet 0.06 0.03
transitional region (Teke Plateaus Congo)
S2a, Hyparrhenia savanna before fu'e Guinean dry
(Lamto Reserve, Ivory coast)
S2b, Hyparrhenia savanna a•er fire Guinean dry
(Lamto Reserve, Ivory coast)
S2c, Hyparrhenia savanna Guinean wet 0.56 0.21
(Lamto Reserve, Ivory coast)
S2d, Hyparrhenia savanna termite Guinean wet
mounds (Lamto Reserve, Ivory coast)
S3, transition savanna Guinean wet
(Lamto Reserve, Ivory coast)
S4, Loudetia savanna Guinean wet
(Lamto Reserve, Ivory coast)
Zambezian dry
(Kruger Park, South Africa)
Zambezian dry
(Kruger Park, South Africa)
S6, Broad-leafed savanna Zambezian wet
S5a, Hyperthelia savanna before fu'e S5b, Hyperthelia savanna a•er fu'e
S7a, Fine-leafed savanna
S7b, Fine-leafed savanna Acacia
patches-settlement site S 8a, Seasonally wetted grassland
(sandy soil, site 1)
S8b, Seasonally wetted grassland (clay soil, site 2)
S9, Guiera savanna
(Kruger Park, South Africa)
Zambezian wet
(Nylsvley Reserve, South Africa)
Zambezian wet
(Nylsvley Reserve, South Africa)
Zambezian wet
(Nylsvley Reserve, South Africa)
Zambezian wet
(Nylsvley Reserve, South Africa)
Sahelian wet (Banizoumbou, Niger) 4 Serqa et al. [1994] 11 Serra et al. [1994] 9 Le Roux et al. [1995] 5 Le Roux et al. [1995] 14 this study 3 this study 0. I I 0.03 9 this study 0.65 0.35 9 this study 9 Le Roux et al. [1995] 1.32 0.38 5 Le Roux et al. [1995] 0.39 0.13 4 Le Roux et al. [1995] 0.28 0.08 5 Le Roux et al. [1995] 3.44 1.75 8 this study I 1.32 6.53 6 this study 4.01 1.30 I0 this study 3.92 1.07 9 this study 13.25 5.89 7 this study 2.60 0.50 8 this study 8.12 3.28 9 this study 6.09 2.64 7 Le Roux et al. [1995]
N refers to individual chamber measurements
vicinity of Pretoriuskop during the last days of the dry season. In
both cases, measurements were done before and within 2 hours
after the occurrence of fire. Chamber frames were not moved
between the prefire and the post fire measurements.
2.1.3. Effects of disturbances. In addition to the 12
ecosystems sampled, NO fluxes were measured in particular sites subjected to various disturbances within a given ecosystem: (1) old termite mounds in gallery forest and Hyparrhenia
savanna of the Guinean domain which are subjected to intense
soil fauna activity [Abbadie et al., 1992] and (2)Acacia patches, with relatively more nutrient-rich soils which are a consequence of a long-term anthropogenic disturbance. These patches are
linked to relics of accumulated dung, charcoal and firewood
resulting from the settlement of Middle Iron Age people over
700 years ago [Blackmore et al., 1990].
2.2. NO Flux Measurements
A dynamic chamber method using a Luminox LMA3 Scintrex Corp.¸ nitrogen oxide analyzer was used to measure NO fluxes.
This apparatus
detects
NO2 by chemiluminescence.
The NO2 in
the air sample reacts with a solution (Luminol¸) which emits, after deexcitement, a certain quantity of light that is proportional to the quantity of NO2 reacted. NO may be measured after conversion into NO2 by chromium trioxide (CrO3). This analyzer
is known to be disturbed by ozone, HNO3, and PANs, but none
of these gases are thought to be emitted by the soils on which
measurements were made. Comparison experiments with a
TECO-14A analyzer (chemiluminescence of NO with 03) carried out in the Amazon [Bakwin et al., 1990] produced flux values comparable to those calculated from the Luminox data. This
642
SERCA
ET AL.:
VARIABILITY
OF
NO EMISSION
FROM
AFRICAN
ECOSYSTEMS
analyzer is also known to be sensitive to temperature changesand to the batch of Luminol¸ used. Air humidity sensitivity was tested by Williams and Davidson [1993]. The Luminox is slightly affected by water vapor, with a sensitivity decrease of about 7% for a relative humidity of 50%. The insmnnent was calibrated before and after each campaign (typically a week) and for each new Luminol¸ batch. The multipoint calibration was checked every day at the experimental site using a field calibration instna•ent (Environment SAVE 3M©). This instrument provided zero air and calibrated NO2 concentrations from a NO2 permeation tube in the range 20-200 ppbv. The dilution was regulated by a mass flowmeter. NO calibration was performed with the same calibration instrument connected to portable standard cylinders of NO diluted with pure nitrogen that provided an outlet NO mixing ratio in the range 5-50 ppbv. The portable NO cylinder was checked against another NO cylinder in the laboratory after each field campaign. Calibrations were made at room temperature (25ø-27øC) to avoid zero drift. NO and NO2 calibrations were used to check the efficiency of NO to NO• conversion through the catalytic chromium converter. All together, changes in NO Luminox¸ readings were in the range of 10-12% between two consecutive calibrations made with the same Luminol¸ batch. These changes were accounted for during the data analyses through corrections of the concentrations supposing a linear drift of the instrument between two consecutive calibrations.
Stainless steel chambers (15 cm height) covering a surface
area of 800 cm 2 were used for flux measurements. Stainless steel
frames were inserted into the ground between 3 and 8 hours before the measurements were made in order to prevent immediate disturbances of air diffusion t¾om soil as well as long-term effects on fluxes [Matson et al., 1990]. A mass balance calculation was applied to the soil-chamber system, and the NO flux rate was computed from the slope of the initial linear increase in NO concentration in the chamber [Davidson et
al., 1991; Serra et al., 1994] with the following relationship:
F•o = (aC/•t) (•',•/A R T)
where
Fso is the
NO emission
flux
(ng
N m
'2 s'•),
(AC/At)
is the
initial rate of increase in NO concentration calculated by linear
regression
(ppb s'•), V is the chamber
volume
(cubic
centimeters), Ms is the nitrogen molecular weight (grams), A is the sampling area (square centimeters), R is the gas constant(cm
3 atm
mol
'l K'•), and
T is the
air temperature
in the
chamber
(Kelvins).
Pressure
was assumed
to be constant
throughout
the
flux measurement and equal to ambient pressure. In order to
estimate the magnitude of NO fluxes for each ecosystem, several
spatial
replicates
(i.e., individual
flux chamber
measurements)
were performed
per ecosystem.
Preliminary
results
obtained
for
savanna sites of Lamto (results do not appear here) showed no discernible diurnal trend, implying no dependence of NO fluxes
on temperature.
Several
studies
[Kaplan
et al., 1988;
dohansson
et al., 1988; Sanhueza et al., 1990; Davidson et al., 1991;
Rondon et al., 1993; Cardenas et al., 1994] showed that the
relationship between NO emissions and temperature is generally weak in tropical ecosystems. In contrast, other studies have
shown that there was a correlation between temperature and NO
fluxes in temperate ecosystems [Anderson and Levine, 1987;
Williams et al., 1988; Ma•'n et al., 1997]. There is no
commonly agreed explanation to justify this difference in
functioning between the two climatic zones. Given the system
sensitivity and the uncertainty in the slope estimation, the lowest
detectable
flux was
0.03 ng NON m
': s
'1
2.3. Measurement of Soil Characteristics
In each site (ecosystem or disturbed site within a given
ecosystem), five soil sample cores were collected just after the
flux measurements for one depth (0-10 cm). The cores were sampled within the frames of some of the chambers or less than 20 cm away. Soil pH was measured immediately in a 2:1 water- to-soil slurry. The soil samples were immediately airdried and stored. In the laboratory, total carbon was determined by
potassium dichromate oxidation and titration of dichromate
remaining with ammonium fer II sulfate [Anne, 1945]. Total
nitrogen was measured by the Kjeldahl method with Kjeltec Auto 1030 Analyzer (TECATOR) after digestion with sulfuric
acid. All the measurements were replicated 3 times from subsamples of each soil core.
2.4. Measurement of Potential Microbial Activities
In each site where NO emission rates were determined
(except for Congo forest and savanna), several microbial activities were measured in the laboratory on the five soil cores
sampled in each site (see section 2.3). The following activities
were measured: (1) potential CO2 accumulation as an index of total heterotrophic microbial activity, (2) nitrate accumulation in aerobic conditions as an index of potential net nitrification, and (3) N:O production in presence of acetylene and with nonlimiting nitrate added as an index of potential denitrification. Potential microbial activities of the soil samples were measured exactly as detailed by Le Roux et al. [1995]. The methodology is only briefly presented here. Carbon dioxide accumulation was measured using 20 g of dry soil rehumidified to 80% of water- holding capacity and incubated under aerobic conditions for 12 days. Nitrate and ammonium accumulation were measured spectrophotometrically after the incubation. Net accumulation values were computed by subtracting ammonium, nitrate, and nitrite contents in soils prior to the incubations. Total nitrogen accumulation is defined as the sum of the net nitrate (NO3') and
the net ammonium (NI-h +) accumulations. Denitrification
potential was measured using 10 g of rehumidified soil under anaerobic conditions and in the presence of acetylene (90:10 He- C:H: atmosphere) and with nonlimiting nitrate added (œmal
concentration
is 80 •g NO3'N g'• dry soil). Carbon
(electron
donor) was not added as in the original method described by Tiedj'e [1982] because it is interesting to consider endogeneous carbon as a stable parameter driving not only the denitrifying populations but also the expression of denitrifiers. The incubations were carried out for 4 hours, and N20 was analyzed by gas chromatography. This led to a detection limit for the
denitrification
potential
of 1 ng N:O-N g'• dry soil in 4 hours.
All the microbial activity measurements were made in three replicates from subsamples of each soil core.
Owing to the sampling design, we did not intend to correlate the individual NO fluxes and individual potential microbial activities using paired analyses. We only analyzed the relationship between the mean soil biological activities characterizing the different ecosystems and the mean NO
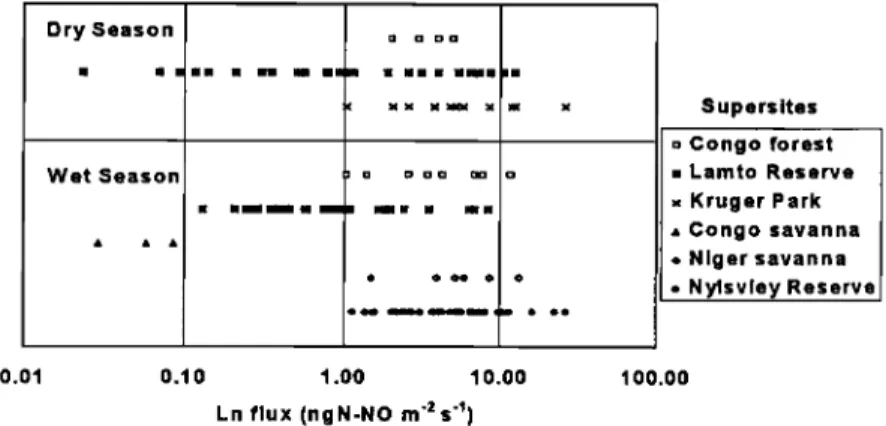
SERCA ET AL.: VARIABII,ITY OF NO EMISSION FROM AFRICAN ECOSYSTEMS 643 Dry Season Wet Season iii • x o Supersites o Congo forest ß Lamto Reserve x Kruger Park ß Congo savanna o Niger savanna o Nylsvley Reserve 0.01 0.10 1.00 10.00 100.00 Ln flux (ngN-NO m '2 s '•)
Figure 2. Range of individual NO fluxes (i.e., individual chamber measurements) observed within each supersite during (top) the dry and (bottom) the wet seasons. Note that X axis is in logarithmic scale.
emission rates from the soil of these ecosystems to better
understand the variability of NO emission rates between
ecosystems.
2.5. Statistical Analysis
Analysis of variance was performed in order to test the effects
of sites,
season
and fire on NO fluxes.
Statistics
applied
to the
fluxes showed that NO fluxes do not fit a normal distribution but
a lognormal distribution. Thus the flux variable was transformed
into the natural logarithm for the statistical tests. Scheff6's test
and Tukey's test were used to determine if means differed
significantly
from
one
another.
Site
effect
was
tested
both
during
the wet and the dry seasons. The effects of season or fireoccurrence were tested for sites where adequate data were
available.
3. Results
3.1. Variability of NO Emission Rates Between Ecosystems
Individual NO fluxes measured during either the dry or wet
seasons are presented in Figure 2. Whatever the season, the
variability of NO fluxes was very high within each supersite. For
a given supersite, the range of individual emission rates spanned
1 order of magnitude up to 2 orders of magnitude for the Lamto forest/savanna mosaic supersite. Data variability led to standard deviations greater than the mean for each supersite (results not
shown).
Mean NO fluxes from each site are r•resented in Table 3. The
spatial variability was weaker at the site scale than at the supersite scale (i.e., standard deviations are smaller than the mean). Site effect on NO fluxes was highly significant during both dry and wet seasons (both p = 0.0001). During the wet season (Figure 3), the lowest emission rates (<0.6 ng NO-N m '2
s
'l) were
observed
in the Hyparrhenia,
transition,
and
Loudetia
savannas of the Guinean or Guineo-Congolese domains. Intermediate NO fluxes were observed in the Congo rain forest
and Lamto gallery forest ecosystems, in the sandy soil seasonally wetted grassland and broad-leafed savannas (Zambezian
domain), and in dry fallow savanna of the Sahelian domain.
Emission
rates were highest
(>7 ng NO-N m
'2 s
'•) in the
seasonally wetted grassland (site 2) of the Nylsvley Reserve and
for particular
sites subjected
to soil fauna
activity
(termite
mounds) or past human disturbance (Acacia patches-settlement site). During the dry season (Figure 4), NO fluxes were low for the Hyparrhenia savanna of the Guinea domain, whereas the Hyperthelia savanna and secondary forest ecosystems e,,daibited
higher emission rates. Intermediate values were found for the
rain forest.
3.2. Season and Fire Effects on NO Emission Rates
NO fluxes
during
the both
wet and
dry
seasons
were
available
for two
ecosystems
(the
rain forest
and
the
Lamto
Hyparrhenia
savanna) (Figure 5). Effects of both site and season weresignificant at p = 0.0001, but the interaction effect was not
20 18 Wet season f •15 z
•, 12
ef
=m
10
def
de
c0
, ,
SitesFigure 3. Site effect on NO fluxes during the wet season
(p=0.0001). Bars are 95% confidence limits. Values with the
same letter are not significantly different at the p = 0.05 level. Abbreviations are as follows: S1, Hyparrhenia savanna; S4,
Loudetia
savanna;
S3, transition
savanna;
S2c, Hyparrhenia
savanna; S2d, Hyparrhenia savanna termite mounds; F2a,
gallery
forest;
S8a, seasonally
wetted
grassland
(sandy
soil, site
1); S7a, f'me-leafed savanna; S6, broad-leafed savanna; Flb, rain forest; S9, Cruiera savanna; F2b, gallery forest termite mound; S8b, seasonally wetted grassland (clay soil, site 2); and S7b, fine-leafed savanna Acacia patches-settlement site.
644 SERRA ET AL.' VARIABTI.ITY OF NO EMISSION FROM AFRICAN ECOSYSTEMS 6 x c 2 o z 1 Dry season a S2a b F1 a b SSa Site s (: F3
Figure 4. Site effect on NO fluxes during the dry season (p=0.0001). Bars are 95% confidence limits. Values with the same letter are not significantly different at the p = 0.05 level, abbreviated as S2a, Hyparrhenia savanna before fire; Fla, rain forest; S5a, Hyperthelia savanna before lure; and F3, secondary forest derived from protected savanna.
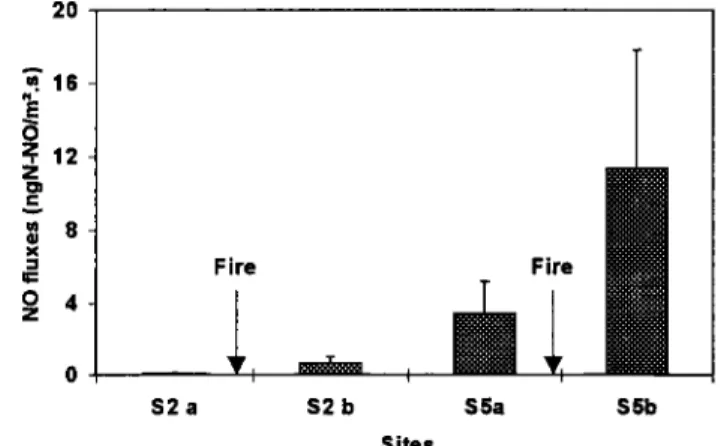
2O •.16 ;;12 z • 8 x Fire Fire o s2 a s2 b S5a S5b Sites
Figure 6. Effect of f'ure on NO fluxes for the Hyparrhenia savanna (S2) and Hyperthelia savanna (S5). Bars are 95% confidence limits. Effects of both site and lure are significant (p - 0.0001 and p - 0.0006, respectively). Interaction effect is not significant.
significant (p = 0.76). This implies that NO flux can be presented simply as the product of site and season effects. In other words, the effect of season is similar on the two plots considered. When compared to the results collected during the dry season, fluxes during the wet season were 3 times higher for
the Congo
forest
(from 1.54 to 4.41 ng NO-N m
'2 s
'l) and 5
times higher for the Lamto Hyparrhenia savanna (from 0.11 to
0.56
ng NO-N m
'2 s'l).
NO fluxes before and after lure occurrence (before the furst
rainfall) were available for two ecosystems (the Kruger
Hyperthelia savanna and the Lamto Hyparrhenia savanna)
(figure 6). Effects of site and lure were both significant (p = 0.0001 and p - 0.0006, respectively). The interaction effect was not significant (p = 0.30). Thus NO fluxes are the result of the product of site and lure effect. Fluxes after lure were 3 times higher for the Hyperthelia savanna ecosystem (from 3.03 to
11.32
ng NO-N m
'2 s
'l) and 6 times
higher
for the
Hyparrhenia
savanna
ecosystem
(from
0.11 to 0.65
ng
NO-N
m
'2
Wet Dry Wet
Dry
I
... •
.... = ... • ... ; • ; • S2 a S2 c F1 a F1 b SitesFigure
5. Effect
0f season
on
NO fluxes
for
the
Hyparrhenia
savanna (S2) and wet evergreen forest (F1). Bars are 95% confidence limits. Effects of site and season are significant (for
both p = 0.0001). Interaction effect is not significant.
3.3. Effects of Disturbed Sites on NO Emission Rates
In Lamto, we measured NO emissions on termites mounds
present in the Hyparrhenia savanna and in the gallery forest
(Table 3). In Nylsvley, we measured NO emissions in
undisturbed fine-leafed savanna and in an area disturbed by
human habitation (Acacia patches). The three disturbed sites
were found to exhibit higher fluxes than the surrounding soil. Effect of disturbance on termite mounds and in Acacia patches
was significant (both p=0.0001). When compared to the results
collected on undisturbed sites, fluxes measured on the disturbed
site were 2.4 higher
(1.32 rs. 0.56 ng NO-N m
'2 s
't) for the
Lamto Hyparrhenia termite mounds and 5 times higher (7.17 vs.
1.47 ng NO-N m
'2 s
't) in the Lamto
gallery
forest
termite
mounds. The Acacia-dominated soil exhibited a threefoldincrease in NO emissions when compared to the surrounding
soil
(13.25
rs. 3.92 ng NO-N m
'2 s
't, respectively).
3.4. Variations of NO Fluxes Between Ecosystems:
Relationships Between Mean NO Fluxes and Mean
Microbial Activities
Very marked differences among potential microbial activities
were observed
between
the different
sites studied
(Table 4).
Carbon mineralization potential was particularly low in the
Niger supersite. Maximum values of carbon minYralization were
obtained for the gallery forest ecosystem (Lamto) and for the
Acacia
patches
and
the seasonally
wetted
grassland
(s+ite
2).
Potential
net accumulation
of NH4
+ was
high
(46 [tg NH• -N g-i
dry soil in 12 days) only for the gallery forest ecosystem. All theother sites exhibited
negative+
to low ammonium
net
accumulation
(-11 to 4.8 [tg NH4
-N g-I dry soil in 12 days).
Nitrite accumulation (not shown) was below the detection limitin all sites
except
in the gallery
forest
mound
soil (0.51
NO3-N g-1
dry soil in 12 days).
Nitrate
accumulation
was
low
for the savanna ecosystems of the Lamto Reserve and for theNiger savanna. Disturbed sites like termites mounds and the
Acacia
patches,
along
with the seasonally
wetted
grassland
(site
SERRA
ET AL.' VARIABILITY
OF NO EMISSION
FROM
AFRICAN
ECOSYSTEMS
645
Table 4. Mean Potential Microbial Activities in Soils Where NO Fluxes Were Measured for Lamto Reserve, NylsvleyReserve, Kruger Park, and Niger Supersites
Site Carbon Mineralization Denitrification NO3' net NH4 + net
Potential Potential Potential Potential Accumulation Accumulation
Lamto Reserve Supersite
S2c, Hyparrhenia savanna 166 (5) UDL 5.2 (0.2) 3.6 (0.2)
S2d, Hyparrhenia savanna (termite 165 (2) 144 (4.4) 22.2 (0.3) -9.8 (0.1)
mounds)
S3, transition savanna 148 (1) UDL -0.7 (0.1) 4.8 (0.4)
S4, Loudetia savanna 164 (3) UDL -0.5 (0.1) 2.1 (0.6)
F2a, gallery forest 469 (16) 327 (4.8) 4.4 (0.5) 46 (0.6)
F2b, gallery forest (termite mounds) 361 (30) 248 (12.2) 58.5 (4.7) -11 (0.4)
Niger Supersite
S9, Guiera fallow savanna 61(4) 23 (4.2) 4.1 (0.4) -2.2 (0.3)
Nylsvley Reserve Supersite
S6, broad-leafed savanna 182 (1) UDL 13.4 (0.75) -4.1 (0.31)
S7a, fine-leafed savanna 178 (8) UDL 12.5 (0.76) -4.3 (0.02)
S7b, frae-leafed savanna 511 (6) 320 (17.6) 35.9 (0.62) -8.1 (0.29)
(Acacia patches-settlement site)
SSa, seasonally wetted grassland 299 (7) 207 (3.3) 14.1 (0.36) -7.4 (0.04)
(sandy soil, site 1)
SSb, seasonally wetted grassland 645 (15) 1122 (44.3) 25.6 (0.6) -6.6 (0.1)
(clay soil, site 2)
Kruger Park Supersite
S5a, Hyperthelia savanna 388 (9) UDL 22.7 (0.45) -3.5 (0.82) Potential carbon mineralization is expressed as pg of C g'• dry soil in 12 days. Denitrification potential is expressed as ng N g.l dry soil in 4 hours. Potential net accumulations of nitrate and ammonium are expressed as pg N g-t dry soil in 12 days. Values are presented with standard
errors in parentheses. UDL stands for under detection limit.
highest NO3' net accumulation. All the other sites in the Nylsvley Reserve exhibited intermediate nitrate net accumulation. Denitrification potential was under the detection
limit (< 1 ng N20-N g'• dry soil in 4 hours)
for the Lamto
savanna ecosystems, the broad- and frae-leafed savannas atNylsvley, and for the Hyperthelia savanna in the Kruger Park.
Denitrification potential was low in the Niger savanna (23 ng
N20-N g'• dry soil in 4 hours)
and particularly
high in the
seasonally wetted grassland (site 2).
Since NO emission rates strongly depend on nutrient cycling
processes, and more precisely on nitrification and/or
denitrification rates in soils, we analyzed the relationship between NO tquxes mtd poieniial microbial activities for ii•e
three supersites where data were available (Lamto and Nylsvley-
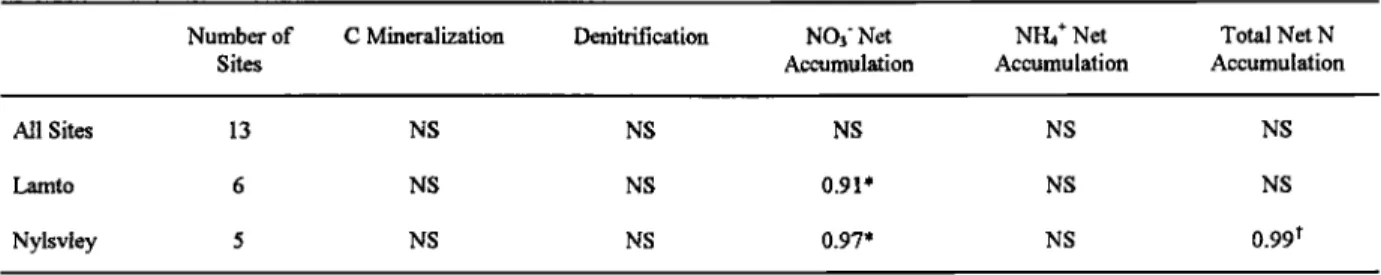
Reserves, and Niger savanna). Mean NO fluxes were not correlated to any potential activities when all the sites were
analyzed together (Table 5). When the analysis was restricted to
either the Lamto or the Nylsvley supersites, a very strong
correlation was observed between NO emission rates and
potential net nitrate accumulation. For the Nylsvley supersite,
NO fluxes were also strongly correlated with potential total N
accumulation
(total
N = NH•+-N
+ NO3'-N,
Table
5). However,
the relationship between NO fluxes and potential nitrate net
accumulation strongly differed between supersites (Figure 7).
For a given nitrate accumulation, NO emission rates were lower
at Lamto than at Nylsvley. Particularly high NO fluxes were measured in the Niger savanna despite very low potential nitrate accumulation.
4. Discussion
In addition to the large spatial variability commonly observed within a given ecosystem, the marked variability of NO fluxes exhibited between the different ecosystems studied (Figures 3 and 4) illustrates the difficulties in estimating regional NO
emissions from chamber measurements alone. However,
•i. imaœ•d ranges can b• used for coinparai. ive purposes. Tne very high variance of NO fluxes within a given supersite and for a given season (Figure 2) is primarily linked to the diversity of ecosystems encountered in the supersite and to the occurrence of localized disturbed sites in a given environment. Thus we did
not estimate regional NO emissions from our database. Regional emissions are best estimated using models that account for soil moisture, vegetation type, and nitrogen availability. Our chamber-based measurements of NO fluxes are useful to (1)
compare mean emission rates between the different sites studied and (2) correlate the variations of mean NO fluxes between
ecosystems with the variations of mean potential microbial
646 SERCA ET AL.: VARIAB•rrY OF NO EMISSION FROM AFRICAN ECOSYSTEMS
Table 5. Correlation Coefficients (r) Between Mean NO Flux and Mean Potential Microbial Activities for all the Sites of Lamto Reserve, Nylsvley Reserve, and Niger supersites and for Lamto or Nylsvley Supersites Only
Number of C Mineralization Denitrification NO3' Net NI-I4* Net Total Net N
Sites Accumulation Accumulation Accumulation
All Sites 13 NS NS NS NS NS Lamto 6 NS NS 0.91' NS NS Nylsvley 5 NS NS 0.97' NS 0.99 t NS is nonsignificant at p=0.05. * value p<0.01. t value p<0.001.
4.1. Ecosystem Effect on NO Fluxes
Within a given supersite, NO fluxes strongly depended on the particular ecosystem studied. In the Guinean domain during the wet season, fluxes ranged from 0.28 (Loudetia savanna) to 1.47
ng NO-N m
'2 s
'• (gallery
forest)
when
termite
mounds
are not
included. Similarly, NO emissions ranged from 2.6 (seasonally
wetted
grassland,
site 1) to 8.1 ng NO-N m
'2 s
'• (seasonally
wetted grassland, site 2) in the Nylsvley Reserve when theAcacia patches are not included. A comparison can be made with NO fluxes reported in the global inventory published by
Davidson and Kingerlee [1997]. Reported mean NO emissions
in the tropical
ecosystems
vary
from
0.27 ng NON m
'2 s
'• in an
upland pasture during the dry season [Davidson et al., 1991] up
to 22 ng NO-N m
'2 s
'• in a Namibian
savanna
[Harris
et al.,
1996]. High emissions were observed on burned soils (33 ngNO-N m
'2 s
'l, [Neff
et al., 1995]),
the highest
emission
ever
reported
(111 ng NO-N m
'2 s
'l, [Pothet al., 1995])
being
Nylsvley y- 0.42x- 2.1 20--
•
m
•'
Lamto y- 0_.•
•x + 0.2 I
x • Niger /' Reserve R= .- 0.92•.•....• : 0 $" 0 J • • 0 20 30 40 • • 7NO=' potentJal net accumulation (pg NIg d• soil in 12 days)
Figure 7. Relationship between the mean NO emission rates observed for different ecosystems during the wet season and the mean potential nitrate net accumulation observed for these ecosystems. Ecosystems from three supersites are presented: Lamto savanna-forest mosaic (squares) (including termite mounds), and Nylsvley Reserve supersite (including seasonally wetted grassland (circles) (site 2) and Acacia patches). For comparison, data are also reported for the Niger supersite (cross). Correlations are significant at p = 0.002 and p = 0.0001 for Lamto and Nylsvley, respectively. Postfire measurements were made within 2 hours of the fire.
observed on burned soil in a postrain fu'e experiment. With
fluxes
varying
between
0.06 and 13.25
ng NON m
'2 S
'I, the
fluxes reported here are in the lower range of already published As anticipated by Matson et al. [1989], our results indicate that assessment of NO emission at the supersite scale (i.e., a few square kilometers) requires a classification of factors including soil/parent material, vegetation, and topography. However, our database shows that these factors alone could not explain the various NO fluxes. In the Nylsvley Reserve, for example, NO fluxes from the two main ecosystems were not statistically different (Figure 3). The two ecosystems have similar soil characteristics, landscape features, and NO fluxes, but very different vegetation types (broad- vs. frae-leafed savannas).
Vegetation type is not a key parameter to control NO emission in this case. A contrario, the ecosystem effect on NO fluxes could
not be reduced to the distinction between forest and savanna
ecosystems, since NO fluxes from the forest sites were not
systematically higher than fluxes from the savanna sites (Figures
3 and 4).
Owing to the high spatial variability of NO emission rates
exhibited at all scales, the database does not allow for absolute
estimates of NO fluxes for a given phytogeographic domain.
However, these data showed that NO emissions are low for
savanna ecosystems of the Guineo-Congolese/Zambezian
regional transitional and Guinean domains. In contrast, higher NO fluxes could be expected for rain forest ecosystems and for
savanna ecosystems of the Zambezian and Sahelian domains.
Low emissions in the Guineo-Congolese and in the Guinean
domains could be related to the type of vegetation growing on site. Indeed, extremely low nitrification rates are reported in the soils of the savannas dominated by Hyparrhenia •vhich may be •due to inhibition of nitrifler growth and/or functionality by
specific
compounds
exuded
by the
roots
of the
graminea
[btunro,
1966].
However,
little is known
about
this aspect,
and further
investigation is thus warranted. Others factors such as
soil/parent material and topography and their interaction with
vegetation
and
NO emissions
need
to be investigated.
It should be noted that except for the Niger fallow savanna,
the ecosystems
studied
here
corresponded
to natural
ecosystems
undisturbed by present human activity. However, the surfacearea of the zones
affected
by anthropogenic
activities
(mainly
agriculture)
in the tropics
is increasing.
Thus,
in order
to provide
a more comprehensive view of NO emission from soils in theSERRA ET AL.: VARIABILITY OF NO EMISSION FROM AFRICAN ECOSYSTEMS 647
In addition, identification of disturbed sites within a given
ecosystem is necessary since these sites can exhibit very
different emission rates.
4.2. Effect of Disturbed Sites on NO Fluxes
The potential role of termites as a source of atmospheric trace gases was suggested by Zimmerman et al. [1982] and Rondon et al. [1993]. At the Lamto Reserve, fluxes were found to be significantly higher on termite mounds than on bulk control soil in forest and savanna ecosystems. Soils on mounds are always associated with nitrogen cycling characterized by low potential ammonium accumulation, relatively high potential nitrate accumulation, and high potential denitrification [Abbadie et al.,
1992; Le Roux et al. 1995]. Le Roux et al., [1995] concluded that
high NO fluxes on mounds are mostly due to denitrification.
In the Nylsvley Reserve, a similar local effect was found in the
Acacia patches. The Acacia dominated soil exhibited a threefold
increase in NO emissions when compared to the surrounding
soil
(13.25
vs. 3.92
ng NO-N
m
'2 s
'l, respectively).
Blackmore
et
al. [1990] showed that the settlers' (Middle Iron Age Tswanapeople)
activities
led to levels
of Ca
2+,
Mg
2+,
K +, and
PO4
•' in
the center of the Acacia patches up to 100 times those in the surrounding savanna soils. The high concentrations of these ions is associated with an increase in pH and a fivefold increase in organic carbon. This leads to an increase in the water-holding capacity of the soil, from 9% for surrounding soils to 30% for the soil under Acacia. The high NO fluxes are most likely linked with the particular status of the soil under the Acacia, that is,the high organic level and the high water-holding capacity that
induce favorable conditions for higher primary production and carbon and nitrogen ramover.
Both termite mounds and the Acacia patches are local, disturbed sites or "hot spots" that may be important sources of NO on a regional scale. Furthermore, they support the hypothesis that NO emissions are elevated after disturbances. For instance, termite mounds can cover a large fractional area of Lamto savannas (9% of Hyparrhenia savanna according to Abbadie et al. [1992]). Thus better understanding of the
processes controlling NO fluxes from disturbed and undisturbed
sites for a given ecosystem is warranted. Both termite mounds and the Acacia patches are the result of a long-term disturbance (biogenic and anthropogenic, respectively). The change associated with this disturbance is considered to be persistent since the sites have reached equilibrium. There is no short-term variation associated with the disturbances so there are no
specific short term trends of NO. This is somewhat different
from NO emissions enhancement following forest clearing [Keller et al., 1993] with NO emissions responding to changes in vegetation structure and composition.
4.3 Correlation Between Mean NO Fluxes and Mean Soil Microbial Activities Associated With the Different Ecosystems
As already mentioned, NO may be produced during nitrification (ammonium oxidation) and during denitrification. In order to improve understanding of NO flux variability between
ecosystems, we analyzed the relationship between NO emission rates and soil microbial activity. The best way to do this is to
correlate NO fluxes to actual soil microbial activities observed
in situ. However, for practical reasons, this approach could not be used to document the processes controlling NO emission in the sites studied here. As a surrogate, potential microbial activities (i.e., obtained on rehumidified soils in optimal conditions) were measured. This prevents any accurate
assessment of actual microbial process rates encountered in the
field.
However,
in many
cases,
some
potential
activities
can
help
to identify the major processes controlling NO emission rates. Considering the low nitrification and relatively high denitrification potentials exhibited in the Lamto gallery forest, along with the high soil moisture measured during the wet
season, Le Roux et al. [1995] concluded that denitrification was
probably the major source of NO in this ecosystem. In contrast,
we measured high nitrification and low denitrification in broad-
and t'me-leafed savannas of the Nylsvley Reserve and the Hyperthelia savanna (Kruger Park). Similarly, nutrient-poor savanna ecosystems of Niger are characterized by low denitrification potentials and relatively high nitrate accumulation
(Table 4). Thus substantial NO emissions in all these sites were
most likely related to nitrification. Very low potentials of both nitrification and denitrification may be partly responsible for the
low NO fluxes observed in situ for the three Guinean savannas
studied.
The microbial potential measurements did not provide any additional insight into the processes controlling emissions in the following cases: the termite mounds, the Acacia patches, and the
seasonally wetted grassland (sites 1 and 2), four sites that
exhibited both high nitrification and denitrification potentials. In
these cases, soil moisture, aerobic status, and soil carbon content
probably played a key role in determining the relative importance of nitrification and denitrification. Indeed, optimal soil moisture is generally about 40-60% water-filled pore space
(WFPS) for nitrification and is greater than 80% WFPS for denitrification [Davidson, 1993]. For these sites, better understanding of microbial processes controlling NO fluxes in the field requires concurrent measurements of NO fluxes, in situ
microbial activities, and soil WFPS. The lack of WFPS data for
most of the sites was a major shortcoming, but it was not possible to rectify. However, if desired by other authors, WFPS data could be estimated from water balance modeling exercises. In contrast to nitrification or denitrification potentials, the
carbon mineralization potential was not a useful parameter in
explaining NO flux variability (Table 5). High fluxes can be associated with relatively low carbon mineralization (Guiera savanna and broad and fine-leafed savanna). Furthermore,
carbon mineralization cannot be used to explain the enhancement of emission on termite mounds as they exhibit
carbon mineralization rates similar to or lower than values
observed for the surrounding soil (Table 4).
A very strong correlation was found between potential NO3'
net accumulation and NO fluxes for the Lamto and Nylsvley supersites (Figure 7). This correlation does not imply that NO emissions are only due to nitrification. For instance, fluxes on
termite mounds at Lamto have been shown to be related to
denitrification [Le Roux et al., 1995]. Fttrthermore, the relationships between flux and NO3' potential net accumulation were very different between Lamto and Nylsvley supersites. These relationships show that, although they are not always