Tracking stressed blood volume during vascular filling experiments
Texte intégral
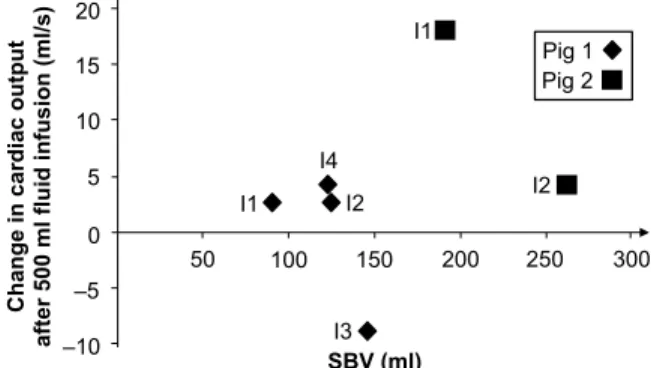
Figure
Documents relatifs
This protocol was first fine-tuned and tested in a pilot experiment with stu- dents at Sciences Po Paris by Balinski, Laslier and Van der Straeten in Jan- uary 2002 where we tested
Desolé Mathieu (2007) "Testing Cooperative Game Theory through a Contextualized Role-Playing Game about Irrigation Water. Management", Memoire de
All these points of agreement can be summed up in a proposition which the classical school would accept and I would not dispute; namely, that, if the level of income is assumed to
Les plaques d'identite fabri- quees avec cette substance sont egalement d'une resis- tance suffisante au contact des produits chimiques de toute nature ; elles ne sont pas non
After the success of Cosmic Microwave Background (CMB) anisotropy measurements in the past decade, a large fraction of the CMB experimental community now turns towards
La concentration en magnésium de cette phase transitoire amorphe est principalement déterminée par le rapport Mg/Ca de la solution de précipitation, et détermine celui de la
To solve the problem of organization and standardization of these datasets, a controlled vocabulary was used for annotating data, increasing the accuracy of
[r]
![Young [α/Fe]-enhanced stars discovered by CoRoT and APOGEE: What is their origin?](data:image/gif;base64,R0lGODlhAQABAIAAAP///wAAACH5BAEAAAAALAAAAAABAAEAAAICRAEAOw==)