BETWEEN BOVINE MILK PRODUCTION AND REPRODUCTION: THE CHALLENGE Ch. Hanzen1 and Nguyen Kien Cuong2
1 Professor, Faculty of Veterinary Medicine, University of Liège, Belgium
2 Nong Lam University HCMC, Vietnam
Abstract
Huge differences in dairy milk production can be observed around the world. They can be explained by differences in genetic, nutritional resources and management including the capacities of the farmers and veterinarian to prevent and treat the different pathologies inducing of the wellbeing of the animals. According to the world market of milk production, the challenge of each farm is not only to produce a milk of quality but also to reduce the costs of milk production by improving reproductive performances. Anywhere in the world we are responsible to encourage and develop a sustainable approach of milk production and agriculture development according to his three pillars: environment, economic and social.
Our presentation will present (1) the mains figures about the milk production in the world, (2) the definitions and prevalence of the different periods involved in the reproductive life of a cow, (3) the nutritional, genetic and pathological factors involved in the milk production on general and more specifically in reproduction (dystocia, placental retention, uterine infections, postpartum anoestrus), the relationships between these factors: the state of art of the definition, methods of diagnostic state of art of the main reproduction pathologies (dystocia) affecting the dairy cows during the waiting and reproduction periods. 1. What are the main figures about the milk production in the world?
In three key words: production, consumption, organization
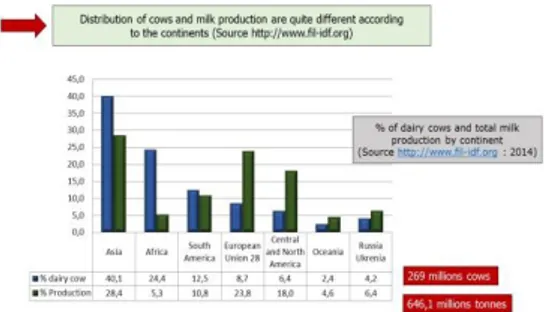
World milk production has increased during the last three decades by more than 50 percent. Milk production in the world was in 2013 estimated at 782 billion kgs, 13% buffaloes and 83 % being produced by cows, 13 % by buffaloes and 4 % by goats and. They are 269 million dairy cows around the world. Respectively 40,1; 24,4; 12,5;8,7, 6,4, 2,4 and 4,2 % are in Asia, Africa, South America, European Union, Central and North America, Oceania and Russia Ukraine. Huge differences between milk production by continent can be observed. So, Asia, Africa, South America, European Union, Central and North America, Oceania and Russia Ukraine respectively assume 28,4; 5,3; 10,8; 23,8; 18,0; 4,6 and 6,4% of the total dairy cow production (http://www.fil-idf.org). Such differences results from huge differences in the average milk production per cow by continent (2405 kgs on average in the world): 520 kg in Africa, 1704 kgs
in Asia, 6627 kgs in European Union and 6772 kgs in Central and North America
Fig 1. Distribution of cow and milk production according to the continents
More than 6 billion people worldwide consume milk and milk products; the majority of these people live in developing countries. Since the early 1960s, per capita milk consumption in developing countries has increased almost twofold. In 2012, 2,4 billion people consumed milk in the world. In 2025 this figure will be 4,2 billion. Per capita milk consumption (103 kg per capita on average in the world) is quite different according to the countries high (> 150 kg/capita/year) in Argentina, Australia, Costa Rica, Europe, Israel, North America; medium (30 to 150 kg/capita/year) in India, Japan, Kenya, Mexico, New Zealand, North and Southern Africa, and low (< 30 kg/capita/year) in Viet Nam, Senegal, most of Central Africa and most of East and Southeast Asia. In South Asia, the consumption of milk and milk products is expected to increase by 125 percent by 2030 (http://www.fil-idf.org ).
Milk production systems across world are varied in terms of structure, scale and level of intensification. 47% of the world production are under control of factories (25 factories control
25% of the total milk production). In developing countries, 80% of the milk production is delivered through the informal market (http://www.maison-du-lait.com/fr).
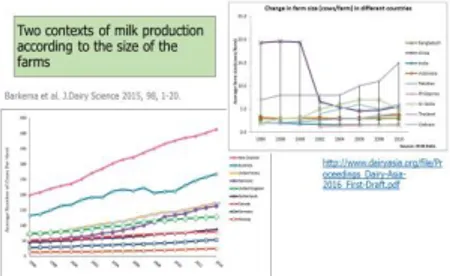
Fig 2. Milk production according to the size of herd
Recently, Barkema et al. (2015) has published an overview of the evolution of dairy industries in North America, Europe, Australia and New Zealand. In Europe, the end of milk quotas will probably accelerate the increase in the number of dairy cows per farm. In Belgium the number was 34.8 in 2001 and 58.5 in 2010. For comparison, these figures were the Netherlands 51.8 and 78.7 respectively, in France 34.6 and 49.5 and Germany 34.5 and 50.2. Such increase of the farm size is particularly observed in Australia and New Zealand. With the decrease of milk price, the farmers attempt to decrease nonessential (for them) inputs and expenses (like veterinary services and HHM). In different developed countries, the consumers became more aware about welfare. The gap between industry practices and citizen expectations is increasing. It’s necessary to increase studies about the effect of management (tail docking practiced in 48 % of USA dairy farms or tied vs free stalls for example: 38% of tie stall in USA, 72% in Canada, 79% in Switzerland but 8% in Netherlands) on animal welfare (building new tie stall housing was outlawed since 2004 in Norway and 2000 in Europe for “small” herds, zero grazing system is being increasingly questioned). Zero grazing system is also increasingly questioned. More attention is given to pain of animals (dehorning, castration, lameness, mastitis …). Many changes in technology can be observed. They concern automatic calf feeder for calves, automated milking system (25,000 around the world), automated estrus detection system, used of sexed semen, automated analysis of milk. Many data can be collected but are not routinely used when a
management decision needs to be taken. It appears also necessary to reduce the use of antibiotics according to the development of an antibiotic resistance, to reduce also the use of hormones as such as those used for timed artificial insemination and to develop biosecurity in the farms.
Anywhere in the world we are responsible to encourage and develop a sustainable approach of milk production and agriculture development according to his three pillars: environment, economic and social (Von Keyserling, 2013). 2. Which factors can influence the milk production?
In three key words: genetic, nutrition and diseases The factors influencing the milk production can be divided in three groups: genetic, nutrition and diseases.
Usually all traits regarding the milk production are highly heritable. The heritability of milk yield, % of milk fat, protein and lactose is between 0.3 and 0.55. The heritability of somatic cell count, fatty acid, feed intake, milk urea nitrogen, body condition score and live-weight. These figures are quite higher than the heritability (0.05) of calving interval or waiting period (interval between calving and first insemination) (Berry et al., 2016).
Fig 3. Differences of dairy cows due to nutrition
According to Harinder Makkar (Livestock Production Systems Branch, Animal production and Health division, FAO, Roma), feed is the driver of livestock production. Many factors depends on feed and their system of production : milk or meat production, reproductive efficiency, longevity, environment including biodiversity, water use (livestock use 15% of global agriculture water) and water pollution, food-feed competition dairy cows use 26% of cereal used in livestock sector, land use, food-fuel competition, animal
health and welfare and product quality (http://www.fao.org/docrep/018/i3331e/i3331e.pd f).
Directly or indirectly, milk production can be influenced by infectious, parasitic or metabolic (milk fever, acetonemia, subacute rumen acidosis) diseases but also by nutrition, mastitis, lameness and reproduction diseases like dystocia, placental retention, uterine infections, postpartum anoestrus, infertility and pregnancy losses. 3. What are the key reproduction periods? In three key words: period, fertility, fecundity The analysis and the solving of a reproduction problem needs to use an approach based on clinical reasoning (identify the problem and formulate good hypothesis linked to the problem). It seems also important to find a consensus on the evaluation parameters and definition of pathologies. We will propose some definitions. Fecundity refers on the time required to obtain
a pregnancy or a calving. Age at first calving should be 24 (objective) to 26 (threshold value) months and the interval between calving from 365 (objective) to 380 (threshold value) days. Similarly, intervals from birth or calving to pregnancy (days open) needs to be respectively 15 (objective) to 17 (threshold level) for a heifer and 85 (objective) and 100 days (threshold level) for a cow. If the average values of a cow or a herd of cows are superior to those objectives/threshold levels, we talk about infecundity.
Fertility is defined by the number of inseminations required to achieve a pregnancy. A cow is fertile if she is pregnant with less than three inseminations. It is called infertile if she is inseminated more than twice.
Waiting period is the time between birth or calving and the first insemination. The normal values respectively are 14 months and 60 days. Reproduction period is the time between the
first insemination and the last insemination (followed or not by a pregnancy). The normal values respectively are 21 days for a cow and 30 days for a herd.
Transition period is roughly defined as three weeks prior to calving until three weeks after calving. Major metabolic transitions occur in a cow’s body as she converts from a non-lactating to a non-lactating state and undergoes the
stress of parturition. Cows often fail to adapt to these metabolic and management changes, resulting in 75% of dairy cow disease incidence during the first month after calving.
4. What are the most important reproduction pathologies?
In some key words: dystocia, placental retention, uterine infections, postpartum anestrus.
A dystocia (In greek: Dys means difficult and
Tokos, birth) is a calving which requires a manual
intervention. Remember that the the foetus is expelled during the stage 2 of parturition who lengths 70 min on average. The prevalence of dystocia is between 2 and 7 %. (Mee, 2008). Placental retention is defined by the non-expulsion of the placenta during the first 24 hours post-partum. A herd problem can be suspected if the percentage of placental retention according to the number of calving observed during the period of evaluation is higher that 7 % (Beagley et al., 2010).
Four kinds of uterine infections have been described (Sheldon et al., 2006).
A cow with an acute puerperal metritis usually presents general (Pyrexia more than 39.5°C, dullness, inappetence, anorexia, reduced milk yield) and local (Fetid red-brown watery uterine discharge, enlarged uterus, persistence of the uterine thrill) signs during the first 21 days postpartum. The prevalence of this pathology is between 30 and 40 %.
Clinical endometritis is defined as an uterine infection detected after day 21 postpartum characterized by local symptoms (Uterine discharge: > 50% pus, 50% pus and 50% mucus or <50% pus i.e. flakes of pus) usually detected by vaginoscopy. The prevalence of this pathology is between 15 and 20%.
In case of subclinical endometritis (endometrial inflammation), there is no clinical signs (absence of purulent material in the vagina). The diagnosis is confirmed by the increase of the % neutrophils in the uterine lumen. The prevalence of this pathology is between 11 and 66 % according to the stage of postpartum and the method of detection (flushing or cytobrush). Pyometra refers to an accumulation of purulent or muco-purulent material in the uterus who become more and more distended. The cervix is open or not and the corpus luteum is present
(often) or not. The prevalence of this pathology is 5 %.
Fig 4. Types of uterine infections
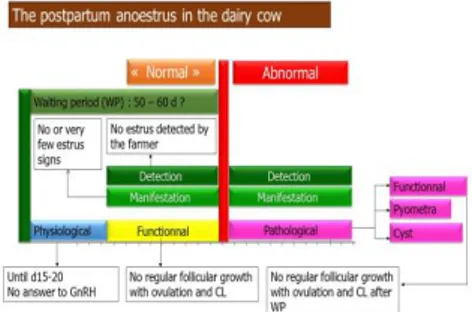
To define the postpartum anoestrus is relatively complex (Peter et al., 2009a and 2009b). The definition depends on the considered parameter: hormonal, behavioral or according to the follicular growth. Moreover, absence of cyclicity can quite normal depending the time of postpartum taken in consideration. So it’s possible to distinguished different kinds of postpartum anoestrus before and after the normal waiting period considered of 50 to 60 days.
Fig 5. Postpartum anoestrus in the dairy cow
After calving and during 15 to 20 days, the ovaries of the cow can’t be stimulated by an injection of the hypothalamic hormone called GnRH. It’s a period of physiological anoestrus. After this period and until the end of the normal waiting period, it’s still possible to have any kind of regular follicular growth, ovulation and development of a corpus luteum. In such situation we define this anoestrus as functional. If such ovarian situation extends until after day 50 to 60 we are speaking on functional pathological anoestrus. Pathological anoestrus can results also from a pyometra or a cyst (any ovarian fluid filled space more than 25 mm in diameter that can persist for more than 10 days in the absence of a CL).
The prevalence of the functional or cystic pathological anoestrus is respectively of 20 and 10%.
In some situations, before and after the end of the normal waiting period, the cow becomes cycled, present an estrus but this estrus has been seen by the farmer. We call this anoestrus detection anoestrus.
Finally, and mainly if the milk production is high (more than 40 L per day), the estrus signs can be low and not seen by the farmer: we defined this anoestrus as a « manifestation » estrus (silent estrus).
5. What are the relationships between these factors?
To solve a problem at the individual or at the herd level, the first step is to know if there is or not a problem by calculating the number of days open. The lengthening of this period depend on the length of waiting and/or reproduction period. The first can be increased for voluntary (decided by the farmer) or involuntary reasons. The clinical endometritis and pathological anoestrus are the two mains causes of waiting period increase. The first can be functional, cystic or pyometral. The clinical endometritis results from dystocia, puerperal endometritis and fetal membranes retention. Similarly, the length of the reproduction period is mainly influenced by infertility and the frequency of estrus detection (intervals between estrus).
Fig 6. Hypothesis to explain the increase of days open
This clinical reasoning needs to be done to backward. Analyzing this map, we can observe that the delay to obtain a new pregnancy can be directly or indirectly influenced by metabolic (ilk
fever, ketonemia, acidosis) factors, infectious factors (uterine infections), nutritional (NEB: negative energy balance and milk production level), social (estrus detection), environmental (barn) factors.
6. Which conclusions to take home?
Milk production needs to be develop through a sustainable approach.
Reproduction performances depends on many different interrelated factors linked.
To coach the farmer and his herd on a regular basis remains one of the best way to improve reproduction performances
Reference
Barkema et al. 2015. J Dairy Sci 98: 1-20. Beagley J.C. et al. 2010. J Vet Intern Med 24: 261-268.
Berry et al. 2016. Annu Rev Anim Biosci 4: 269-290.
Mee J.F. 2008. The Vet J 176: 93-101.
Peter A.T. et al. 2009a. Theriogenology 71: 1333-1342.
Peter A.T. et al. 2009b. Theriogenology 71, 1343-1357.
Sheldon I.M. et al. 2006. Theriogenology 65: 1516-1530.
Von Keyserling et al. 2013. J Dairy Sci 96: 5405-5425.
http://www.fil-idf.org
http://www.maison-du-lait.com/fr