HAL Id: dumas-00960820
https://dumas.ccsd.cnrs.fr/dumas-00960820
Submitted on 18 Mar 2014
HAL is a multi-disciplinary open access
archive for the deposit and dissemination of sci-entific research documents, whether they are pub-lished or not. The documents may come from teaching and research institutions in France or abroad, or from public or private research centers.
L’archive ouverte pluridisciplinaire HAL, est destinée au dépôt et à la diffusion de documents scientifiques de niveau recherche, publiés ou non, émanant des établissements d’enseignement et de recherche français ou étrangers, des laboratoires publics ou privés.
discriminating active pharmaceutical ingredient origins:
example of simvastatin
Dominique Hirth
To cite this version:
Dominique Hirth. A new combined LC (ESI+) MS/MS QTOF impurity fingerprinting and chemo-metrics approach for discriminating active pharmaceutical ingredient origins: example of simvastatin. Analytical chemistry. 2011. �dumas-00960820�
Centre d’enseignement de Montpellier
MEMOIRE
Présenté en vue d’obtenir
Le DIPLOME d’INGENIEUR CNAM
SPECIALITE : MESURE-ANALYSE
OPTION : SCIENCES ET TECHNIQUES ANALYTIQUES
APPLIQUEES A LA CHIMIE ET AU VIVANT
Par
M. Dominique HIRTH
A new combined LC (ESI+) MS/MS QTOF impurity fingerprinting and
chemometrics approach for discriminating active pharmaceutical
ingredient origins: example of simvastatin.
Soutenu le 8 juillet 2011
JURY
PRESIDENT : Pr. Christine PERNELLE
MEMBRES : Pr. Torbjörn ARVIDSSON
Pr. Pierre-Antoine BONNET
Pr. Christophe MOULIN
Dr. Nathalie MARCOTTE
1 I would like to express my sincere gratitude to Professor Torbjörn Arvidsson for having welcomed me within the Swedish Medical Products Agency Laboratory. He always considered me as a full member of his staff, he placed a total trust in me, while demanding, so that it was really pleasant and enlightening to work on his sides. His supervision and guidance was of great teaching for me. Thanks to him for having given me the opportunity to attend the “Analysdagarna 2010” lectures at the University of Uppsala.
My deepest gratefulness goes also to Professor Monika Johansson for her invaluable advices and relevant views indispensable to the progress and success of this project.
I extend my genuine thanks to Dick Fransson for having taught me so much knowledge about the LC-MS technology. His expertise, availability, kindness and patience were deeply appreciable.
I thank, in particular, Marianne Ek, Anette Silvàn, Ahmad Amini, Stefan Jönsson and Ian Mac Even for the numerous discussions and skills that they shared with me about their respective activities, such as the European Pharmacopoeia for Marianne, the quality assurance for Anette, the capillary electrophoresis and MALDI-TOF technologies for Ahmad, the nuclear magnetic resonance for Ian and the high performance liquid chromatography for Stefan.
I would like to address my grateful thanks to all my Swedish colleagues for the warm and exceptional welcoming that they showed me during all my stay within their laboratory. Their sympathy, kindness and benevolence were constant, so that I will never forget this experience. Many of them have become friends.
I thank Professor Curt Petersson and, in his name, all the staff of the Analytical Pharmaceutical Chemistry Department of the Uppsala University Pharmacy Faculty for their support and help with the comprehension and manipulation of the multivariate data analysis software. Curt contributed to facilitate my registration at the University of Uppsala and gave me the opportunity to validate a Degree Project (30 credits) in Analytical Pharmaceutical Chemistry.
I would like to thank my company, the French Health Products and Safety Agency, and specially, Professor Alain Nicolas, Professor Pierre-Antoine Bonnet and Denis Chauvey for having supported me in this initiative and approach to increase my professional experience. I thank more particularly Professor Alain Nicolas for his investment in time in rereading and correction of this dissertation.
I would like to thank the CNAM teachers in helping me to broaden my skills and knowledge all along my training cursus. This dissertation is the result and culmination of their instruction and work. I thank more particularly Professor Christine Pernelle and Professor Claudine David for their devotion and professionalism. Thanks to Michel Evers for his valuable help in the correction of this work. They were all of great support for me.
Finally, I express my gratefulness to my parents, my family and all of my closest friends who showed me indefectible support and presence during this venture.
2
GLOSSARY OF SYMBOLS AND ABBREVIATIONS
AFSSAPS: French Health Products Safety Agency. API: Active Pharmaceutical Ingredient.
APCI: Atmospheric Pressure Chemical Ionization. APPI: Atmospheric Pressure Photo Ionization. BRIC: Brazil, Russia, India, China.
C: Coulomb.
CEP: Certificates of Suitability to the Monographs of the European Pharmacopoeia. CID: Collision Induced Dissociation.
CAD: Collision Activated Decomposition. CRS: Chemical Reference Substance.
DC: Direct Current.
EDQM: European Directorate for the Quality of Medicines and Healthcare. EEC: European Economic Community.
EIC: Extracted Ion Chromatogram. ESI: Electrospray Ionization. FWHM: Full Width at Half Maximum. HCA: Hierarchical Clustering Analysis.
HETP: Height Equivalent to a Theoretical Plate. hMG-CoA: 3-hydroxy-3-methylglutaryl coenzyme A HPLC: High Performance Liquid Chromatography.
IUPAC: International Union of Pure and Applied Chemistry.
kHz: kilo Herz.
LC-MS: Liquid Chromatography coupled to Mass Spectrometry.
LC-MS/MS: Liquid Chromatography coupled to Mass Spectrometry in tandem. LOD: Limit of Detection.
LOQ: Limit of Quantification. M+H+: Pseudo molecular ion.
mM: Millimolar.
mDa: milli Dalton.
MVDA: MultiVariate Data Analysis.
MS: Mass Spectrometer.
m/z: Mass to charge ratio.
3 OMCLs: Official Medicine Control Laboratories.
PC: Principal Component.
PCA: Principal Component Analysis.
pg: Picogram.
Ph. Eur.: European Pharmacopoeia. ppm: Part Per Million.
QTOF: Hybrid Quadrupole - Time-of-Flight analyzer.
RF: Radio Frequency.
RPLC: Reversed Phase Liquid Chromatography. RRLC: Rapid Resolution Liquid Chromatography.
Rs: Resolution.
RSD%: Relative Standard Deviation expressed in percent. SIM: Selected Ion Monitoring.
SMPA: Swedish Medical Products Agency. S/N: Signal to Noise ratio.
SVT: Simvastatin.
TIC: Total Ionic Chromatogram. tR: Retention time.
TOF: Time-of-Flight.
tM: Hold-up time.
TWC: Total Wavelength Chromatogram.
UHPLC: Ultra High Performance Liquid Chromatography. UV-DAD: Ultra Violet Diode Array Detection.
4
FIGURE INDEX
II-1 Graphical representation of Gaussian peaks in a typical chromatogram...……….... 16
II-2 LC-MS - the marriage between the bird and the fish...…….……….... 18
II-3 Principle of LC-MS system..………..……...………..…….... 19
II-4 Combination of two analyzers in space tandem mass spectrometry...………... 20
II-5 Ionization range by ESI, APCI, and APPI as a function of analyte polarity and molecular weight…………...……...22
II-6 Diagram of an electrospray ionization source functioning in positive mode ……….... 23
II-7 Photograph of the electrospray process………...…….………..…….... 24
II-8 Diagram of an atmospheric pressure chemical ionization source…...………... 24
II-9 Ionization mechanism in an APCI source...……... 25
II-10 Diagram of an atmospheric photo-ionization source ………..…….………..…….... 26
II-11 Examples of Mathieu stability diagrams for three different masses (upper diagram) and corresponding mass peak widths when applying different linear scan lines (diagram below)………..…...…...………..…….... 28
II-12 Schematic diagram of ion trajectories in a quadrupole mass analyzer...………... 29
II-13 Schematic of a hybrid quadrupole-time-of-flight mass analyzer...……... 30
II-14 Schematic of a reflectron-ToF………...……... 32
II-15 Resolving power………...………... 32
II-16 Variance explained by the first principal component…………...……... 37
II-17 Variance explained by the second principal component …………...……... 37
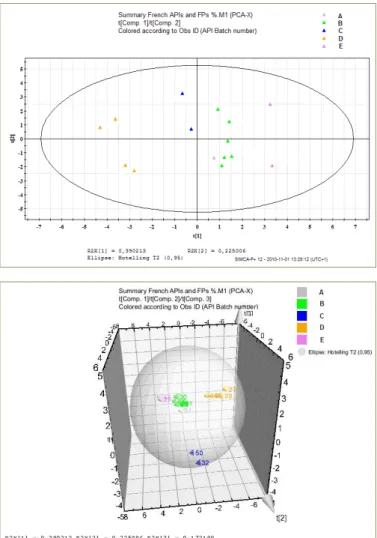
II-18 Score plots of principal component 1 and principal component 2 (top graph) and related scatter plots of principal component 1, 2, 3 (graph below) describing the relationships between raw materials and finished products originated from five different API providers (A, B, C, D and E) present on the French market……….. 38
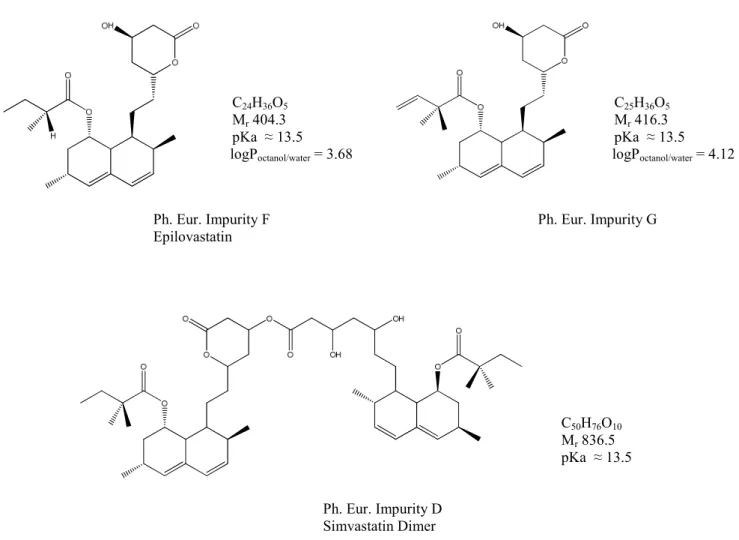
5 III-1 Molecular representation, empirical formula, molecular weight, pKa and log Poctanol/water
partition coefficient of simvastatin...……... 42 III-2 Chlolesterol endogenous synthesis pathway…………...42 III-3 Molecular representation, empirical formula, molecular weight, estimated pKa and log
Poctanol/water partition coefficient of simvastatin specified impurities... 43-44
III-4 Typical UV-chromatogram of a mixture of simvastatin and its specified impurities... 45 III-5 Performance of Kinetex™ Core-Shell particles compared to fully porous sub-2µm and
3µm particles...……... 48 III-6 Total ionic chromatogram of 2 µL simvastatin peak for identification CRS solution
injected in chromatographic system using various mobile phase buffer concentrations, formic acid 0.1% (top left), formic acid 0.05% (bottom left), formic acid 0.025% (top
right) and formic acid 0.001% (bottom right)... 51 III-7 Mass spectrometer signal to noise ratio for various mobile phase buffer concentrations in
formic acid (0.1%, 0.05%, 0.025% and 0.001%) of a 2µL simvastatin for peak
identification CRS solution injection ……….………...………... 52 III-8 Plots of the decimal logarithm of capacity factor k’ (log k’) versus mobile phase
composition (%B) for simvastatin and major impurities... 53 III-9 Plots of the decimal logarithm of capacity factor k’ (log k’) versus mobile phase
composition (%B) for impurities E and F………... 54 III-10 Plots of the decimal logarithm of capacity factor k’ (log k’) versus mobile phase
composition (%B) for impurities F and G, and simvastatin... 54 III-11 Plots of the decimal logarithm of capacity factor k’ (log k’) versus mobile phase
composition (%B) for impurities A and unknown at m/z = 391.2479…... 55 III-12 Plots of the decimal logarithm of capacity factor k’ (log k’) versus mobile phase
composition (%B) for impurities B and C………... 56 III-13 Bar charts ot the retention times against pH values at 2.7 and 6.7 of the mobile phase,
for simvastatin, European Pharmacopoeia impurities A, E, F, G and unknown at m/z = 391.2479... 57 III-14 Plots of the decimal retention times against column temperature for simvastatin, impurities
A, E, F, G, B, C and unknown at m/z = 391.2479………... 58 III-15 Total ionic chromatograms of a sample prepared
a) in pure acetonitrile.
b) in an acetonitrile/water 40:60 (v/v) mixture.
6
FIGURE INDEX (continued)
III-16 Detector response when using an electrospray ion source in positive mode (upper diagram). Detector response when using an electrospray ion source in negative mode
(lower diagram) corresponding to the injection of the identical solution... 63
III-17 Plots of simvastatin main impurities peaks area (counts.s) against nebulising gas pressure (psi)... 65
III-18 Plots of the areas (counts.s) against drying gas temperature (°C) for impurities A, E, F, G, B and C and unknown at m/z = 391.2479 and m/z = 421.2949………...…. 66
III-19 Plots of the areas (counts.s) against drying flow rate (L.min-1) for impurities A, E, F, G, B and C and unknown at m/z = 391.2479 and m/z = 421.2949………. 67
III-20 Plots of the areas (counts.s) against capillary voltage (V) for impurities A, E, F, G, B and C and unknown at m/z = 391.2479 and m/z = 421.2949……….…….……. 68
III-21 Plots of the areas (counts.s) against fragmentor voltage (V) for impurities A, E, F, G, B and C and unknown at m/z = 391.2479 and m/z = 421.2949………..…….…. 69
III-22 Linearity of the LC-MS signal of simvastatin specified impurities A, E, F, G, B and C and unknown at m/z = 391.2479 and m/z = 421.2949……….…….…. 70
III-23 Linearity of simvastatin LC-MS signal....…….………..………....………71
III-24 Extracted ion chromatogram, displaying abundance and peak to peak signal to noise ratio of a low 8.25 ng.mL-1 simvastatin concentration solution....…….…………....……… 72
III-25 Agilent 6520 AA QTOF ……….……….……….………. 76
III-26 UV-DAD chromatogram of the “simvastatin for peak identification” CRS solution (upper graphic) and gradient profile (lower graphic).……….………….….…. 82
III-27 Blank solution chromatogram ……….……….…….…. 83
III-28 Placebo solution chromatogram ……….……….…….…. 84
III-29 Example of a finished product solution mass chromatogram.……….……….…….…. 85
III-30 a) Extracted ion chromatogram of impurity C - b) Extracted ion chromatogram of impurity B’- c) Extracted ion chromatogram of impurity B - d) Overlaid extracted ion chromatograms of impurities C, B’ and B.……….………..…….…. 86
III-31 Simvastatin in-tandem mass spectrum at 5 eV collision energy.……….………….…. 88
III-32 Impurity A’ in-tandem mass spectrum at 10 eV collision energy...……….……...…. 90
7 III-34 Initial PCA calibration model score scatter plot component 1 versus component 2 (left)
and PCA calibration model score scatter plot component 1 versus component 3 (right) built up with 15 variables……...……….…….…. 96 III-35 Cross validation of the 15-variable model.……….….……….…….…. 97 III-36 Contribution intra group E in projection plane component 1 versus component 2..…….…. 97 III-37 Contribution inter groups D and E in projection plane component 1 versus component 3.... 98 III-38 Score scatter plots and corresponding loading scatter plots of the final API origin
discriminating training model component 1 versus component 2 (upper), component 1 versus component 3 (middle) and component 2 versus component 3 (lower)………..…. 100 III-39 Loadings and uncertainty of the loadings’ calculation of the first component (left), the
second component (center) and the third component (right)...……….….…. 101 III-40 Calibration model cross validation... 102 III-41 PCA predicted validation set in projection plane P1P2 (left) and corresponding HCA
three-dimensional predicted validation set (right)……….………..…. 103 III-42 Predictive three component HCA (upper left) and PCA models (projection planes P1P2
8
TABLE INDEX
II-1 Performance comparison of different mass spectrometers…………...….……….... 33
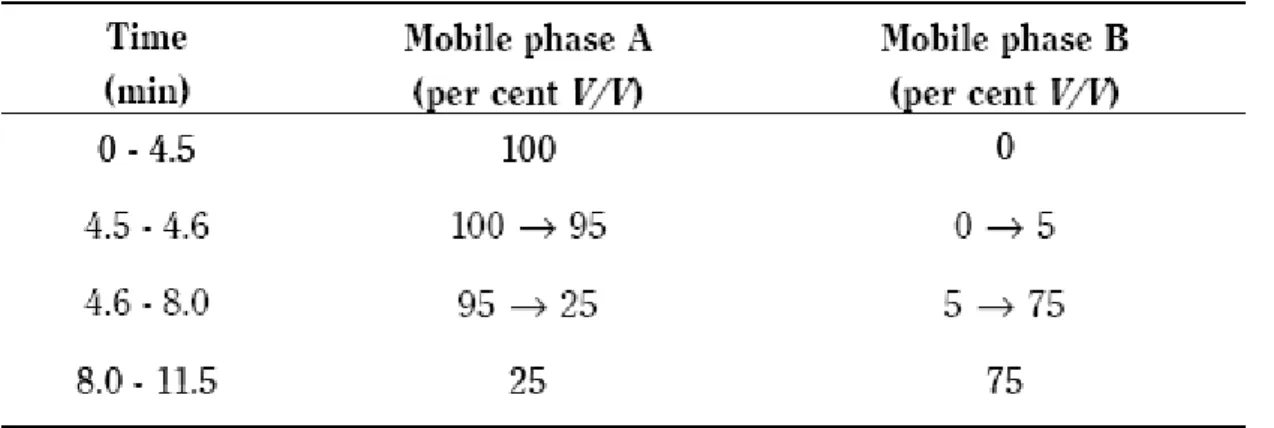
III-1 Gradient conditions reported in the European Pharmacopoeia monograph on simvastatin (7th edition)………. 45
III-2 Final gradient conditions of the developed in-lab method……….………... 56
III-3 Mass spectrometer starting settings before optimization………... 64
III-4 Mass spectrometric detector linearity for main simvastatin impurities..………... 70
III-5 Intra-day (n=6) and inter-day (n=18) instrument precision considering peak areas…....…. 73
III-6 Intra-day (n=6) and inter-day (n=18) instrument precision considering internal area normalization……….………...……...….. 74
III-7 Unknown impurity information...…. 87
III-8 Simvastatin major fragment ions...…. 89
III-9 Proposed molecular representations and IUPAC names for impurity A’...…. 91
III-10 Proposed molecular representation and IUPAC name for impurity B’...…. 92
III-11 Proposed molecular representations and IUPAC names for unknown impurities located at 435.2741 m/z, 433.2585 m/z, 403.2479 m/z and 421.2949 m/z………...…. 93
9
TABLE OF CONTENTS
AKNOWLEDGEMENTS………...….……… 1
GLOSSARY OF SYMBOLS AND ABBREVIATIONS………..…….…………..………... 2
FIGURE INDEX…….……….……… 4
TABLE INDEX………...………..……….………….. 8
I. INTRODUCTION 13 II. MEASUREMENT PRINCIPLE and DATA ANALYSIS: 15 High performance liquid chromatography coupled to mass spectrometry in tandem using a hybrid quadrupole - time-of-flight analyzer in conjunction with multivariate data analysis. II.1. Reminder………...……….… 15
II.2. High Performance Liquid Chromatography……...……….……..………… 15
II.3. Liquid chromatography hyphenated to mass spectrometry………..…. 18
II.3.1 LC-MS analysis………. ………...……….……… 18
II.3.2 Tandem mass spectrometry………...……….……… 20
II.3.3 Atmospheric pressure ionization sources………..……….……… 21
II.3.3.1 Electrospray ionization source……….…………..… 22
II.3.3.2 Atmospheric pressure chemical ionization source……… 24
II.3.3.3 Atmospheric pressure photo-ionization source ……..….…...……..… 26
II.3.3.4 Atmospheric pressure high vacuum interface ………….…...……..… 27
II.3.4 Mass analyzers……….………..……….……...……… 27
II.3.4.1 Single quadrupole mass analyzer……….…………..…28
II.3.4.2 Hybrid quadrupole – time-of-flight mass analyzer……… 29
II.3.4.3 High resolution and mass accuracy measurements………..….… 31
II.3.4.4 QTOF operating modes………...………….…...……..… 34
II.4. Multivariate data analysis……….……….…… 35
II.4.1 Principal component analysis……….………...……….……… 36
10
III. APPLICATION TO SIMVASTATIN AND RELATED SUBSTANCES IN ORDER TO DISCRIMINATE BETWEEN DIFFERENT PROVIDER ORIGINS, ROUTES
OF SYNTHESIS OR MANUFACTURING AREAS 41
III.1 Enhanced impurity profiling of simvastatin by LC (ESI+) MS/MS QTOF………..…… 43
III.1.1 Chromatographic system optimization for an efficient separation of simvastatin and related substances...…46
III.1.1.1 Choice of the analytical column……..………...…46
III.1.1.2 Flow rate adjustment………..………...… 49
III.1.1.3 Impact of the mobile phase buffer ionic strength…………...… 50
III.1.1.4 Effect of the mobile phase organic modifier concentration…...… 53
III.1.1.5 Effect of the mobile phase pH………...… 57
III.1.1.6 Influence of the column temperature …….………...… 58
III.1.1.7 Autosampler carryover and contaminations………...… 60
III.1.1.8 Sample solvent investigation………..………...… 60
III.1.2 Optimization of the mass spectrometer parameters...… 62
III.1.2.1 Choice of the ionization source and functioning mode...…. 62
III.1.2.2 Effect of the nebulizer gas pressure...………...…. 64
III.1.2.3 Influence of the drying gas temperature ………...… 66
III.1.2.4 Drying gas flow rate adjustment……..………...…………...… 67
III.1.2.5 Role of the capillary voltage ...………...… 68
III.1.2.6 Impact of the fragmentor voltage…....………...… 70
III.1.2.7 Response linearity of the mass spectrometric detector…...… 72
III.1.2.8 Measurement precision of the mass spectrometer response…...… 75
III.1.3 Experimental Disposal………...… 75
III.1.3.1 Chemicals and Reagents…………....………...…. 75
III.1.3.2 Material and apparatus……….. ………...… 75
III.1.3.3 Preparation of sample solutions………...…………...… 77
III.1.3.3.1 Solution of simvastatin for peak identification CRS... 77
11
III.1.3.3.3 Finished product solutions………... 78
III.1.3.3.4 Blank and Placebo solutions……….…... 78
III.1.3.4 Analytical conditions………...…………...… 79
III.1.3.4.1 HPLC experimental conditions………... 79
III.1.3.4.2 Mass spectrometer experimental conditions ……….. 80
III.1.3.5 Measurement protocol ………...…………...… 80
III.1.4 Results……….………...… 81
III.1.4.1 UV-DAD Chromatogram………...… 82
III.1.4.2 Identification of new impurities by LC-MS/MS…...… 83
III.1.4.2.1 Example of a blank injection chromatogram…..…... 83
III.1.4.2.2 Example of a placebo injection chromatogram ……..…….. 84
III.1.4.2.3 Example of a finished product impurity profile……….. 84
III.1.4.3 Structure elucidation of new impurities by LC-MS/MS…...… 87
III.1.4.3.1 MS/MS spectrum of simvastatin…………..…..…... 88
III.1.4.3.2 MS/MS spectrum of impurity A’………..……….. 89
III.1.4.3.3 MS/MS spectrum of impurity B’………..……….. 91
III.1.4.3.4 Structure elucidation for impurities located at 435.2741 m/z 433.2585 m/z, 403.2479 m/z and 421.2949 m/z……..…….. 93
III.2. Chemometric discrimination between different simvastatin API origins..…...………... 94
III.2.1 Development of the calibration model………….………...… 95
III.2.2 Results……….………...……….……… 99
III.2.2.1 Calibration model score scatter plots and associated loading scatter plots...… 99
III.2.2.2 Uncertainty of the PCA calibration model loading calculation…...…101
III.2.2.3 Validation……….………...… 102
III.2.2.3.1 Cross validation………...102
III.2.2.3.2 Internal validation set..………...… 103
12
IV. DISCUSSION 105
V. CONCLUSION and PERSPECTIVES 107
APPENDIX A Structure and physic-chemical data on simvastatin and impurities…...….…… 109 APPENDIX B Intra-day and inter-day instrument precision considering individual components’
absolute peak areas ……….……….…….…….………….…… 111 APPENDIX C Intra-day and inter-day instrument precision considering internal peak area
Normalization.….……….…….………..….…… 112 APPENDIX D Liquid chromatographic parameters……….………...….……113 APPENDIX E Mass spectrometer parameters....……….………….………..……….…… 114 APPENDIX F (Fragment pathway and in-tandem mass spectra at 5eV collision energy of
molecular ion located at 435.2725 m/z corresponding to (1S,3R,7S,8S,8aR)-8- [2-[(2R,4R)-4-hydroxy-6-oxo-tetra-hydro-2H-pyran-2-yl]ethyl]-3,7-dimethyl-1,2,3,7,8,8a-hexahydronaphtalen-1-yl-3-hydroxy-2,2-dimethyl-butanoate). (Fragment pathway and in-tandem mass spectra at 5eV collision energy of molecular ion located at 433.2565 m/z corresponding to (1S,3R,7S,8S,8aR)-8-[2-[(2R,4R)-4-hydroxy-6-oxo-tetra-hydro-2H-pyran-2-yl]ethyl]-3,7-dimethyl- 1,2,3,7,8,8a-hexahydronaphtalen-1-yl-3-hydroxy-2,2-dimethyl-but-3-enoate.... 115 APPENDIX G (Fragment pathway and in-tandem mass spectra at 5eV collision energy of
molecular ion located at 403.2951 m/z corresponding to (1S,3R,7S,8S,8aR)-8- [2-[(2R,4R)-4-hydroxy-6-oxo-tetra-hydro-2H-pyran-2-yl]ethyl]-3,7-dimethyl-1,2,3,7,8,8a-hexahydronaphtalen-1-yl-2-methyl-but-3-enoate).
(Fragment pathway and in-tandem mass spectra at 10eV collision energy of molecular ion located at 421.2949 m/z corresponding to (1S,3R,7S,8S,8aR)-8-[2-[(2R,4R)-4-hydroxy-6-oxo-tetra-hydro-2H-pyran-2-yl]ethyl]-3,7-dimethyl- 1,2,3,7,8,8a-octahydronaphtalen-1-yl-2,2-dimethyl-butanoate……….….……. 116 APPENDIX H Reporting, identification and qualification thresholds of related substances in
active substances according to the European Pharmacopoeia 7th edition general
monograph “Substances for pharmaceutical use (2034)”………….…….…….. 117 REFERENCES ……….……….……….… 118 ABSTRACT……….……….……..……….…….….. 123 KEY WORDS………...……….……..……….………….. 123
13 Regulatory agencies like the Swedish Medical Products Agency (SMPA) or the French Health Products Safety Agency (AFSSAPS) are competent national authorities responsible for the protection of public health by controlling and guaranteeing the safety, efficacy and quality of medicines [1] and [2]. Both are active and dynamic recognized members of the European network of the Official Medicines Control Laboratories (OMCLs), which is coordinated by the European Directorate for the Quality of Medicines and Healthcare (EDQM) [3]. Among many various missions entrusted to OMCLs, one of their most essential roles encompasses the supervision of medicinal products for human use available on their respective national market and within the European area.
However, over the past few years, those institutions have to face to profound and significant changes in the market organization of active pharmaceutical ingredients (API) and finished products. Indeed, since the enlargement of the European Economic Community (EEC) to twenty seven members in 2007, and furthermore, in a context of an increasingly globalized world economy, all the tendencies in the pharmaceutical industry converge on greater and more systematic internationalization. This results in the outsourcing of pharmaceutical manufacturing to new emerging markets and low-wages countries, such as the BRICs for instance, Brazil, Russia, India and China [4]. Such low-cost alternatives are likely to involve novel concerns over the quality and efficiency of raw materials and finished products, due, sometimes, to an absence of regulation or lesser controls in these lands. Thus, verifying and ensuring the good quality of safe and effective medicines imported into Europe is subject of ever increasing attention, as well as combating illegal and counterfeit medicinal and medical products [5].
Consequently, inspecting manufacturing areas and collaborating with national, European and International organizations have become necessary options for the new strategies within the regulatory bodies. And in the same way, the development in their laboratories of more specific and sensitive analytical methods, by using innovative and powerful techniques, has become a top priority for controlling the pharmaceutical drug compounds. At this prospect, the main challenge of the present work aims to evaluate the possibility of perfecting and developing a generic classification method able to collect chemical fingerprint information for pharmaceutical starting materials, and corresponding finished products, that allows discriminating between different API providers, routes of synthesis, or manufacturing areas, as well as detecting any quality change or purity contamination, or pinpointing counterfeit medicines.
14 The first objective of this work was to experiment and investigate all the advanced performances, in terms of ultra trace-level sensitivity, increased specificity, high resolution and mass measurement accuracy of high performance liquid chromatography coupled to mass spectrometry in tandem, using a hybrid quadrupole – time-of-flight analyzer (LC-MS/MS QTOF), in order to establish the identification and the impurity profiling of drug substances [6]. In addition to the attractive QTOF instrumentation, modern liquid chromatography technologies, like recent generations of columns packed with superficially porous particles and demonstrating high separation efficiencies, were used in this study [7].
The second objective consisted in exploring multivariate data analysis (MVDA), like principal component analysis (PCA) or hierarchical clustering analysis (HCA), as statistical tools to interpret the datasets and classify the APIs and finished products according to their origins.
Simvastatin, a lipid lowering agent used in the treatment against cholesterol [8-9], was chosen as test molecule for this survey because numerous formulations, containing simvastatin and coming from many manufacturers, are available on the Swedish and French markets, and most of those manufacturers call for several API furnishers. Moreover, prescriptions are required to benefit from treatment based on this medicine, increasing the offer over less regarding internet sites and, by the way, the risk of finding fake pharmaceutical drugs for this molecule.
The first part of this document introduces the basic principles encountered in chromatographic separations using high performance liquid chromatography (HPLC) technology, as well as the coupling of HPLC with mass spectrometry (MS). Several source interfaces, like electrospray ionization (ESI) and atmospheric pressure chemical ionization (APCI), are reviewed and the characteristic features of the hybrid quadrupole time-of-flight analyzer are reported. In a second phase, material, apparatus and experimental implementation of the measurement used during the study will be described. The perfecting and the development of the analytical method will be discussed and, especially, the optimization of the chromatographic separation, the setting adjustments of the mass spectrometer parameters and the building of the PCA model will be theorized. Finally, the results obtained from the discrimination between 49 samples by combining LC/MS QTOF impurity fingerprinting with principal component analysis and hierarchical clustering analysis will then be presented in order to confirm the capacity of the developed training model to define the API origins in both starting materials and finished products.
15 High performance liquid chromatography coupled to mass spectrometry in tandem using a hybrid quadrupole time-of-flight analyzer in conjunction with multivariate data analysis.
II.1. Reminder
High performance liquid chromatography hyphenated to mass spectrometry (LC-MS) is an extremely versatile and powerful instrumental technique which has become, during the recent years, an essential investigation tool in trace and ultra trace-level compound analysis. A lot of quantitative and qualitative methods based on LC-MS and LC-MS/MS find their applications in many fields as varied as pharmaceutical industry, proteomics and metabolomics, food-processing industry, environmental protection, forensics and toxicology, etc [10-14]. Numerous stakes, such as detection and quantification of infinitely low quantities of components in very complex matrices, or identification and structural elucidation of molecules, and also molecular composition or functional groups determination, result from the outstanding performances of this technology. The instrumentation comprising a high performance liquid chromatography system in combination, via a suitable interface, with a mass spectrometer, will be presented in the next two chapters, as well as the governing principles and theoretical aspects of both techniques.
II.2. High performance liquid chromatography
High performance liquid chromatography has gained in popularity over the decades in most of analytical laboratories, owing to its suitability for separating and analysing almost all types of complex multi-component mixtures, allowing identification and quantitative determination of targeted molecules. Indeed, advent of compact and automated equipments, composed of high performance modules, like accurate flow delivery systems, on-line degassers, efficient injectors and multiple types of sensitive and selective detectors have led to precise and reproducible analytical results. In the same time, emergence of a wide range of highly effective columns, with many various polarity properties, conducting to enhanced separation, and development of more and more powerful computers have also made their contribution to the growing success of HPLC.
16 The basic principle of the chromatographic separation lies in the characteristic distribution ratio of
each species of the sample mixture between two non miscible phases: the stationary phase, packed in the column, and the liquid mobile phase, which is forced through the column at high pressure by the mean of the pump system. The mobile phase tends, in its motion, to carry away the components to separate, while the stationary phase tends to retain and slow down the components during their migration through the system [15]. Therefore, the separation results from the differences between the specific migration rates of each analyte within the column matrix. More precisely, the separation depends on the solubility differences of the solutes in the mobile phase, and on the relative molecular interactions of those same solutes with the chemical coating of the particles, i.e. it is the more or less great affinity, in terms of polarity, of each injected compound with one of the phases that will determine the time at which the compound will elute from the column. The time for migration of a retained substance is called retention time (
t
R), while the time for migration of anunretained substance is called hold-up time (
t
M) [16]. The resulting chromatogram, or plotteddetector response versus time, corresponds ideally to a series of Gaussian peaks, as illustrated in figure II-1.
Figure II-1: Graphical representation of Gaussian peaks in a typical chromatogram [16]
In pharmaceutical analysis, reversed phase liquid chromatography (RPLC), is widely used. RPLC is characterized by polar mobile phases, typically mixtures of aqueous solutions with methanol or acetonitrile, and non-polar stationary phases, typically spherical silica particles bonded to hydrophobic alkyl chains, made up of 18 carbons (C18) or 8 carbons (C8), for instance. The
17 peaks, according to the following equation:
Rs = 1.18 x (
t
R2 –t
R1) / (ω
h1 +ω
h2) (1)Where
t
R2 >t
R1, i.e.the second analyte elutes from the column after the first analyte, and whereω
h1and
ω
h2 correspond, in the chromatogram, to the respective peak widths at half height. However, theresolution can be expressed as in equation (2), known as Purnell relation: Rs =
¼
xk
2 / (1 +k
2) x (α
– 1) /α
x √N (2)
Where
k
is defined as the retention factor:k
= (t
R –t
M) /t
M (3)
α
is defined as the selectivity:α
=
k
2 /k
1 (4)N corresponds to the plate number of the column and conveys the efficiency of the column:
N = 5.54 (
t
R /ω
h)2 (5)The Purnell relation emphasizes the importance of parameters like the retention factor, the selectivity and the column efficiency for chromatographic separation optimization. The retention factor and the selectivity are principally governed by the chemical nature of the stationary phase, the mobile phase composition, the eluent pH or the column temperature. The column efficiency, as for it, is related to the column length, the particle size of the column packing materials and the mobile phase flow rate. Moreover, the selection of a gradient elution instead of an isocratic elution may also be an important criterion when optimizing the chromatographic system. A gradient elution consists in changing the mobile phase composition during the chromatographic run in order to speed up the analysis of late eluting compounds or modify peak shapes and impact the separation mechanisms.
A common idea consists in thinking that liquid chromatography may be simplified when it is combined to a very selective detector such as a mass spectrometer. However, the great capabilities of the MS instrument to separate ions in mass, even if they are not separated in time, should not conceal the extreme importance and the contribution of an efficient chromatography to the quality of the mass spectrometer response. Indeed, a previous chromatographic separation minimizes the
18 signal mass spectral complexity by reducing the number of the sample matrix co-eluting substances. Thus, it contributes to eliminate or restrain phenomena as ion suppression or signal enhancement. In another hand, liquid chromatography is, unlike mass spectrometry, able to separate isobaric, which means with the same mass, isomeric structures like enantiomers [17].
In the next chapter, the attention is focused on the operating principles and the properties of the online combination of both techniques high performance liquid chromatography and mass spectrometry.
II.3. Liquid chromatography hyphenated to the mass spectrometry II.3.1 LC-MS analysis
The principle of mass spectrometry in LC-MS systems consists in measuring the mass-to-charge ratio of charged particles issued from compounds previously separated by high performance liquid chromatography. Now, mass spectrometry and liquid chromatography are ostensibly not compatible since mass spectrometry needs ultra high vacuum when HPLC operates at high pressure. This, a priori incompatibility of combining both techniques is ideally depicted in figure II-2. This picture called “LC-MS - the marriage between the bird and the fish” was first proposed by Professor P. Arpino and then re-worked by E. Potyrala [18].
19 in generating gas phase ions from analytes dissolved in liquid solutions by using atmospheric pressure ionization sources [19]. The ionic charge is produced either by protonation, i.e. proton addition, or by deprotonation, i.e. a loss of a proton, either by cationic or anionic adduct formation or else, by ejection or capture of an electron. The produced ions are then transmitted via the interface to the mass analyzer where they are separated and measured, according to their mass-to-charge ratio (m/z). The ions passing through the mass analyzer are counted and transformed into an electric signal when they strike the detector. The generated signal is amplified, recorded and converted, after reprocessing, into total ionic currents (TIC), intensities, mass spectra, relative abundances, or else extracted ion chromatograms by the computer.
A schematic diagram describing the general feature of LC-MS instrumentation is presented in figure II-3.
Figure II-3: Principle of LC-MS system
Liquid Sample Introduction Ionisation Process Interface Analyzer m/z Detector Computer Atmospheric Pressure Ionisation Sources : ESI, APCI, APPI.
Capillary, Skimmers, Octopoles.
Quadrupole, Time of Flight, Ion Trap, Magnetic and Electromagnetic Analyzers, etc.
Electron Multipliers: Microchannel Plates, Channeltron, Dynodes, etc. Acquisition and
20 II.3.2 Tandem mass spectrometry
Tandem Mass analysis, also called MS/MS analysis, is mentioned when ions produced in the ion source, are scanned across a preset m/z range and isolated as parent ions, or ions of interest, in a first mass analyzer, such as a quadrupole, before being fragmented in a collision cell. The fragmentation ions, or product ions, generated by collision are then separated and measured, as last step, in a second mass analyzer [20]. The combination of two distinct instruments in order to perform MS/MS experiments, as illustrated in figure II-4, is referred as in-space tandem mass spectrometry.
In contrast to in-space tandem mass spectrometers, in-time mass spectrometers, like ion traps, performed the selection of the precursor ion, the fragmentation process and the ion fragment measurements in an identical and unique analyzer. This functioning mode allows applying several fragmentation steps to the original ion species in order to realize MSn experiments, where n
corresponds to the number of MS stages performed [21]. MS/MS techniques are particularly recommended in quantitative analysis, when increased sensitivity is requested, for determining molecule empirical formulae or when looking for structural information of the original ion.
Figure II-4: Combination of two analyzers in space tandem mass spectrometry First Analyzer Parent ion(s) Collision Induced Dissociation Second Analyzer Product ions Quadrupole.
Scan or Selection of a specific ion.
Quadrupole or hexapole in RF-only mode containing inert gas.
Fragmentation.
Time of Flight, Quadrupole, etc.
21 Collision induced dissociation (CID), sometimes named Collision activated decomposition (CAD), represents the core of the tandem mass spectrometry process. The selected ion is collided with neutral molecules like inert gas molecules, Nitrogen, Argon, Xenon or Helium. The collision cell used during the experiment can be a simple quadrupole or hexapole analyzer functioning in RF-only mode, which means that all the ions are just focused along the x-axis, guided and transmitted towards the second mass analyzer, without mass discrimination.
During the collision, the kinetic energy acquired by the accelerated ions, due to the electric field corresponding to the specified collision energy, is converted into potential energy in the molecule-ions. If this internal energy exceeds the fragmentation threshold, precursor ions will undergo bond cleavages into smaller fragments and, sometimes, molecular rearrangements, leading to the most stable ion forms [22]. The types of fragment ions depend, obviously, on the nature and the structure of the precursor ion, but also on the collision energy applied. Low energies, close to the fragmentation threshold, rather induce neutral losses, like water molecules, methanol, carbon monoxide, and carbon dioxide, for example. Higher energies lead to carbon-carbon bond breakages and more uncontrolled fragmentation processes. The resulting fragmentation pattern can be used for structural information or quantitative analysis [23].
II.3.3 Atmospheric pressure ionization sources
The main inconvenience when coupling high performance liquid chromatography system to mass analyzer lies in eliminating the liquid solvent and converting the solute into gas phase ions in order to carry out mass spectrometry. The last fifteen years have seen considerable breakthrough in developing atmospheric pressure ionization sources. Emergence of reliable, robust and efficient electrospray ionization (ESI) and atmospheric pressure chemical ionization (APCI) sources, and more recently atmospheric pressure photo ionization sources (APPI), has contributed to democratize the use of LC-MS applications in modern laboratories. Figure II-5 shows the theoretical applicability domains of each ionization source in function of the polarity and the molecular weight of the analytes [24].
22
Figure II-5: Ionization range by ESI, APCI, and APPI as a function of analyte polarity and molecular weight [24]
As illustrated by the diagram, ESI and APCI sources are, in most applications, the sources of choice because of their ability to ionize a large range of compounds. ESI sources are particularly suited for the ionization of very large molecules, as well as smaller molecules. Furthermore, ESI sources, as APCI sources, offer the possibility of ionizing a wide range of compounds from very polar to less polar, when APPI shows the advantage in ionizing low-polar and non polar substances.
II.3.3.1 Electrospray ionization source
J.B. Fenn is considered as being the inventor of ESI. He published, in 1989, an identification method of biological macromolecules based on the ionization properties of this type of source [25]. In 2002, he was rewarded with the attribution of the Nobel Prize in Chemistry for the results of his scientific researches and works. Nowadays, the electrospray ionization technique can be found in many applications in extremely varied domains and stands for the most widely used sources when analyzing polar components, like drugs, and large molecules, like peptides and proteins.
23 ionization, used in positive mode in this case, is presented in figure II-6, while a photograph of the ESI process is shown in figure II-7.
Figure II-6: Diagram of an electrospray ionization source functioning in positive mode [26] ESI is a liquid phase ionization process which demands low flow rates, below 1mL.min-1. The
solution of the analytes is sprayed from the tip of a metalized silica capillary to which a high potential of about +4 to +6 kV, in positive mode, or -4 to -6 kV, in negative mode, is applied. Under the combined effects of the electric field and a co-axial nebulizing gas, the electrically charged liquid emerged from the capillary by forming a Taylor cone before changing shape into a fine jet, which finally disintegrates into a plume of tiny and highly charged droplets (see figure II-7).
Those fine droplets shrink then progressively by evaporation of the solvent due to another gas current, called the drying gas. The density of charge increasing dramatically on the surface of the micro-droplets, electric repulsion reaches a critical state, called the Rayleigh limit, leading to Coulomb explosion and apparition of gas phase ions. The generated ions are then accelerated towards the analyzer trough the interface. Some ESI sources, called Dual spray source, are equipped with a second sprayer through which a continuous low-level introduction of a reference mass solution is operated, minimizing interferences with the analyte molecules.
24 Figure II-7: Photograph of the electrospray process [27]
This type of source is particularly adapted to polar molecules. ESI is a soft ionization method for chemical analysis since it does not induce a severe fragmentation of the ionized species. It produces single charged ions and sometimes dimers, like (2M+H)+ or (2M-H)-, and also multiple charged ions, extending considerably the mass range of the instrument. In positive mode, it generates protonated molecules (M+H)+, and cationic molecules, like sodium adducts (M+Na)+, ammonium
adducts (M+NH4)+ or potassium adducts (M+K)+. In negative mode, ESI conducts to the formation
of deprotonated molecules (M-H)- and other anionic species.
II.3.3.2 Atmospheric pressure chemical ionization source
Unlike ESI process, atmospheric pressure chemical ionization is a gas phase ionization process. It was developed in the seventies by Professor E.C. Horning and collaborators in order to hyphenate liquid chromatography to mass spectrometry [28]. The principle governing an atmospheric pressure chemical ionization source is illustrated in figure II-8 and detailed in figure II-9.
25 analyte sprayed from the tip of the pneumatic nebulizer in a fine aerosol cloud. The spray droplets are then heated to relatively high temperatures, between 100 and 400 degrees Celsius, and displaced by high flow rates of nitrogen to the region of reaction. Heating combined with nitrogen nebulization induce vaporization and desolvation of the micro-droplets, so that the reaction zone contains analyte molecules, solvent molecules, nitrogen and water vapor, oxygen and carbon dioxide. The corona needle discharge due to high potential produces electrons which generate a primary ionization plasma of N2+•, CO2+•, O2+• and H2O+•. Those primary ions interact with the polar
molecules of the solvent and the water vapor to form reactive ions, as described in figure II-9. The high collision frequency between those reactive ions and the compounds of interest leads to the observation of a gain, in positive mode, or of a loss of proton, in negative mode. According to the respective proton affinities of the species present in the reaction zone, the proton will be transferred from the species with the lowest proton affinity to the species with the greatest proton affinity [21].
Figure II-9: Ionization mechanism in an APCI source [26]
APCI allows for flow rates from 0.1 mL.min-1 to 2.0 mL.min-1. Compared to electrospray ionization, APCI is a less soft ionization technique, i.e. it generates more fragment ions relative to the parent ion. Moreover, it produces only single charged ions and is suited for less polar molecules.
26 II.3.3.3 Atmospheric pressure photo-ionization source
A brief description of the atmospheric pressure photo-ionization source will be given in this paragraph despite of its non-utilization during the study. Indeed, APPI is a new emerging technology which allows to expand the range of applicability of the LC-MS instrumentation to very-low and non-polar compounds (see figure II-5). The atmospheric pressure photo-ionization source is very similar to the APCI source in its design, with the difference that solvent and analyte molecules, previously reduced in a fine spray by pneumatic nebulization and preheated, are irradiated by photons emitted from a UV lamp source, instead of electrons, to induce primary ionization, as illustrated in figure II-10. Several UV lamp sources, commercially available, provide selective ionization in regard of the energy emitted, like for instance, Krypton arc lamps (10 eV), Argon lamps (11.7 eV) or Xenon lamps (8.4 eV).
Figure II-10: Diagram of an atmospheric photo-ionization source [29]
The primary ionization can also occur by post-column addition of dopants, such as acetone or toluene. Thus, two mechanisms rule the APPI process:
Direct APPI: M + hν → M+• + e- Formation of the molecular radical cation M+•.
M+• + SH → [M+H]+ + S• Abstraction of a hydrogen from solvent molecule to
form [M+H]+.
Dopant APPI: D + hν → D+• + e- Formation of a radical cation D+•.
D+• + M → [M+H]+ + [D-H]• Abstraction of a hydrogen from the radical cation D+• to
form [M+H]+.
D+• + M → M+• + D Formation of the molecular radical cation M+• by electron
27 II.3.3.4 Atmospheric pressure high vacuum interface
Ions are steered from the ion source to the analyzer through the interface. The interface design is essential for the atmospheric pressure ionization sources. The role of the interface consists in transferring a maximum number of ions from the ion source, where they are generated, to the analyzer, where they are separated and measured [23]. It must be noticed that only 0.01% to 1% of the ions produced in the ion source enter the analyzer prior detection. In addition, the interface permits the ion transfer from the atmospheric pressure source compartment towards the very high vacuum analyzer compartment (10-7 Torr), by series of ion optics like, the sample capillary, the
skimmers, which are electronic lenses with very small orifices, and focusing octapole lenses. Furthermore, a counterflow of dry and preheated nitrogen gas, at the entrance of the capillary, is used to improve the removal of solvent molecules. Moreover, the adjustment of the first skimmer voltage, or fragmentor voltage, contributes to the final ion desolvation and ion declustering within the capillary, by provoking collisions between residual gas molecules and the accelerated ions. However, if the fragmentor voltage is too high, the energy transferred to the ions during those collisions may result in a sufficient increase in their internal energy to induce fragmentation. This phenomenon is known as in-source fragmentation. The first octapole acts as an ion guide and an energy distribution homogenizer by focusing the ion beam near the x-axis before getting into the mass analyzer. Furthermore, in this region, remaining neutral molecules are pumped away by the turbomolecular pumps, which provide ultra low pressure, necessary to avoid further decomposition, direction change, or else, charge neutralization of the ions before they get into the first mass analyzer [30].
II.3.4 Mass analyzers
Breakthrough in mass analyzer technology has been observed during the last two decades, offering most relevant laboratory solutions, particularly for leading-edge applications requiring ultra trace level sensitivity. Combining a quadrupole to a TOF analyzer in a mass spectrometer provides selectivity, flexibility for collision experiments, high resolving power, accurate mass measurements, great sensitivity and speed in scan mode. The technical features of both instruments, as well as their combination, will be introduced and discussed in the following chapters.
28 II.3.4.1 Single quadrupole mass analyzer
A quadrupole mass filter is made up of four strictly parallel metallic electrodes with circular or hyperbolic section [31], electrically connected together in diagonally opposite pairs. Positive and negative oscillating electrostatic fields, constituted by radiofrequency components (RF) superimposed on direct-current potentials (DC), are applied to each rod pair [32]. The complex ion trajectories within the quadrupole are illustrated by the Mathieu stability diagram. The trajectories depend on the precise voltage sets applied to the rods, and particularly to the DC to RF voltage ratios chosen, represented by linear scan lines, as shown in figure II-11.
Figure II-11: Examples of Mathieu stability diagrams for three different masses (upper diagram) and corresponding mass peak widths when applying different linear scan lines (diagram below) [33]
The Mathieu stability diagram is a plot of a parameter related to the RF voltage versus a parameter related to the DC voltage. The stable trajectories, corresponding to the grey-shaded triangular areas, represent all the possible combinations of RF and DC voltages allowing the ions of a certain mass to pass through the analyzer. Unstable trajectories, outside the grey-shaded triangular areas, result in ions being neutralized by striking the rods, as illustrated in the following figure by the blue dashed line.
29 Stable ion trajectory Unstable ion trajectory Figure II-12: Schematic diagram of ion trajectories in a quadrupole mass analyzer [34]
Varying the voltage set by increasing or decreasing the magnitude of the RF and DC voltages contributes to scan all the mass range. Similarly, changing the slope of the scan lines determines the mass peak width and the value of the resolution across the mass range. Generally, unit mass resolutions, corresponding of a decimal mass accuracy, in the hundreds of parts-per-million (ppm), are obtained with quadrupole mass filters. As the quadrupole mass filters present, on top of that, the advantages of high sensitivity, due to their elevated ion transmission capabilities, and also rapid switching between the selected ions, they are the best choice as first mass analyzer in tandem mass spectrometry analysis.
II.3.4.2 Hybrid quadrupole-time-of-flight mass analyzer
A hybrid quadrupole - time-of-flight mass analyzer corresponds to the combination of a quadrupole mass filter with a time-of-flight mass analyzer, both separated by a quadrupole or a hexapole analyzer, functioning in RF-only mode, in which ions undergo collisions with inert gas molecules, inducing partial or total fragmentation. A schematic of the instrumentation is shown in figure II-13.
30 Figure II-13: Schematic of a hybrid quadrupole - time-of-flight mass analyzer [30].
Time-of-flight mass analyzers stand for the simplest mass separation devices, since the basic principle is based on the difference of velocities between ions moving in a field-free region and initially accelerated with an identical kinetic energy [35]. More precisely, ions reaching the TOF, are orthogonally and simultaneously accelerated by a high voltage pulser into the flight tube. A 10 kilovolts electric potential difference is applied every 100 microseconds, corresponding to a pulser timing of 10 kHz. The ions enter then the electric field-free zone with a kinetic energy equivalent to their potential energy due to the voltage differential applied in the pulser assembly [30].
Ek = 1 mv2 = Ep = zeU (6)
2
m/z = 2 eU / v2 (7)
Where
e is the charge of an electron (e = 1.6 10-19 C).
z is the number of ion charges. U is the extraction pulse potential.
v is the ion velocity when no electric field is applied. m is the ion mass.
31 Moreover, the ion velocity is equal to the flight path length (L) divided by the time t of the ion flight from the pulser to the detector.
v = L / t (8)
As a result from equations (7) and (8), it can be concluded that the mass to charge ratio for a given ion is proportional to the square of the flight time, as expressed in the following equation:
m/z = 2 eUt2 / L2 (9)
Therefore, by measuring precisely the time separating the acceleration pulse and the detection of the ions, it is possible to determine accurately the mass to charge ratio for each ion. From equation (9), it can be also deduced that the lightest ions are detected first, since they travel faster across the TOF analyzer than the heaviest ions.
II.3.4.3 High resolution and mass accuracy measurements
Normally all the ions undergo the same acceleration energy from the extraction pulse, but in fact, slight differences in kinetic energy distribution exist, resulting in slight differences in arrival times of isobaric ions at the detector constituted of a micro-channel plate in combination with a scintillator and a photomultiplier tube [36]. In addition, all the ions of a given mass don’t leave the pulser at exactly the same position, leading in a spatial distribution and tiny gaps in detector striking times. Those both physical phenomena are at the origin of peak width broadening and thus, lower resolution and mass accuracy measurements. The spatial distribution is considerably minimized by positioning a slicer at the entrance of the TOF analyzer, which shapes the ion bunch into a narrow parallel beam. This slicer is made up of a long tube ended by fine rectangular slits intended to retain and eliminate the ions getting off the horizontal axis [30]. On the other hand, the kinetic energy distribution is corrected by using a reflectron, or ion mirror, consisting in series of increasing electric fields which discriminatingly slows down and refocused the ions with same m/z, before repulsing them as a single group towards the detector, as depicted in figure II-14.
32 Figure II-14: Schematic of a reflectron-TOF [37].
Ions with higher kinetic energy will penetrate deeper in the reflectron and will be repelled in the same time as the slightly less rapid ions and with lower kinetic energy, so that all the isobaric ions are finally regrouped in compressed ion packets. Besides narrowing the time-of-flight distribution for each ion mass, the reflectron contributes, by reversing the direction of the ion travel, to extend the time-of-flight path length and thus, the separation time, without increasing the bulk of the flight tube [37]. As a result of the homogenization of the kinetic energy distribution by the reflectron, the peak width measured at 50% height level on the mass scale, also called full width at half maximum (FWHM), is considerably reduced and consequently, the resolution is increased, according to the definition of this latter.
Rs = M / ΔM (10)
The resolution, or resolving power, corresponds to the ability of the mass spectrometer to distinguish between two ions with close mass-to-charge ratios [21]. ΔM stands for the smallest gap between two resolved peaks at masses M and M + ΔM, as illustrated in figure II-15.
33 High resolution instruments, like TOF based instruments, achieve resolution up to 10,000. Such resolutions contribute to considerably narrow the peak width, allowing the determination of the peak centroid with greater precision and accuracy, so that the instrumental mass resolving power has a great incidence on the mass measurement accuracy. Accuracy, or mass error, is expressed in parts per million (ppm) and defined as the difference between the calculated mass-to-charge ratio (m/z calculated) and the measured mass-to-charge ratio (m/z measured) divided by the calculated
mass-to-charge ratio [39]:
Error (ppm) = (m/z measured - m/z calculated) / m/z calculated x 106 (11)
TOF mass spectrometers perform outstanding mass measurements in the milli-Dalton range (mDa), representing errors in the order of 3 to 5 ppm and allowing the determination of exact masses. This constitutes, with scan speed and extended dynamic range, one of the main advantages of QTOF instruments over unit mass resolution detectors like triple-quadrupoles and ion traps, for example. Table II-1 summarizes comparatively the performance characteristics of the principal mass analyzers available in the analytical chemistry field and illustrates the great capabilities of the quadrupole – time-of-flight.
Table II-1: Performance comparison of different mass spectrometers [30].
The exact mass information obtained with the quadrupole – time-of-flight analyzer provides useful indications about the isotopic pattern and, more specifically, about the isotopic spacing, which contribute first, to the determination of the ion charge state, and second, to the prediction of a reduced number of possible empirical formulas for the investigated substance.
34 This propensity to eliminate unlikely or incorrect molecular formulas and to limit the choice of elemental compositions to only few options is particularly interesting and appropriate in cases of structure elucidation. Moreover, narrowing the mass window conduces to filter out co-eluting matrix interferences and competing compounds. Consequently, the chemical noise is decreased, inducing an increase of the sensitivity. Thus, QTOF technology offers significantly high sensitivity, and particularly when functioning in scan mode. For instance, QTOF demonstrates superior sensitivity compared to triple-quadrupole mass spectrometer technology when operating in full scan mode.
However, in order to maintain the accuracy of the instrument and avoid mass shifting generated by small temperature variations and vacuum or electronic unstability, a continuous mass-axis calibration is performed during the analysis. This mass assignment is performed continuously using a solution containing known reference masses (see part III-1.3 for more details about those reference masses). Additionally, an operation called “tuning” is carried out every second week. “Tuning” consists in adjusting ion optics, quadrupole and time-of-flight parameters to achieve the most efficient ion transmission and the optimum signal intensity and resolution. Those adjustment operations are done automatically by the instruments.
II.3.4.4 QTOF operating modes
The quadrupole – time-of-flight mass spectrometer can operate in different modes which are the TOF mode and the product ion scan mode, comprising auto MS/MS and targeted MS/MS functions. In TOF mode the quadrupole works in total transmission ion mode, which means that no collision energy is applied in the collision cell. All the ions are focused near the axis, through the quadrupole and the collision cell, and transmitted from the interface to the time-of-flight mass detector without undergoing any fragmentation. Then the TOF analyzes the ions in scan mode and provides the MS spectra.
In targeted MS/MS analysis, the quadrupole works in selected ion monitoring mode (SIM mode). Specific precursor ions, as defined in the “target mass list” table, are isolated by the quadrupole and transmitted towards the collision chamber where they are fragmented. The fragment ions generated are analyzed by the TOF in scan mode, providing MS/MS spectra. This operating mode is particularly adapted for quantitative analysis, identification and structural elucidation of known compounds [30].
35 In auto MS/MS analysis, the instrument performs analysis in SIM mode. Precursor ions are chosen by the instrument among the most abundant ions, according to criteria previously entered, like the maximum number of ions to consider, the charge state, the absolute and the relative threshold values, and the preferred/exclude ions table. The collision cell generates fragment ions by colliding the selected precursor ions with nitrogen and the TOF analyzes the fragment ions in scan mode and provides the MS/MS spectra. This operating mode is particularly adapted when investigating the identification and the structural composition of unknown compounds [30].
The amount of information gathered during a series of tests containing many samples, will be so substantial, that a tool for data processing may be necessary, or even indispensable, to interpret the results and facilitate decision support. Principal component analysis and hierarchical clustering analysis are the data exploratory analysis methods of choice used in this study. The next chapter is consecrated to the explanatory description of these two useful statistical techniques.
II.4 Multivariate data analysis
Multivariate data analysis, also called chemometrics, refers to extremely powerful statistical decision tools like principal component analysis or hierarchical clustering analysis, for example. Nowadays largely applied in the field of modern analytical chemistry, the term “chemometrics” was first introduced in 1972, by Swante Wold, a Swedish professor of organic chemistry. Those kinds of data analysis techniques are modeling sciences based on sophisticated mathematical methods, and particularly matrix calculations, with the aim of retrieving the significant information from a signal [40]. Indeed, an instrumental signal results in a combination of two components, firstly, a descriptive information, which can be assimilated to variation, specific and characteristic of the signal, and second, a residual part, the noise. Thus, the major interest of multivariate data analysis consists in separating the information from the noise and consequently, simplifying the interpretation of complex and huge datasets, helping to make insightful decision.
36 II.4.1 Principal component analysis
Principal component analysis is without contest one of the actual most largely used multivariate exploratory data analysis techniques in modern laboratories. The success of PCA is linked to its ability to reduce the complexity of large datasets, characterized by high dimensionality, into simplest but significant information with smaller dimensionality and consequently, easier to work out.
In practical terms, PCA consists first in transforming the original data matrix constituted in “n” observations or samples, as rows, and “k” variables or measurements, as columns, into a covariance matrix C or Cov (X,Y). The covariance is a measure of the simultaneous variation of two random variables, X and Y for example. It corresponds to the summation of the differences between the Xi
values and the mean of X multiplied by the differences between the Yi values and the mean of Y,
divided by the number of observations minus 1, as expressed by equation (12).
n _ _
C = Cov (X,Y) = 1/(n-1) ∑ (Xi – X)( Yi – Y) (12)
i = 1
The covariance matrix C is then transformed into a diagonal matrix, the matrix of eigenvalues λi,
and the related matrix of eigenvectors νi, as expressed by equation (13):
C νi = λi νi (13)
When the eigenvalues of the covariance matrix C are the solutions of the following equation (14):
det [C- λ I] = 0 (14)
Where
I is the identity matrix.
det [ ] stands for the determinant of the matrix.
Eigenvalues and eigenvectors are closely linked. Eigenvalues denote the variability within the corresponding eigenvectors. Eigenvectors are called principal component (PC) and there are as many principal components as dimensions in the original matrix, generally, only few of them are sufficient to describe significantly the relationships among the data.
37 directions with maximum variability, the original dimensionality of the dataset will be reduced to the number of PC chosen, simplifying consequently the data investigation. The eigenvector with the highest eigenvalue represents the first principal component and characterize the largest variation in the dataset as shown in figure II-16.
Figure II-16: Variance explained by the first principal component [41]
The second principal component stands for the eigenvector with the second largest eigenvalue. This component is of lesser significance and explains lesser dispersion as illustrated in figure II-17. The second principal component is orthogonal to the first principal component, so that both constitute the new axes of a projection plane.
![Figure II-1: Graphical representation of Gaussian peaks in a typical chromatogram [16]](https://thumb-eu.123doks.com/thumbv2/123doknet/5622340.135612/18.892.154.740.602.958/figure-ii-graphical-representation-gaussian-peaks-typical-chromatogram.webp)
![Figure II-2: LC-MS - the marriage between the bird and the fish [18]](https://thumb-eu.123doks.com/thumbv2/123doknet/5622340.135612/20.892.266.690.730.1046/figure-ii-lc-ms-marriage-bird-fish.webp)
![Figure II-5: Ionization range by ESI, APCI, and APPI as a function of analyte polarity and molecular weight [24]](https://thumb-eu.123doks.com/thumbv2/123doknet/5622340.135612/24.892.167.729.155.557/figure-ionization-range-function-analyte-polarity-molecular-weight.webp)
![Figure II-6: Diagram of an electrospray ionization source functioning in positive mode [26]](https://thumb-eu.123doks.com/thumbv2/123doknet/5622340.135612/25.892.144.752.216.554/figure-diagram-electrospray-ionization-source-functioning-positive-mode.webp)
![Figure II-11: Examples of Mathieu stability diagrams for three different masses (upper diagram) and corresponding mass peak widths when applying different linear scan lines (diagram below) [33]](https://thumb-eu.123doks.com/thumbv2/123doknet/5622340.135612/30.892.210.709.404.750/examples-mathieu-stability-diagrams-different-corresponding-applying-different.webp)
![Figure II-17: Variance explained by the second principal component [42]](https://thumb-eu.123doks.com/thumbv2/123doknet/5622340.135612/39.892.326.595.752.1096/figure-ii-variance-explained-second-principal-component.webp)
![Figure III-5: Performance of Kinetex™ Core-Shell particles compared to fully porous sub-2µm and 3µm particles [46]](https://thumb-eu.123doks.com/thumbv2/123doknet/5622340.135612/50.892.193.701.282.605/figure-performance-kinetex-shell-particles-compared-porous-particles.webp)
