arXiv:astro-ph/0503471v1 22 Mar 2005
(will be inserted by hand later)
An
XMM-Newton
observation of the multiple system HD 167971
(O5-8V + O5-8V + (O8I)) and the young open cluster NGC 6604
⋆
M. De Becker
1, G. Rauw
1 ⋆⋆, R. Blomme
2, J.M. Pittard
3, I.R. Stevens
4, and M.C. Runacres
21
Institut d’Astrophysique, Universit´e de Li`ege, All´ee du 6 Aoˆut, Bˆat B5c, B-4000 Li`ege (Sart Tilman), Belgium
2
Royal Observatory of Belgium, Avenue Circulaire 3, 1180 Brussels, Belgium
3
Department of Physics & Astronomy, University of Leeds, Leeds LS2 9JT, UK
4
School of Physics & Astronomy, University of Birmingham, Edgbaston Birmingham B15 2TT, UK Received date / Accepted date
Abstract.We discuss the results of two XMM-Newton observations of the open cluster NGC 6604 obtained in April and September 2002. We concentrate mainly on the multiple system HD 167971 (O5-8V + O5-8V + (O8I)). The soft part of the EPIC spectrum of this system is thermal with typical temperatures of about 2 × 10⁶ to 9 × 10⁶K. The nature (thermal vs non-thermal) of the hard part of the spectrum is not unambiguously revealed by our data. If the emission is thermal, the high temperature of the plasma (∼ 2.3 × 10⁷
to 4.6 × 10⁷
K) would be typical of what should be expected from a wind-wind interaction zone within a long period binary system. This emission could arise from an interaction between the combined winds of the O5-8V + O5-8V close binary system and that of the more distant O8I companion. Assuming instead that the hard part of the spectrum is non-thermal, the photon index would be rather steep (∼ 3). Moreover, a marginal variability between our two
XMM-Newton pointings could be attributed to an eclipse of the O5-8V + O5-8V system. The overall X-ray luminosity points
to a significant X-ray luminosity excess of about a factor 4 possibly due to colliding winds. Considering HD 167971 along with several recent X-ray and radio observations, we propose that the simultaneous observation of non-thermal radiation in the X-ray (below 10.0 keV) and radio domains appears rather unlikely. Our investigation of our XMM-Newton data of NGC 6604 reveals a rather sparse distribution of X-ray emitters. Including the two bright non-thermal radio emitters HD 168112 and HD 167971, we present a list of 31 X-ray sources along with the results of the cross-correlation with optical and infrared catalogues. A more complete spectral analysis is presented for the brightest X-ray sources. Some of the members of NGC 6604 present some characteristics suggesting they may be pre-main sequence star candidates.
Key words.radiation mechanisms: non-thermal – stars: early-type – stars: individual: HD 167971 – stars: winds, outflow – X-rays: stars
1. Introduction
The nature of the X-ray emission from hot stars has been the subject of many discussions over the last three decades. The bulk of the X-ray emission of single O-stars arises in a hot op-tically thin thermal plasma inside the stellar wind. These plas-mas are believed to be heated up to several 106K by shocks
re-sulting from instabilites related to the line driving mechanism responsible for the mass loss of massive stars (see e.g. Owocki & Rybicki 1985; Feldmeier et al. 1997). The case of massive binaries is more complex, because they harbour a wind interac-tion zone that can produce a substantial addiinterac-tional X-ray emis-sion (Stevens et al. 1992). Such a wind colliemis-sion is expected to heat the shocked plasma to temperatures of several 107K.
⋆
Based on observations with XMM-Newton, an ESA Science Mission with instruments and contributions directly funded by ESA Member states and the USA (NASA). Partly based on observations collected at the European Southern Observatory (La Silla, Chile).
⋆⋆
Research Associate FNRS (Belgium)
Some massive stars are known to display non-thermal emis-sion in the radio domain (see e.g. Bieging et al. 1989; Williams 1996). Dougherty & Williams (2000) showed that most of the non-thermal radio emitting Wolf-Rayet (WR) stars are bina-ries, suggesting that the non-thermal phenomenon might be in-timately related to multiplicity. However, the situation for O-stars is much less clear as the binary fraction among O-type non-thermal radio emitters is apparently lower than for WR stars (see Rauw 2004).
The non-thermal radio emission, which is thought to be synchrotron emission (White 1985), requires the presence of a population of relativistic electrons inside the radio emitting region, as well as the existence of a moderate magnetic field. On the one hand, high energy electrons could be accelerated through the first order Fermi mechanism in shocks (Pollock 1987; Chen & White 1991; Eichler & Usov 1993). On the other hand, the existence of magnetic fields of a few hundred Gauss has recently been confirmed in the case of a few massive stars (Donati et al. 2001, 2002). For a discussion
of the physical processes involved in this scenario, see e.g. De Becker et al. (2005). If the ingredients required for non-thermal radio emission are present, one may wonder whether the relativistic electrons could produce a signature at other, essentially higher, energies. Indeed, the intense UV flux from massive stars could interact with relativistic electrons through Inverse Compton (IC) scattering resulting in a power law X-ray emission component (Eichler & Usov 1993; Chen & White 1994). Such a scenario could apply both to single and binary systems, since both types of objects are believed to harbour hydrodynamic shocks that could accelerate particles. There are two major questions to be addressed in order to fully understand non-thermal phenomena in early-type stars: (1) one has to establish whether non-thermal X-ray emission really occurs, and (2) one has to check whether single stars are indeed able to produce non-thermal radiation.
In the framework of these considerations, non-thermal radio emitting massive stars are a priori privileged targets to search for an X-ray counterpart to this non-thermal radio emission. We therefore initiated a joint X-ray and radio campaign aiming at a better understanding of the emission processes in non-thermal radio emitters. The first target of this campaign observed with XMM-Newton was the O4V((f+)) star
9 Sgr (Rauw et al. 2002). Whilst the X-ray spectrum of 9 Sgr displays indeed a hard emission tail, the very nature of the latter, thermal or non-thermal, could not be fully established. Optical spectra of 9 Sgr revealed long term radial velocity variations suggesting that 9 Sgr could indeed be a long-period binary system. The second object considered was HD 168112 (De Becker et al. 2004b). This O5.5III(f+) star, belonging to the NGC 6604 cluster (Barbon et al. 2000), also shows some evidence for binarity although no radial velocity variations were found. Indeed, De Becker et al. (2004b) report changes of the nature of the radio emission (going from composite to strongly non-thermal, with a flux variation by a factor 5-7) simultaneously with a significant decrease of the X-ray flux (about 30%), suggesting that a wind collision occurs in an eccentric long period binary system seen under low inclination. Blomme et al. (2005a) suggest a∼ 1.4 yr period for the radio
fluxes. These results lend further support to the idea that binarity might be a necessary condition for non-thermal radio emission, also in O-stars. This paper is mainly devoted to the study of HD 167971, another non-thermal radio emitter which is known to be a multiple system (Leitherer et al. 1987), and belongs also to NGC 6604.
HD 167971 was first classified as an O8f star (Hiltner 1956). This system has been a target of several photometric studies (i.e. Johnson 1965; Moffat & Vogt 1975; Leitherer & Wolf 1984). The IR study of Bertout et al. (1985) yielded
˙
M ∼ 9.4 × 10⁻⁶M
⊙yr−1 and v∞ ∼ 2120 km s−1. In a
more recent photometric and spectrometric study, Leitherer et al. (1987) proposed this system to consist of a close eclipsing binary made up of 2 similar O-stars, with a third more lumi-nous and more distant O-type companion (O5-8V + O5-8V + (O8I)). Their analysis of the light curve revealed a 3.3213 days period for the eclipsing binary. They found a mass loss rate of
∼ 2 × 10⁻⁶M
⊙yr−1 and a terminal velocity of 3100 km s−1
for the brightest third star. The study of Davidge & Forbes (1988) confirmed the orbital period of the close binary sys-tem. Their photometric solution, which is in better agreement with observations, has non-zero third light, suggesting that HD 167971 is indeed a multiple system. However, we note that at this stage there is no evidence of a gravitational link between the third star and the eclipsing binary.
In his review of radio emitting hot stars, Williams (1996) lists HD 167971 as a non-thermal emitter, with a radio spectral
index of −0.6 and a 6 cm flux level ranging between 13.8
and 17.0 mJy. It is the strongest non-thermal radio emitter reported in the study of Bieging et al. (1989). This star appears consequently to be a good candidate to study the implication of binarity on non-thermal emission processes. This paper is devoted to the analysis of two XMM-Newton pointings obtained in 2002. The radio results from the VLA, as well as a discussion of archive radio data, will be presented in a separate paper (Blomme et al. 2005b, in preparation).
NGC 6604 is a rather compact open cluster lying at the core of the HII region S54 (Georgelin et al. 1973), in the Ser OB2 association (Forbes 2000). The study of Forbes & DuPuy (1978) revealed that it is rather young (∼ 4 Myr) as
suggested also by the possible presence of pre-main sequence (PMS) objects. However, the study of Barbon et al. (2000) did not confirm the existence of pre-main sequence stars, although these authors also derived an age of the cluster of about 5± 2 Myr. The same authors derive a distance to the cluster of
about 1.7 kpc. In addition to the study of the two non-thermal radio emitters mentioned hereabove, the X-ray observation of NGC 6604 offers also the possibility to study the stellar population of the cluster. Indeed, recent XMM-Newton obser-vations of NGC 6383 (Rauw et al. 2003) and NGC 6231 (Sana et al. 2005) reveal a strong concentration of X-ray selected PMS stars around the most massive cluster members that are found in the cluster core. Such mass segregated clusters with a concentration of low-mass PMS objects could indicate that the most massive stars have formed through a combination of gas accretion and stellar collisions in the very dense core of the cluster (Bonnell et al. 1998; Bonnell & Bate 2002; Bonnell et al. 2003). The XMM-Newton observation of NGC 6604 is expected to bring new insight on the existence of low-mass PMS stars in this cluster.
This paper is organized as follows. In Sect. 2, we briefly discuss the data reduction. Section 3 describes the X-ray spec-tral analysis, as well as some considerations relevant to the colliding winds context. In Sect. 4 we compare our results for HD 167971 with archival X-ray observations. Section 5 is de-voted to a general discussion of HD 167971. The X-ray emis-sion from the other sources in the field of view is discussed in Sect. 6. Finally, our conclusions are presented in Sect. 7.
2. Observations
We obtained two XMM-Newton (Jansen et al. 2001) obser-vations of the NGC 6604 open cluster during revolution
426, in April 2002 (Obs.ID 0008820301, JD 2 452 372.477 – 2 452 372.637), and revolution 504, in September 2002 (Obs.ID 0008820601, JD 2 452 526.694 – 2 452 526.868). The aim-point of these observations was set in such a way as to monitor simultaneously the two non-thermal radio emitters HD 168112 and HD 167971 within a single EPIC field of view. The exposure time for both observations was about 13 ks. For details on these exposures and on the reduction procedure, we refer to the paper devoted to HD 168112 (De Becker et al. 2004b).
The X-ray events of HD 167971 were selected from inside a 60 arcsec radius circular region centered on the star. The background was extracted from an annular region around the source. The inner and outer radius of this annulus were chosen to obtain a surface area roughly equal to the source region area. Both regions are shown in Fig. 1 in the case of the three EPIC fields, for both observations. In each case, the source region is affected by at least one gap, which was excluded by means of a rectangular box. These boxes were adjusted following a care-ful inspection of the adequate exposure maps. Unfortunately these gaps sometimes cross the source region close to its cen-ter, strongly affecting the results discussed hereafter. In the case of the EPIC-pn data sets, the background region is crossed by a bad column which was also removed with a box.
3. The EPIC spectrum of HD 167971
3.1. Spectral analysis
As already stated by De Becker et al. (2004b), the end of the April 2002 exposure is affected by a strong soft proton flare (see Lumb 2002). However, it appears that the background sub-traction provides an efficient correction, and the contaminated time interval was therefore not rejected. Indeed, the level of the background is at least a factor 2 lower than the mean count rate inside the source region1.
To carry out this spectral analysis, we followed the same procedure as already applied to other targets like HD 159176 (De Becker et al. 2004a) and HD 168112 (De Becker et al. 2004b). We chose a list of models including thermal and non-thermal emission components. Massive stars are known to display thermal spectra with strong and broad emission lines (e.g.ζ Pup, Kahn et al. 2001; τ Sco, Cohen et al. 2003). Most
current models consider that, in the case of single O-stars, such hot plasmas are produced by strong shocks inside the stellar wind (Feldmeier et al. 1997). To model the emission spectrum arising from such plasmas, we used an optically thin thermal plasmamekalmodel (Mewe et al. 1985; Kaastra 1992) avail-able within XSPEC. In the case of massive binaries, colliding winds can also heat the plasma in the wind interaction zone to a temperature of up to a few times 107K. The emission from
the wind interaction zone can also be modelled with optically thin thermal plasma codes (see e.g. the case of HD 159176, De Becker et al. 2004a). Moreover, to account for the possibility of
1
In the case of HD 168112 (De Becker et al. 2004b), the soft pro-ton flare did not affect significantly the spectral analysis although the background level was of the same order of magnitude as the source count rate.
non-thermal emission arising from the Inverse Compton (IC) scattering of UV photons due to the presence of a population of relativistic electrons (Pollock 1987; Chen & White 1991; Eichler & Usov 1993), power law models were also considered. Our grid of models therefore includes pure thermal models, and thermal plus non-thermal models.
The χ2 minimization technique was used to estimate the
quality of the fits described in the following paragraphs of this section. The parameter values quoted in Tables 2 and 3 are obtained through this method. However, to check the consistency of our approach, we confronted these results with those obtained with other techniques. Indeed, when one deals with small count numbers the parameter estimation could be achieved through the C-statistic (Cash 1979), or alternatively with theχ2statistic using a Churazov weighting (Churazov et
al. 1996). Both methods yield results compatible with those quoted in Tables 2 and 3 within the error bars.
3.1.1. Wind absorption
In each case, two separate absorption columns were used to ac-count for interstellar (ISM) and circumstellar (wind material) absorption respectively. The first absorption component is due to neutral material and the hydrogen column density was fixed at 0.63× 1022cm−2. This value was obtained through the gas
to dust ratio given by Bohlin et al. (1978), using a(B − V )
color index of +0.77 (Chlebowski et al. 1989) and an intrinsic color index(B − V )oof –0.31 estimated for an O8 star (see
e.g. Mihalas & Binney 1981). For the second absorption col-umn, left as a free parameter while fitting the spectra, we used the ionized wind model already presented by Naz´e et al. (2004). This model considers the absorption by the 10 most abundant elements (H, He, C, N, O, Ne, Mg, Si, S and Fe) fixed at their solar abundances (Anders & Grevesse 1989). We used the stel-lar fluxes from the Kurucz library of spectra, and a standard wind velocity law withβ = 0.8.
The main problem to model the wind properties of HD 167971 with this model is that it only accounts for the geometry of a single star wind, although we know that our target is a triple system. The choice of the parameters ad-equate for our purpose is therefore not straightforward. To check the sensitivity of the wind opacity calculated by this model regarding the stellar parameters, we computed sev-eral opacity tables covering a parameter space typical for a range of spectral types including that of the components of HD 167971. This grid was calculated for mass loss rates rang-ing from 10−6 to 10−5M
⊙yr−1, and terminal velocities
be-tween 2200 and 3100 km s−1. These domains cover
differ-ent values proposed by some authors for the parameters of HD 167971 (Bertout et al. 1985; Leitherer et al. 1987). We used also three different Kurucz spectra, respectively referred to as
low (Teff=30 000; logg=3.5), medium (Teff=35 000; logg=4.0),
and high (Teff=40 000; logg=4.5), and we computed the optical
depth (τ ) as a function of the energy for X-ray emitting shells
located between 1.5 and 100 stellar radii. The opacities result-ing from the normalization ofτ by the hydrogen column of the
See GIF figure (fig1.gif)
Fig. 1. Source (circle) and background (annulus) regions selected for the spectrum extraction of HD 167971. Boxes were used
to exclude the CCD gaps and bad columns. We see clearly that some observations are strongly affected by the presence of these gaps. The images are displayed in detector coordinates.
Table 1. Parameters selected to compute the opacity table used
for the modelling of the absorption of X-rays by the ionized wind material. Teff(K) 35 000 log g 4.0 ˙ M (M⊙yr−1) 5 × 10⁻⁶ V∞(km s−1) 3100 Rshell(R∗) 5
wind is very similar whatever the case considered within this parameter space. Consequently, any set of parameters located within the boundaries discussed hereabove appears to be ade-quate. In the next section, we will discuss spectral fittings us-ing the opacities we obtained from the high Kurucz spectrum, and the parameters quoted in Table 1. The parameters were se-lected on the basis of the values used or derived by Leitherer et al. (1987) in the computation of synthetic Hα profiles for this
star. Fig. 2 shows the normalizedτ as a function of the energy
for the ionized wind (solid line), along with the same quantity for neutral material (dashed line). We see that the largest devi-ation between the neutral and ionized cases is observed at low energies. The opacity table obtained with the parameters listed in Table 1 was converted into a FITS table in a format suit-able to be used as a multiplicative absorption model within the
XSPECsoftware. It will be referred to as thewindabsorption model in the remainder of this paper.
Fig. 2. Opacity resulting from the normalization of the
opti-cal depth by the hydrogen column density as a function of the energy for ionized (solid line) and neutral (dashed line) wind material.
3.1.2. Spectral fittings
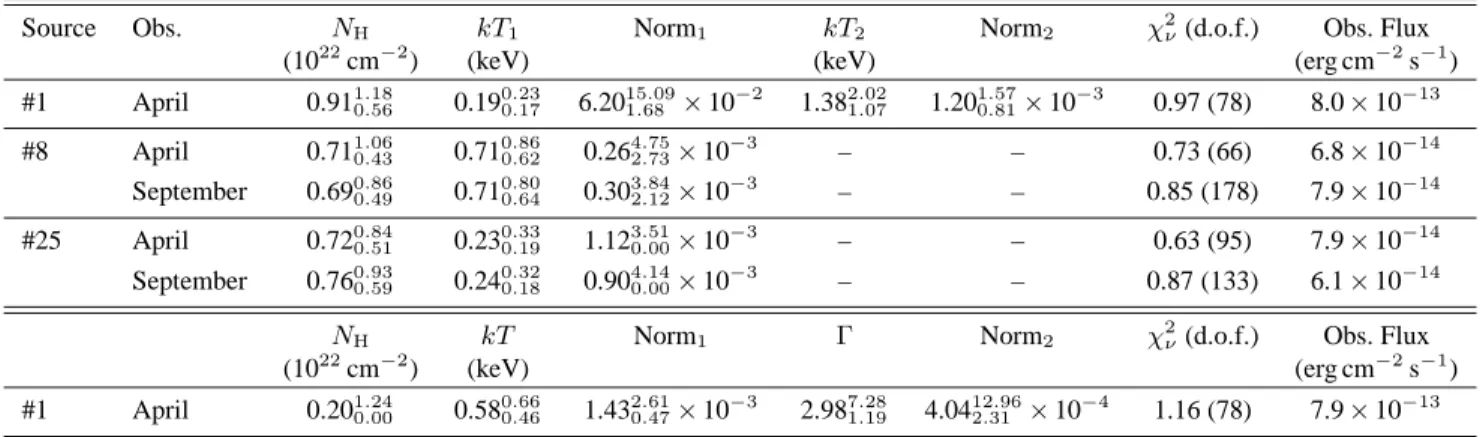
As previously mentioned, most of our data sets are strongly af-fected by the presence of gaps and/or bad columns. Only the EPIC-MOS1 and EPIC-MOS2 observations of April, and to some extent the EPIC-pn observation of September appear to be only slightly affected. In all other cases, the CCD gaps lie very close to the center of the PSF of the source. Since the data seriously affected by gaps yield unreliable spectral fits, we con-sider only the spectral fits for those data that are least affected. Two-component models were used as a first step with some success, but it appeared that those models were unable to fit
Table 2. Parameters for EPIC spectra of HD 167971 in the case of awabs*wind*(mekal+mekal+mekal)model. Results are given for MOS1, MOS2, combined MOS in the case of the April observation, and for EPIC-pn only in the case of the September one. The first absorption component is frozen at 0.63× 1022cm−2. The second absorption column, quoted asN
w(in
cm−2), stands for the absorption by the ionized wind material. The last column gives the observed flux between 0.4 and 10.0
keV. The normalization parameter (Norm) of themekalcomponent is defined as(10−14/(4 π D2))Rn
enHdV , where D, ne
andnHare respectively the distance to the source (in cm), and the electron and hydrogen number densities (in cm−3). The error
bars represent the 1-σ confidence interval.
Log Nw kT1 Norm1 kT2 Norm2 kT3 Norm3 χ2ν Obs.Flux
(keV) (keV) (keV) d.o.f. (erg cm−2s−1)
April MOS1 21.77 0.27 1.38 × 10⁻² 0.79 2.05 × 10⁻³ 3.30 6.38 × 10⁻⁴ 0.867 1.79 × 10⁻¹² ±0.08 ±0.02 ±0.67 × 10⁻² ±0.08 ±0.72 × 10⁻³ ±1.32 ±3.86 × 10⁻⁴ 120 MOS2 21.78 0.24 1.68 × 10⁻² 0.77 2.62 × 10⁻³ 3.96 4.26 × 10⁻⁴ 1.115 1.69 × 10⁻¹² ±0.07 ±0.02 ±0.76 × 10⁻² ±0.06 ±0.76 × 10⁻³ ±2.68 ±3.81 × 10⁻⁴ 116 MOS1 21.78 0.25 1.52 × 10⁻² 0.78 2.35 × 10⁻³ 3.57 5.21 × 10⁻⁴ 0.973 1.70 × 10⁻¹² + MOS2 ±0.05 ±0.01 ±0.50 × 10⁻² ±0.05 ±0.52 × 10⁻³ ±1.25 ±2.73 × 10⁻⁴ 243 September pn 21.69 0.27 9.55 × 10⁻³ 0.77 1.87 × 10⁻³ 2.40 5.47 × 10⁻⁴ 1.089 1.49 × 10⁻¹² ±0.06 ±0.01 ±2.86 × 10⁻³ ±0.05 ±0.43 × 10⁻³ ±0.43 ±2.32 × 10⁻⁴ 244
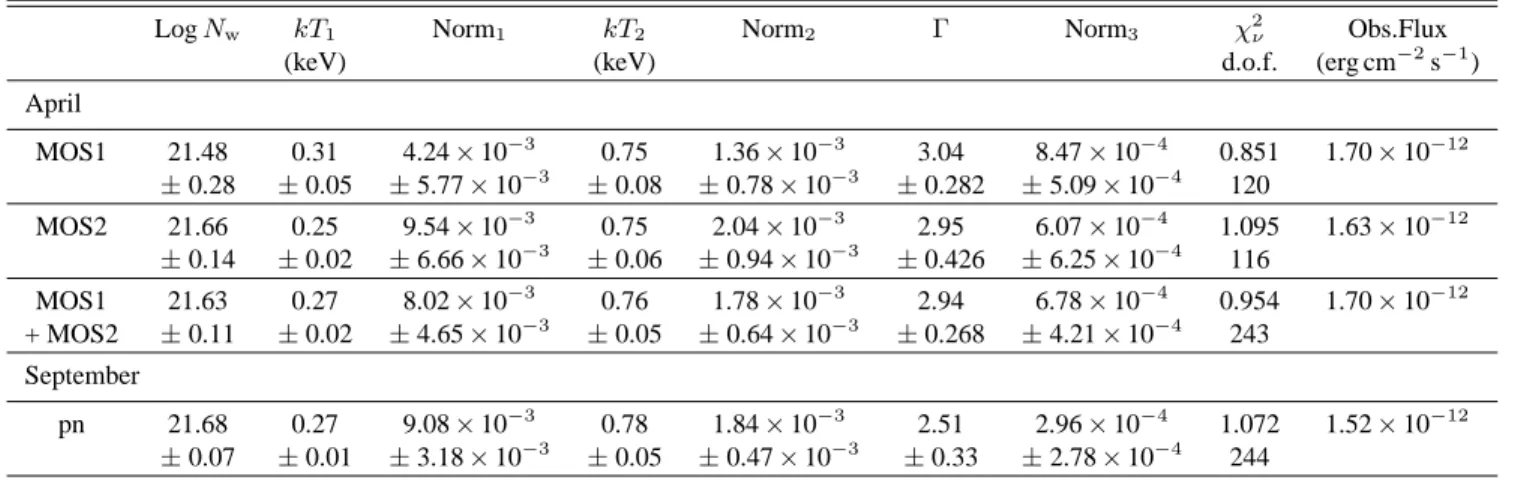
Table 3. Same as Table 2, but in the case of awabs*wind*(mekal+mekal+power)model. For the power law component,
the normalization parameter (Norm3) corresponds to the photon flux at 1 keV.
Log Nw kT1 Norm1 kT2 Norm2 Γ Norm3 χ2ν Obs.Flux
(keV) (keV) d.o.f. (erg cm−2s−1)
April MOS1 21.48 0.31 4.24 × 10⁻³ 0.75 1.36 × 10⁻³ 3.04 8.47 × 10⁻⁴ 0.851 1.70 × 10⁻¹² ±0.28 ±0.05 ±5.77 × 10⁻³ ±0.08 ±0.78 × 10⁻³ ±0.282 ±5.09 × 10⁻⁴ 120 MOS2 21.66 0.25 9.54 × 10⁻³ 0.75 2.04 × 10⁻³ 2.95 6.07 × 10⁻⁴ 1.095 1.63 × 10⁻¹² ±0.14 ±0.02 ±6.66 × 10⁻³ ±0.06 ±0.94 × 10⁻³ ±0.426 ±6.25 × 10⁻⁴ 116 MOS1 21.63 0.27 8.02 × 10⁻³ 0.76 1.78 × 10⁻³ 2.94 6.78 × 10⁻⁴ 0.954 1.70 × 10⁻¹² + MOS2 ±0.11 ±0.02 ±4.65 × 10⁻³ ±0.05 ±0.64 × 10⁻³ ±0.268 ±4.21 × 10⁻⁴ 243 September pn 21.68 0.27 9.08 × 10⁻³ 0.78 1.84 × 10⁻³ 2.51 2.96 × 10⁻⁴ 1.072 1.52 × 10⁻¹² ±0.07 ±0.01 ±3.18 × 10⁻³ ±0.05 ±0.47 × 10⁻³ ±0.33 ±2.78 × 10⁻⁴ 244
data above about 4-5 keV. As a consequence, we used three
component models, each one having twomekalthermal
com-ponents, plus another thermal or power law component. Solar abundances are assumed throughout our fitting procedure. The results obtained with these two models are summarized in Tables 2 and 3. The last column of these tables yields the observed (i.e. absorbed) flux integrated between 0.4 and 10.0 keV for each set of model parameters. The dispersion on the flux was evaluated from the range of fluxes for the models with parameters covering the confidence intervals quoted in Tables 2 and 3. According to this approach, the error on the flux in that energy band is expected to be about 5 %.
First, the EPIC-MOS1 and EPIC-MOS2 results of the April observation appear to be very consistent, and our models were also fitted to the two data sets simultaneously. A comparison
between the results of the two models reveals no significant dif-ferences in the quality of the fit. Both models are nearly equiva-lent within the error bars for the two first thermalmekal com-ponents. The χ2
ν values obtained and used as goodness-of-fit
criterion are very similar for all EPIC instruments, either con-sidered independently or combined. Moreover, the fluxes esti-mated on the basis of these two models are similar within the error bars, reinforcing the idea that both models reproduce the spectral shape rather consistently. Unfortunately, the poor qual-ity of the data above 5 keV does not allow us to unambiguously check for the presence of the Fe K line that could help constrain the nature of the hard spectral component. These results show that the ambiguity of the nature of the hard part of the spec-trum (thermal versus non-thermal) can not be alleviated with our data. This case is reminiscent of the results of the
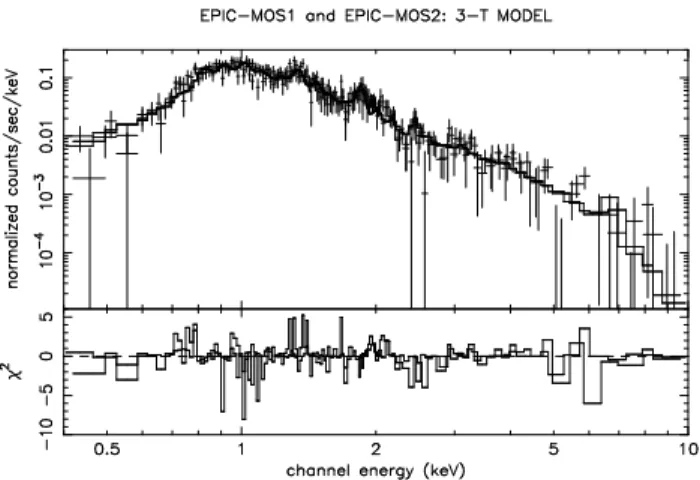
XMM-Fig. 3. Combined EPIC-MOS1 and EPIC-MOS2 spectra of
HD 167971 for the April 2002 observation, fitted with a wabs*wind*(mekal+mekal+mekal)model between 0.4 and 10.0 keV.
Fig. 4. EPIC-pn spectrum of HD 167971 of
the September 2002 observation, fitted with a
wabs*wind*(mekal+mekal+mekal) model between 0.4 and 10.0 keV. The three components are individualy displayed.
Newton observations obtained in the case of other non-thermal
radio emitters (see e.g. 9 Sgr, Rauw et al. 2002).
The EPIC-pn observation of September gives results very similar to those of the EPIC-MOS ones of April. Even if some systematic deviations could be expected as the EPIC-MOS and EPIC-pn instruments are somewhat different, we see that the overall spectral shape remained more or less steady between the two observations. If we consider the three-temperature model, we see that the emission measure of the soft ther-mal component decreases from April to September. This de-crease is responsible for the lower flux quoted in Table 2 for the September pointing. However, if we consider the model de-scribed in Table 3, it is the normalization factor of the power law which decreases between the two pointings whilst the pa-rameters of the two thermal components remain steady.
Table 4. Observed count rates for the three EPIC instruments
evaluated between 0.4 and 10.0 keV. The error bars on the count rates represent the 1-σ confidence interval.
Observation MOS1 CR MOS2 CR pn CR
(cts s−1) (cts s−1) (cts s−1) April 2002 0.146 0.143 – ±0.004 ±0.004 September 2002 – – 0.465 ±0.008
3.2. X-ray luminosity of HD 167971
3.2.1. X-ray variability
When investigating the X-ray variability of a system like HD 167971, one has to consider several scenarios likely to produce variations in the X-ray luminosity. Variability could indeed be expected for several reasons. First, the interaction of the stellar winds of the two components of the O5-8V + O5-8V close binary system could vary with the phase. Since the close binary has a circular orbit (van Genderen et al. 1988), the only way to produce a modulation of the X-ray flux from the wind-interaction zone would come from a change in the col-umn density along the line of sight as a function of the orbital phase. The resulting change in absorption would then mostly affect the soft part of the EPIC spectrum. Nevertheless, no significant change appears in the spectrum or in the absorption component of the model used to fit the data between the first and the second exposure. A second possible origin could be the putative wind-wind interaction due to the presence of the third star, if the system in indeed triple. The stellar wind of the third component is indeed likely to produce a second interaction zone by colliding with the winds of the stars of the close binary system. Finally, variability could possibly result from the eclipse of the O5-8V + O5-8V binary system. According to the ephemeris derived by Leitherer et al. (1987), the April obser-vation was performed between phases 0.64 and 0.69, and the September one between phases 0.04 and 0.12. As phase zero corresponds to the primary eclipse, we see that the September
XMM-Newton observation was performed when the primary
was partially hidden by the secondary, allowing us to possibly expect a lower X-ray flux than during the April observation when no eclipse occurred. However, the extrapolation of this ephemeris to the epoch of our observations must be considered with caution, especially for such a short period. To clarify this question, we investigated the X-ray variability of HD 167971 on the basis of the results of our two XMM-Newton obser-vations, along with a confrontation to archive data (see Sect. 4). Count rates of HD 167971 between 0.4 and 10.0 keV are presented in Table 4. Since CCD gaps (see Fig. 1) affect the area of the effective source region considered for the event se-lection, the variability between our two observations can not be discussed on the basis of count rates.
To obtain a more consistent, although model dependent way to quantify the X-ray emission, absorbed fluxes and fluxes
corrected for interstellar absorption were evaluated on the basis of the pure thermal model. The fluxes quoted in Table 2 give a rough idea of the behaviour of HD 167971 between April and September 2002. If we make the assumption that we can compare the fluxes obtained separately with the EPIC-MOS and EPIC-pn instruments, we observe a slight
decrease of the X-ray flux (∼ 12 %). However, we remind
that the error on the flux estimate is about 5 %, and that such a heterogeneous comparison may introduce another systematic error of a few percent. Therefore, the variability of HD 167971 between the two XMM-Newton observations is of rather low level. If this slight variation is real, it can be due to the eclipse occurring during the second observation as pointed out above. We note however that the decrease of the emission measure is observed mostly for the soft component in the case of the three-temperature model, whilst the case of V444 Cyg discussed by Pittard (2002) shows that the eclipse would indeed be expected to reduce mainly the flux in the hard part of the X-ray spectrum. A detailed modelling of the effect of the absorption by the winds, of the occultation of the colliding zone, and of the dynamic of the stellar winds including radiative inhibitaion effects is needed to investigate the effect of the eclipse on the observed X-ray spectrum.
The variability on shorter time scales was also investigated. Light curves were generated in different energy bands between 0.4 and 10.0 keV, with time bins ranging from 100 s to 1000 s. These light curves were background corrected, and each time bin accounts for Good Time Intervals (GTIs)2. Variability tests
(chi-square, pov-test3) were applied to all of them and no sig-nificant short term variability was found.
3.2.2. Overall luminosity
To obtain an estimate of the overall X-ray luminosity corrected for the ISM absorption, let us consider the model parameters obtained in the case of EPIC-MOS for the first observation, and EPIC-pn for the second one. This yields an LX of about
4.3× 1033and 3.8× 1033erg s−1respectively for the April and
September observations, for a distance of 2 kpc. According to the bolometric magnitudes given by van Genderen et al. (1988) for the three components of this presumably triple system, we can infer bolometric luminosities of 1.5× 1039erg s−1 for
each star of the close binary system, and 3.0× 1039erg s−1for
the third component. This yields a total bolometric luminos-ity of about 6.0× 1039erg s−1. Following the empirical
rela-tion given by Bergh ¨ofer et al. (1997) applied to the three mem-bers of the multiple system, we infer expected individual X-ray luminosities and add them to obtain a total X-X-ray luminos-ity of about 1.0× 1033erg s−1 corresponding to an expected LX/Lbolratio of about 1.7× 10⁻⁷. Following the X-ray
lumi-nosities derived hereabove, the observed LX/Lbol ratio goes
2
Even if no flare contaminated time interval was rejected, standard GTIs are anyway always applied to XMM-Newton data, and should be taken into account in every timing analysis.
3 See Sana et al. (2004) for a detailed discussion of this variability
test.
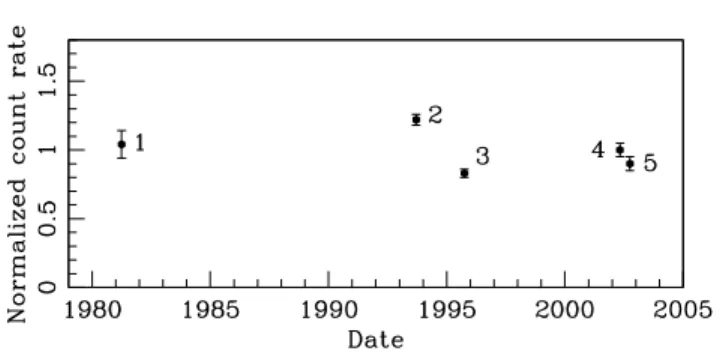
Fig. 5. Normalized equivalent X-ray count rates of HD 167971
arising from different observatories, as a function of time. 1: EINSTEIN-IPC, March 1981. 2: ROSAT-PSPC, September 1993. 3: ROSAT-HRI, September and October 1995. 4:
XMM-Newton-EPIC, April 2002. 5: XMM-XMM-Newton-EPIC, September
2002. We note that the ROSAT and EINSTEIN points are aver-aged values from several observations spread over a few hours to a few days.
from 7.2× 10⁻⁷ to 6.3× 10⁻⁷ respectively for the April and
the September XMM-Newton observations. These values yield X-ray luminosity excesses of about a factor 4.2 and 3.7 for both observations respectively. These values are significant consid-ering the scatter of the relation of Bergh ¨ofer et al. (1997), sug-gesting that HD 167971 is overluminous in X-rays.
4. Comparison with previous observations
HD 167971 was observed with the EINSTEIN satellite on 31 March 1981 (sequence number 4240, 5.22 ks). Chlebowski et al. (1989) reported an X-ray luminosity of 5.8× 1033erg s−1
for a 2 kpc distance. This value is slightly larger than our
XMM-Newton results. However, we compared the EINSTEIN results
to ours following a more model independent way. We passed
the model obtained in the case of the three thermal mekal
components through the EINSTEIN response matrix to obtain a simulated IPC spectrum. The model parameters are taken from the simultaneous EPIC-MOS fit for the April observation, and from EPIC-pn for the September one (see Table 2). Count rates were estimated between 0.2 and 3.5 keV (the energy range of the IPC instrument) on the basis of these simulated spectra, and we obtained 0.049± 0.001 cts s−1 and 0.047± 0.001 cts s−1
respectively for the April and the September 2002 exposures. These values are in excellent agreement with the count rate given by Chlebowski et al. (1989), i.e. 0.050± 0.005 cts s−1.
This result suggests that at the time of the EINSTEIN observa-tion, HD 167971 was in an emission state similar to our
XMM-Newton observations.
This target was also observed with ROSAT. A PSPC observation (rp500298n00, 9.29 ks, performed between 13 September and 15 September 1993) reports a count rate of 0.129± 0.004 cts s−1. By folding the three-temperature model
obtained for the fit of our EPIC data through the PSPC re-sponse matrix, we obtain 0.106± 0.002 cts s−1 and 0.103±
0.002 cts s−1 respectively for our two XMM-Newton
re-sults suggest that HD 167971 was in a higher emission state at the time of the ROSAT observation. The same procedure was applied in the case of a HRI observation performed between 12 September and 10 October 1995 (rh201995n00, 36.3 ks). The reported HRI count rate is 0.035± 0.001 cts s−1. The
re-sults we obtain by passing the model through the HRI response matrix are 0.042± 0.001 cts s−1and 0.041± 0.001 cts s−1
re-spectively for the April 2002 and the September 2002
XMM-Newton observations, suggesting that at the moment of the HRI
observation, HD 167971 was in an emission state somewhat lower than that observed with XMM-Newton.
In summary, these results from archive data and from our
XMM-Newton observations are plotted in Fig. 5. We note that
we do not expect any confusion with other X-ray sources to affect the archive count rates quoted in this section. The count rates are normalized relative to the XMM-Newton count rate of April 2002 arbitrarily set to unity. The normalized count rate of the September 2002 XMM-Newton observation is determined following the flux ratio observed between 0.4 and 10.0 keV for the three-temperature model. The error bars on the
XMM-Newton count rates are set to about 5 % in Fig. 4. We consider
that this value is more realistic than the standard deviations quoted in Table 4. We see that the X-ray flux of HD 167971 un-dergoes a significant variability with a peak to peak amplitude of about 40 %. However, we note that this apparent variabil-ity relies mostly on the position of the ROSAT-PSPC point in Fig. 5, as other count rates suggest a more or less constant level. Moreover, we want to draw attention to the fact that the overall shape of the light curve plotted in Fig. 5 is very similar to that presented in Fig. 9 of De Becker et al. (2004b) for HD 168112, even if the amplitude of the apparent variability was larger in that case. Consequently this apparent variability might be at-tributed to some systematic effects affecting the various obser-vations (common to HD 168112 and HD 167971) mentioned in this section. A detailed description of this behaviour requires a better data coverage than that available at the time of this study.
5. Discussion
5.1. Search for a colliding-wind signature
As HD 167971 is a multiple system whose components are O-stars, a wind-wind interaction is expected. Do our
XMM-Newton data reveal the signature of colliding winds? Several
questions should be considered to address this point:
- Plasma temperature. The results of the fittings with the three-temperature model point to a plasma temperature for the hardest component of about 2 – 4 keV, i.e. about 2.3× 10⁷to 4.6× 10⁷K. Such high temperatures are
usu-ally not expected for the emission from shocks due to in-trinsic wind instabilities, but are expected for shocks be-tween the winds within a binary system (see e.g. Stevens et al. 1992). These post-shock temperatures correspond to pre-shock velocities of about 1300 – 1800 km s−1,
typ-ical for winds colliding at speeds near the terminal ve-locity, as should be expected for long period wide bina-ries (Pittard & Stevens 1997). For short period binary
sys-tems like the O5-8V + O5-8V pair in HD 167971 (P ∼
3.32 d), the winds have not reached their terminal ve-locities before they collide, and the temperatures are not expected to be so high. Such systems yield typical tem-peratures of at most 1× 10⁷K. For instance, HD 159176
(O7V + O7V) with a period of 3.367 d displays tem-peratures of about 2× 10⁶ to 6× 10⁶K (De Becker et
al. 2004a), whilst the O7.5(f)III + O7.5(f)III close binary HD 152248 (5.816 d period) has plasma temperatures lower than 1× 10⁷K (Sana et al. 2004). So, if the high
tempera-tures we derived from our spectral fittings have a physi-cal meaning, they are most probably related to the interac-tion between the wind of the O8I component and the com-bined winds of the close O5-8V + O5-8V binary system. We note however that high plasma temperatures can arise in the winds of individual stars if the magnetic field of the star is able to confine the stellar wind near the magnetic equatorial plane (Babel & Montmerle 1997).
- X-ray luminosity. The luminosities we derived from our spectral fittings point to an excess attributable to a wind-wind interaction. This is compatible with a scenario where the colliding winds bring a significant contribution to the overall X-ray luminosity, in addition to the emission from the intrinsic shocks of the individual winds of the compo-nents of HD 167971.
- X-ray variability. As discussed in Section 3.2.1, the ques-tion of the variability of the X-ray flux is rather complex. We do not detect any strong variability in the X-ray flux between our two XMM-Newton observations. Only a slight decrease possibly due to the eclipse of the 8V + O5-8V close binary system is observed. However, our discus-sion of archive data reveals that HD 167971 possibly shows some variability, even if the data coverage is insufficient to constrain the time scale of this variability. If not due to some undetermined systematic effect (see last paragraph of Sect. 4), the amplitude of this apparent variability seems to be rather high (∼ 40 %). Even if there is no clear evidence
that the three stars are physically related, this variability might be compatible with what could be expected from a long period and eccentric binary system. The count rates from ROSAT and EINSTEIN result indeed from a combi-nation of several obervations spanning different phases of the orbit of the O5-8V + O5-8V binary system, and conse-quently are phase averaged values. Moreover, most of the count rates quoted in Fig. 5 point to a low level, although it is not reasonable to think that all the pointings except that of ROSAT-PSPC fall at the moment of an eclipse. For these reasons, we do not expect the eclipse of the close bi-nary system to be responsible for the variability illustrated in Fig. 5. However, considering the lack of reliability of this putative long term variability, we decided to attribute only little weight to this argument.
Regarding these results, we realize that we find a probable signature of a wind-wind collision. Some clues, like the high plasma temperature in the context of the thermal model, point to a possible detection of the interaction between the close sys-tem and the third more luminous companion. With the large separations characterizing this interaction, the shocks of the
collision zone are expected to be strongly adiabatic, resulting in a phase-locked X-ray variability scaling with 1/D, with D be-ing the distance from one of the two components to the inter-action zone (see Stevens et al. 1992; Pittard & Stevens 1997). According to this scenario, the X-ray emission should peak close to the periastron passage. Such a high temperature for the hard component of the spectrum, if it is thermal, was also reported in the case of HD 168112 which is possibly a wide and eccentric binary system (De Becker et al. 2004b; Blomme et al. 2005a). In the case of HD 167971, the X-ray luminosity excess attributed to the wind collision is much more significant. Quantifying the respective contributions from the two ex-pected collision zones is not an easy task. To address such an issue, an accurate knowledge of the stellar properties of the three stars along with a better idea of their relative posi-tions is needed. We can however tentatively adopt the following semi-quantitative approach. From Sect. 3.2.2, we can assume that the cumulated intrinsic contributions from the three stars is about 1033erg s−1. As the overluminosity factor is about 4,
the X-rays arising from the collision zone(s) amount to about 3× 1033erg s−1. On the other hand, for the O7V + O7V close
binary system HD 159176 (De Becker et al. 2004a) rather simi-lar to the eclipsing binary harboured by HD 1679714, the same
considerations lead to an X-ray luminosity for the collision zone of about 1.3× 1033erg s−1. If the O5-8V + O5-8V
bi-nary within HD 167971 produces the same amount of X-rays, we estimate that the putative collision zone due to the third companion may produce more than twice as much X-rays as that of the close eclipsing binary. We mention however that the highest temperature component of the thermal model used to fit the EPIC spectra accounts for only about 10 % of this quantity, suggesting that the softest components account significantly for the putative wind-wind collision with the third star.
5.2. Non-thermal emission from HD 167971
In the radio domain, the non-thermal nature of the emis-sion from HD 167971 is well established (Bieging et al. 1989; Blomme et al. 2005b). The high non-thermal radio flux sug-gests that it comes from the interaction between the close eclipsing binary and the third star. However, in the X-ray do-main, the nature of the hard component of the spectrum is still unclear. As discussed in Sect. 3.1, the pure thermal model and that including the power law yield results of similar quality. This ambiguity is a common feature in the study of X-ray spec-tra of massive stars (see e.g. De Becker 2001; Rauw et al. 2002; De Becker et al. 2004b). If we make the assumption that a non-thermal emission component is responsible for the hard part of the spectrum of HD 167971, we obtain photon index values close to 3, which is rather steep as compared to the value, i.e. 1.5, considered by Chen & White (1991) for X-rays produced through Inverse Compton scattering from relativistic electrons accelerated in strong shocks. For a discussion of such high val-ues of the photon index, we refer to De Becker et al. (2004b).
4
The bolometric luminosity provided by van Genderen et al. (1988) for the latter stars is intermediate between those given by Howarth & Prinja (1989) for the O5.5V and O6V spectral types.
5.3. Comparison with other early-type stars
Up to now, our campaign devoted to non-thermal radio emit-ters includes the observations of three targets: 9 Sgr (Rauw et al. 2004), HD 168112 (De Becker et al. 2004b), and HD 167971 (this study). The next targets of this campaign are the non-thermal radio emitters of the Cyg OB2 association (#8A, #9 and #5, see e.g. Waldron et al. 1998). Forthcoming studies based on
XMM-Newton and INTEGRAL observations of these stars will
bring new elements to the overall discussion of the high energy emission from massive stars. For instance, Cyg OB2 #8A is a well known non-thermal radio emitter that has recently been identified as a binary system by De Becker et al. (2004c), lend-ing further support to the scenario where binarity is a neces-sary condition to observe non-thermal emission from massive stars. This idea is also supported by the results of Benaglia & Koribalski (2005) who discuss the case of four southern non-thermal radio emitters, among which three are confirmed bi-nary systems. The need for a bibi-nary scenario to explain the non-thermal radio emission has independently been demonstrated by Van Loo (2005) following a theoretical approach. Several works has recently been devoted to the non-thermal radio emis-sion from massive binaries (Dougherty et al. 2003; Pittard et al. 2005). These recent models take into account several phys-ical effects likely to affect the observed synchrotron spectrum (Razin effect, free-free absorption, IC cooling). Future devel-opments of these models are expected to lead to an estimate of the non-thermal high-energy emission from massive binaries.
At this stage, it could be interesting to confront the results obtained in the case of the first three targets studied in this cam-paign. The summary of the results arising from these studies is provided in Table 5. For these three objects, our analyses did not reveal any unambiguous power-law emission component in the X-ray spectra. A striking characteristic of their X-ray spec-tra is that the fit with thermal models reveals a rather hard emis-sion, with plasma temperatures of a few 107K. HD 167971 is
a known multiple system and such high plasma temperature could be explained by a wind-wind interaction. HD 168112 is not known to be a binary system, but was proposed to be a binary candidate by De Becker et al. (2004b). The results of the study of Blomme et al. (2005a) lend further support to this idea, suggesting a period of about 1.4 yr based on archival ra-dio and X-ray data, even if no unambiguous evidence of bi-narity has been found in the optical domain. In the case of 9 Sgr, low amplitude radial velocity variations in the optical spectrum suggest it is a binary with a yet undetermined period (Rauw et al. 2002). If the high plasma temperatures observed for these three stars are indeed due to wind collisions within binary systems, the observed post-shock temperatures are re-lated to rather high pre-shock wind velocities (typically at least
∼ 1000 km s−1). Such high velocities can only be achieved in
binary systems where the winds collide after they have reached their terminal velocity, i.e. in systems with periods exceeding several days. In this scenario, the non-thermal radio emission is produced by a population of relativistic electrons accelerated in the shock due to the same wind-wind interaction. The pu-tative non-thermal X-ray counterpart to this non-thermal radio emission has little chance to be detected, as it would probably
Table 5. Comparison of the cases of 9 Sgr (Rauw et al. 2004), HD 168112 (De Becker et al. 2004b), HD 167971 (this study), and
HD 159176 (De Becker et al. 2004a). The question marks for the multiplicity and the period stem from the fact that these are not well established.
9 Sgr HD 168112 HD 167971 HD 159176
Multiplicity binary ? binary ? triple binary
Period long period ? long period (1.4 yr) ? 3.3213 d 3.367 d
+ long period
Thermal X-rays soft + hard soft + hard soft + hard soft
Hard X-rays ambiguous most probably ambiguous possible power
thermal law tail
Synchrotron radio emission yes yes yes no
be overwhelmed by the hard thermal component produced by the wind collision. If on the contrary the period were shorter, the pre-shock velocities would be lower and the X-ray thermal emission would be softer, allowing consequently the putative non-thermal X-ray emission to be detected in the hard part of the spectrum. However, the shorter orbital period required to possibly observe the non-thermal X-ray emission could cause the wind collision zone to be deeply embedded in the stellar wind material, thereby leading to a severe absorption of the synchrotron radio emission.
The fact that the conditions for detecting a non-thermal emission in the radio domain may be different from those for such a detection in the X-rays raises an interesting question. We may indeed wonder whether non-thermal radio emitters are ideal candidates to search for a non-thermal X-ray counterpart. To address this issue, let us consider some results obtained for other massive stars recently observed in the X-ray domain.
In the case of the short period massive binary HD 159176 (OV7 + OV7), a high energy tail is observed in the X-ray spectrum. It can not be fitted with a thermal model5, but can be approximated with a power law (De Becker et al. 2004a). For that system, the typical temperature of the X-ray emitting plasma is sufficiently low to prevent the putative power law tail to be overwhelmed by the thermal X-rays from the collid-ing wind zone. This is due to the fact that the winds collide as they have not reached their terminal velocities. The non-detection of HD 159176 (Bieging et al. 1989) in the radio do-main is compatible with the rather low flux expected for purely thermal radio emitters, and can be explained by the fact that any putative synchrotron emitting zone would be deeply em-bedded within the stellar winds. We mention also the case of WR 110 (HD 165688) whose binarity has not yet been estab-lished. Skinner et al. (2002) reported a soft thermal X-ray spec-trum, along with a high energy power law tail, whilst its radio spectrum is purely thermal.
Considering these recent results, we propose that the non-thermal radio emission could ideally be detected in the case of binaries with periods larger than several weeks. For instance, the shortest period well-established non-thermal radio emitter is Cyg OB2 #8A, with an orbital period of about 21.9 d (De Becker et al. 2004c). On the other hand, short period binaries 5 Optically thin plasma model (Mewe et al. 1985; Kaastra 1992) or
colliding wind model (Antokhin et al. 2004).
are not expected to display a non-thermal radio emission be-cause of the strong absorption by the wind material. However, their rather soft thermal X-ray emission could possibly unveil a power law component produced by inverse Compton scatter-ing of UV photons. Moreover, the less diluted UV radiation field in the shock region of close binary systems is expected to lead to the production of a higher non-thermal X-ray flux, favoring its detection. In the context of this scenario, the si-multaneous observation of non-thermal radiation in the X-ray (below 10.0 keV) and radio domains appears rather unlikely.
6. Other X-ray sources in the field of view
6.1. Source list
Beside HD 167971 discussed in the previous sections, and HD168112 (De Becker et al. 2004b), other fainter X-ray sources are observed in the field of the EPIC cameras. To inves-tigate the X-ray emission from these sources, we processed our data with the version 6.0.0 of the Science Analysis Software (SAS) to benefit from the latest version of the edetect chain metatask. We filtered the event lists of the April observation to reject the end of the exposure contaminated by a soft proton flare (see Sect. 3.1 of De Becker et al. 2004b), thereby reducing the effective exposure time to about 9 and 6 ks for EPIC-MOS and EPIC-pn respectively. Adding together the two observa-tions and considering that EPIC-pn is about twice as sensitive as EPIC-MOS, we obtain an EPIC-MOS equivalent combined exposure time of about 80 ks on NGC 6604.
We first applied the source detection simultaneously to the data from the three EPIC instruments of our two observations to improve the detection efficiency. We used three energy bands respectively refered to as S (0.5–1.0 keV), M (1.0-2.5 keV), and
H (2.5-10.0 keV). The images in these three energy bands were
extracted on the basis of the merged event lists of the two servations, for the three EPIC instruments respectively. We ob-tained a first source list using a detection likelihood threshold of 40. We then inspected each source of the list by eye to reject false detections due to background fluctuations and instrumen-tal artifacts following the same approach as Rauw et al. (2003) and Naz´e et al. (2004). Adopting the formalism described by Sana et al. (2005), we determined the likelihood thresholds ad-equate for individual datasets. The likelihood thresholds we finally adopted are 40 for the combined EPIC data sets, 40
See GIF figure (fig6.gif)
Fig. 6. Image of the NGC 6604 open cluster from the combined EPIC data sets of the two observations. The X-ray sources listed
in Table 6 are labelled. The pixel size is 2.5′′. The right ascension is increasing from the right to the left, and the declination is
increasing from the bottom to the top. The width of the field is about 30′.
for combined EPIC-MOS, 10 for individual EPIC-MOS, and 10 for EPIC-pn. After applying the same procedure to data sets resulting from individual instruments and/or observations, we added a few more sources to the list obtained for the full combined data set. We finally obtain a catalogue of 31 X-ray sources presented in Table 6 by order of increasing right ascen-sion. The position of these sources in the EPIC field is shown in Fig. 6. All sources are identified following the naming con-ventions recommended by the XMM SOC and the IAU.
6.2. Source identification
The position of the 31 X-ray sources were cross-correlated with three catalogues: the Guide Star Catalogue (GSC, version 2.2)6, the Two Micron All Sky Survey (2MASS, Skrutskie et al. 1997), and the US Naval Observatory (USNO-B1.0, Monet et al. 2003). We derived the optimal correlation radius follow-ing the procedure described by Jeffries et al. (1997). In this 6 The Guide Star Catalogue-II is a joint project of the Space
Telescope Institute and the Osservatorio Astronomico di Torino.
way, we find that a cross-correlation radius of 4.5 arcsec in-cludes the majority of the true correlations while rejecting most of the spurious correlations. With a radius of 4.5 arcsec we ex-pect to achieve at least 23 true and only about 2 spurious cor-relations. We also assume that the position of the source on the detector has little impact on the correlation radius. We should however keep in mind that this assumption is mostly valid close to the center of the field for a given instrument, but could pos-sibly bias our source identification procedure for large off-axis angles.
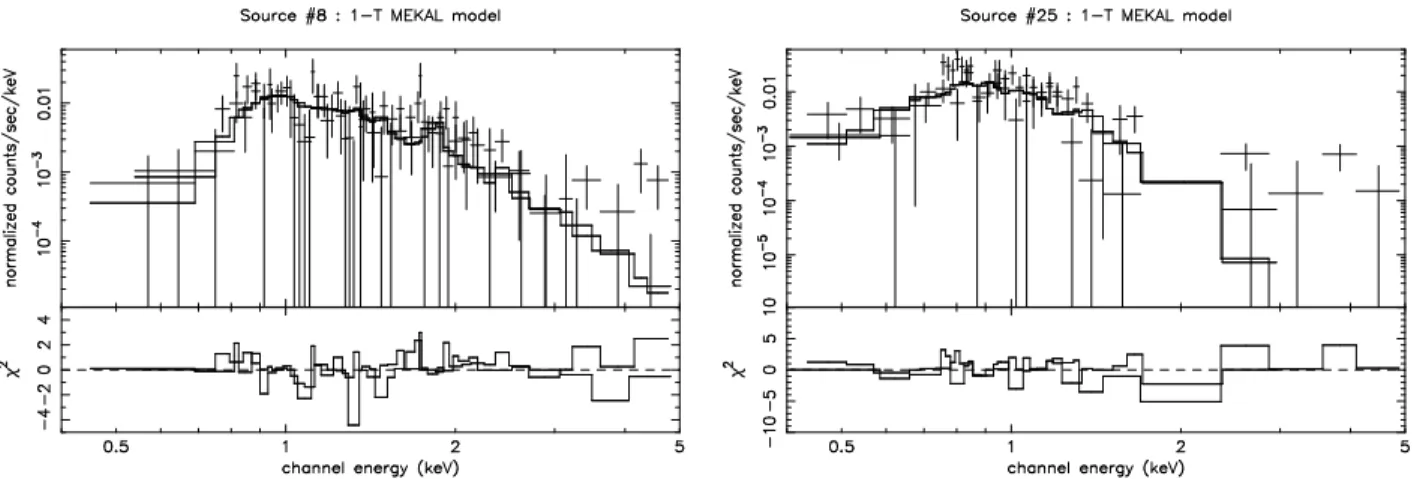
Among the 31 X-ray sources quoted in Table 6, five sources (#12, #13, #14, #16 and #25) have neither a GSC, 2MASS nor USNO counterpart. 20 (respectively 23) have at least one optical counterpart in the GSC (resp. USNO) catalogue, and some sources have possibly two optical (#20, #27 and #29) counterparts. No other positive correlations were found with the sources included in the photometric survey of Forbes & DuPuy (1978) within a 10 arcsec radius. A total of 18 EPIC sources in the field of view of NGC 6604 have a single 2MASS counterpart while another 6 sources have two infrared coun-terparts. In Fig. 8, we show the JHK colour-colour diagram
1 2 M .D e B ec k er et al .: A n X M M -N ew to n o b se rv at io n o f N G C 6 6 0 4
source, and the 30 next ones as point sources. The count rates corrected for the exposure map are quoted for all three EPIC instruments. The missing values are due to a strong deviation from those of the other instruments because of CCD gaps. The hardness ratios are given for EPIC-pn only. The quoted counterparts are located within 4.5′′of the
X-ray sources. Nr is the number of counterparts within the correlation radius, andd is the angular separation between the X-ray source and its nearest counterpart. The error
bars on the count rate represent the± 1 σ Poissonian standard deviation.
# XMMU MOS1 CR MOS2 CR pn CR H R1 H R2 GSC 2.2 2MASS USNO B1.0
10−3cts s−1 10−3cts s−1 10−3cts s−1 Nr d(”) Cat. id. R B V Nr d(”) J H KS Nr d(”) Cat. id.
(1) (2) (3) (4) (5) (6) (7) (8) (9) (10) (11) (12) (13) (14) (15) (16) (17) (18) (19) (20) (21) 1 J181731.4–120622.2a 311.0±15.3 0.34±0.05 –0.67±0.05 1 4.4 S3001223315 10.6 9.7 1 4.5 7.3 7.1 6.9 1 4.4 0778-0542759 2 J181746.1–120542.3 6.1±1.0 5.8±1.0 13.1±1.9 0.55±0.14 –0.17±0.16 1 2.0 S300122014588 17.9 2 1.9 15.0 13.9 12.6 1 2.3 0779-0530036 2.8 14.7 13.8 12.2 3 J181750.7–120400.4 4.4±1.0 2.6±0.9 12.1±1.9 0.51±0.14 –0.62±0.20 1 2.2 S3001220900 13.0 14.4 13.3 1 1.5 11.4 11.1 10.9 1 1.9 0779-0530128 4 J181750.7–120506.3 3.5±0.8 4.2±0.8∗ 11.8±1.8 0.30±0.14 –0.47±0.22 1 1.7 S300122015025 15.7 18.7 16.3 1 1.4 13.4 12.6 12.4 1 2.3 0779-0530127 5 J181806.0–121433.8b 231.4±4.4∗ 229.6±4.1∗ 673.3±8.3∗ 0.23±0.01∗ –0.75±0.01∗ 1 1.6 S30012201153 8.3 7.6 1 1.6 5.5 5.3 5.1 1 1.6 0777-0543906 6 J181808.4–120824.9 1.3±0.4 1.2±0.4 5.7±0.9 0.51±0.31 0.42±0.15 1 2.6 S300122012953 17.9 1 2.2 15.6 15.2 14.7 0 7 J181808.6–120851.2 2.6±0.5 2.1±0.4 3.6±0.8∗ 1.00±0.43∗ 0.53±0.20∗ 0 1 2.6 15.2 13.8 13.4 1 3.2 0778-0543325 8 J181810.0–121048.5c 12.5±0.8 13.1±0.9 36.6±1.9∗ 0.38±0.05∗ –0.80±0.05∗ 1 2.1 S3001220165 10.0 9.3 1 2.2 7.7 7.5 7.4 1 2.1 0778-0543346 9 J181810.6–120409.3 2.1±0.5 2.8±0.6 7.7±1.2 0.75±0.16 –0.16±0.17 1 1.8 S300122015589 14.3 16.8 15.3 1 1.5 11.3 10.2 9.4 1 1.5 0779-0530455 10 J181813.1–121503.1 4.6±0.7 4.2±0.7 3.8±0.9 0.89±0.16 –0.82±0.23 1 4.4 S30012209459 17.5 1 3.3 15.3 14.4 14.3 1 3.5 0777-0544085 11 J181815.3–121148.7 4.6±0.6 4.5±0.6 13.4±1.2 0.72±0.08 –0.13±0.09 1 1.2 S300122011032 18.5 1 1.3 15.2 14.2 14.0 0 12 J181815.7–120842.8 1.2±0.4 1.5±0.4 2.6±0.7 1.00±0.31 0.34±0.24 0 0 0 13 J181816.9–121617.4 3.3±0.6 1.2±0.5 3.7±0.9∗ 1.00±0.39∗ 0.08±0.27∗ 0 0 0 14 J181819.3–121616.9 5.4±0.8 3.6±0.6 13.3±1.7∗ 0.54±0.12∗ –0.41±0.14∗ 0 0 0 15 J181820.5–121736.3 1.7±0.5 0.6±0.3 4.2±0.9 1.00±0.12 0.16±0.21 0 0 1 1.1 0777-0544362 16 J181822.6–121503.4 7.3±0.8 6.6±0.7 15.2±1.5∗ 0.85±0.17∗ 0.45±0.08∗ 0 0 0 17 J181823.2–120719.4 1.1±0.4 2.2±0.4 4.1±0.8 0.38±0.33 0.42±0.18 0 0 1 2.5 0778-0543806 18 J181827.3–120613.4 3.0±0.5 3.5±0.5∗ 11.9±1.2 0.45±0.09 –0.67±0.11 1 0.9 S300122014289 18.1 1 0.1 15.2 14.1 13.8 1 0.2 0778-0544019 19 J181830.3–121359.1 4.1±0.5 3.5±0.5 10.4±1.0 0.61±0.08 –0.37±0.11 1 1.6 S30012209935 17.2 1 1.6 15.2 14.3 14.0 1 1.6 0777-0545005 20 J181832.0–121740.3 1.6±0.5 1.4±0.5∗ 4.3±1.0 0.60±0.20 –0.60±0.27 1 2.4 S30012208102 15.2 18.9 17.7 2 1.4 13.8 12.9 13.3 2 2.3 0777-0545104 2.8 13.5 12.6 13.1 2.9 0777-0545111 21 J181832.1–121605.0 3.5±0.6 2.4±0.6∗ 7.6±1.1 0.54±0.12 –0.51±0.16 1 3.5 S300122028708 18.4 2 2.6 14.7 13.8 13.5 1 3.3 0777-0545106 4.0 14.2 13.2 12.8 22 J181837.1–120601.7 1.6±0.4 1.3±0.4 8.1±1.0∗ 0.09±0.12∗ –1.00±0.10∗ 1 2.6 S300122014474 14.1 16.2 15.6 1 1.5 13.5 12.9 12.9 1 2.8 0779-0531112 23 J181839.5–120935.3 1.3±0.3 1.3±3.3 5.2±0.9∗ 0.60±0.16∗ –0.30±0.19∗ 1 3.8 S30012201041 13.5 14.5 13.8 2 1.6 14.2 13.0 12.3 1 3.5 0778-0544645 4.0 12.5 12.2 12.1 24 J181840.9–120623.7d 55.3±1.8 59.2±1.9 1 0.6 S3001220959 9.2 8.6 1 0.6 6.9 6.7 6.6 1 0.6 0778-0544725 25 J181844.3–120752.3 12.1±0.9 13.5±0.9 45.6±1.9 –0.37±0.04 –0.89±0.06 0 0 0 26 J181901.2–120050.8 4.6±0.9 3.9±0.8 16.4±2.2 0.76±0.12 –0.06±0.14 1 1.0 S300122017698 15.2 18.5 16.6 1 1.2 12.0 11.0 10.5 1 1.0 0779-0532345 27 J181903.0–120638.4 4.3±0.8 3.2±0.6 12.2±1.5 –0.26±0.11 –0.70±0.27 2 2.3 S3001220971 10.5 9.8 2 2.4 8.3 8.1 8.0 1 2.3 0778-0546021 3.4 S300122014341 12.0 4.2 13.8 12.9 12.7 28 J181904.9–120918.7e 2.8±0.6 7.3±1.3∗ 1.00±0.18∗ 0.54±0.13∗ 0 1 2.0 14.2 13.1 12.8 0 29 J181905.2–120306.5 2.9±0.7 5.1±0.9 9.1±1.7 0.99±0.09 –0.07±0.18 0 2 0.9 15.0 14.0 13.5 2 1.1 0779-0532614 3.8 15.3 14.3 14.0 2.6 0779-0532625 30 J181906.8–121018.2 5.4±0.9 7.0±0.9 18.0±1.9∗ 0.60±0.19∗ 0.60±0.08∗ 0 1 4.5 15.4 14.6 14.1 1 3.0 0778-0546278 31 J181909.9–121753.4 5.7±1.1 8.2±1.3 12.8±2.1 1.00±0.05 –0.23±0.17 1 1.0 S300122028430 17.3 1 1.3 15.1 14.2 13.9 1 1.1 0777-0547481 a
This X-ray source is associated to the O6V((f)) star HD 167834 (BD -12◦4969). We quote the count rates obtained as an extended source detection. The X-ray properties quoted are from EPIC-pn data of the April observation only, as this source was not in the field of the other data sets.
b
HD 167971. The large difference between the count rates quoted for this star in this table and the observed ones given in Table 4 are explained by the exposure map correction applied during the source detection procedure.
c
BD -12◦4982 (O9.5I or III, see text).
d
HD 168112 : the EPIC-pn count rate is not quoted as a CCD gap crosses the sources region. The analysis described by De Becker et al. (2004b) was performed with different screening criteria than for the current analysis to deal with the EPIC-pn data.
e
We note that even if no optical counterpart was found in the catalogues used for the correlation, a star appears clearly on the DSS image centered on this position.
∗
Fig. 7. Optical normalized spectra obtained between 4000 and 4900 ˚A respectively for the sources #1 (HD 167834, top spectrum) and #8 (BD -12◦4982, bottom spectrum).
of those objects that have quality flags A or B for the mea-surements of all three individual near-IR magnitudes. We used the March 2003 update of the colour transformations, initially derived by Carpenter (2001) and available on the 2MASS web-site7, to convert theJ − H and H − K
s colours to the
ho-mogenized photometric system introduced by Bessell & Brett (1988). We thus exclude all objects that have colours and mag-nitudes that are either subject to large uncertainties or are only upper limits due to non-detections. Using the extinction law of
Rieke & Lebofsky (1985) and assumingRV = AV/E(B −
V ) = 3.1 (Barbon et al. 2000), we also show the reddening
vector forE(B − V ) = 1.02 as was found to be appropriate
for NGC 6604 (Barbon et al. 2000).
There are three broad groups that appear in Fig. 8. The first group consists of five sources that are clearly associated with early-type stars: #1 (HD 167834), #5 (HD 167971), #8
(BD−12◦4982), #24 (HD 168112) and #27 (BD−12◦4994).
In the second group, we find objects aroundH − K ∼ 0.3
and J − H ∼ 1.0. These objects have colours that are
consistent with slightly reddened late type (early G to late K) main-sequence or giant stars. Finally, a small group of objects (#9, #26 and one of the two counterparts of the three
sources #21, #23 and #29) have H − K > 0.4. Assuming
that they are affected by the same reddening as NGC 6608 (E(B − V ) = 1.02), these objects would be associated with
very late (mostly late M) main sequence stars. If these sources were normal main sequence stars belonging to NGC 6604, it seems rather unlikely that we would be able to detect their X-ray emission. An alternative possibility could be that they are X-ray bright pre-main sequence stars with a moderate IR
7
http://www.ipac.caltech.edu/2mass/index.html
excess. In fact, their dereddened infrared colours are in broad agreement with the intrinsic colours of classical T Tauri stars (Meyer et al. 1997).
Of course, a fraction of the X-ray selected objects might in fact be foreground stars or background sources. NGC 6604 (lII = 18.26◦,bII = 1.69◦) lies very close to the Galactic
plane and the total Galactic neutral hydrogen column density along this direction must therefore be quite large. This should produce a substantial absorption of X-ray photons from extra-galactic background sources. Because of the Galactic coordi-nates of NGC 6604, estimating this column density accurately is a very difficult task. For instance, the DIRBE/IRAS extinc-tion maps provided by Schlegel et al. (1998) yield a good es-timate of the total Galactic E(B − V ) at Galactic latitudes
above|bII| ≥ 5◦, but are subject to very large uncertainties near
the Galactic plane. With these limitations in mind, the maps of Schlegel et al. (1998) suggestE(B − V ) ∼ 3.5 ± 0.5 for
NGC 6604 (corresponding toNH∼ 2×1022cm−2). Assuming
that extragalactic background sources have a power-law spec-trum with a photon index of 1.4, and are subject to a total in-terstellar absorption of2 × 1022cm−2, the detection limits∼ 4.0×10⁻³and1.5×10−3cts s−1for the pn and MOS detectors
translate into unabsorbed fluxes of2.1 × 10−14erg cm−2s−1
and6.0 × 10−14erg cm−2s−1 in the 0.5 – 2.0 keV and 2.0 –
10 keV band respectively. From the log N – log S relation of
Giacconi et al. (2001), we would expect to first order to de-tect around 8 – 10 extragalactic sources over the EPIC field of view. We emphasize that these objects should be detected as rather hard sources. Hence, several of the hard sources quoted
Fig. 8. JHK colour-colour diagram of the 2MASS
counter-parts of the X-ray sources in the EPIC field of view around NGC 6604. The heavy solid line yields the intrinsic near-IR colours of main sequence stars following Bessell & Brett (1988), whereas the reddening vector is illustrated forAV = 3.16. Open circles and triangles stand for EPIC sources having
respectivley a single or two 2MASS counterpart(s). The dotted straight line yields the locus of dereddened colours of classical T Tauri stars according to Meyer et al. (1997).
in Table 6 that lack an optical counterpart may actually be as-sociated with AGN.
Optical spectra of the counterparts of EPIC sources #1, #8 and #14 were obtained on June 22, 2004 with the EMMI in-strument mounted on ESO’s 3.5 m New Technology Telescope (NTT) at La Silla. The EMMI instrument was used in the RILD low dispersion spectroscopic mode with grism # 5 (600 grooves mm−1) providing a wavelength coverage from about
3800 to 7020 ˚A with a spectral resolution of 5.0 ˚A (FWHMof the He-Ar lines). The slit width was set to 1 arcsec and the ex-posure times were 1 min for the two bright sources #1 and #4, and 40 min for the counterpart of source #14. The data were reduced in the standard way using thelongcontext of theMI
-DASpackage.
The optical spectrum of source #1 (HD 167834) is given in the top part of Fig. 7. We obtain equivalent widths (EW) of 0.36 and 0.69 ˚A respectively for the HeIλ 4471 and HeIIλ 4542
lines. We estimate that the typical error on the estimate of EWs is about 5-10 %. According to the classification criterion given by Mathys (1988), and considering that the NIIIλλ 4634-41
lines are in emission and the HeIIλ 4686 line is in strong
ab-sorption, we derive an O6V((f)) spectral type. We note also that the CIIIλ 5696 line is in weak emission. In the case of source
#8 (BD -12◦4982, bottom spectrum of Fig. 7), the ratio of the
EW of the HeIλ 4471 and HeIIλ 4542 lines leads to an O9.5
spectral type. This spectral type is in excellent agreement with that given by Barbon et al. (2000, their source #32). Following
the EWs of the HeIλ 4388 line (0.36 ˚A ) and of the HeIIλ
4686 line (0.31 ˚A ), we derive a supergiant luminosity class, whilst the EWs of the SiIV λ 4088 line (0.54 ˚A ) and of the HeIλ 4143 line (0.29 ˚A ) point to a giant luminosity class. We note however that the spectrum of this star is very similar to that of the O9.7Iab starµ Nor (HD 149038) given by Walborn
& Fitzpatrick (1990). Finally, for the source #14, possibly as-sociated to Cl* NGC 6604 FD 61 (following the nomenclature proposed by Forbes & DuPuy 1978) even if no optical counter-part is quoted in Table 6, we derive a G6 spectral type, with an uncertainty of about 2 spectral types. We note that this optical counterpart is however located at about 6 arcsec of the X-ray source #14. Two possible 2MASS infrared counterparts are ap-proximately located at the position, but the precision of their photometry is very poor.
Fig. 9. EPIC-pn spectrum of source #1
(HD 167834) obtained in April 2002, fitted with a
wabsISM*wind*(mekal+mekal) model. The ISM absorption column was frozen at 0.73× 1022cm−2
6.3. X-ray properties
Using the count rates obtained in the three energy bands men-tioned in Sect. 6.1, we obtained hardness ratios (see columns 6 and 7 of Table 6) defined respectively as
HR1= M − S M + S HR2= H − M H + M.
We find that some sources present rather extreme hardness ra-tios, suggesting very hard X-ray spectra. Sources #7, #12, #13, #15, #28, #29 and #31 haveHR1 values larger than 0.90 as
shown in column 6 of Table 6 for EPIC-pn. We note that high hardness ratios are also obtained from EPIC-MOS instruments for these sources. Some of these sources may be extragalctic sources as discussed above.
We selected the brightest sources, and performed a spec-tral analysis of our EPIC data from the April and September observations.