HAL Id: hal-01739926
https://hal-univ-rennes1.archives-ouvertes.fr/hal-01739926
Submitted on 21 Jan 2021
HAL is a multi-disciplinary open access
archive for the deposit and dissemination of sci-entific research documents, whether they are pub-lished or not. The documents may come from teaching and research institutions in France or abroad, or from public or private research centers.
L’archive ouverte pluridisciplinaire HAL, est destinée au dépôt et à la diffusion de documents scientifiques de niveau recherche, publiés ou non, émanant des établissements d’enseignement et de recherche français ou étrangers, des laboratoires publics ou privés.
Stratified spherical model for microwave imaging of the
brain Analysis and experimental validation of
transmitted power
M. Bjelogrlic, M. Volery, Benjamin Fuchs, J.-P. Thiran, J.R. Mosig, M. Mattes
To cite this version:
M. Bjelogrlic, M. Volery, Benjamin Fuchs, J.-P. Thiran, J.R. Mosig, et al.. Stratified spherical model for microwave imaging of the brain Analysis and experimental validation of transmitted power. Mi-crowave and Optical Technology Letters, Wiley, 2018, 60 (4), pp.1042-1048. �10.1002/mop.31101�. �hal-01739926�
1
Stratified Spherical Model for Microwave Imaging of the Brain: Analysis and
Experimental Validation of Transmitted Power
Mina Bjelogrlic, Maxime Volery, Benjamin Fuchs, Jean-Philippe Thiran, Juan R. Mosig, and Michael Mattes
Abstract—This work presents the analysis of power transmission of a radiating field inside the human head for microwave imaging applications. For this purpose, a spherical layered model composed of dispersive biological tissues is investigated in the range of [0.5-4] GHz and is confronted to experimental verification.
Index Terms—Microwave Imaging, bio-medical applications, spherical wave expansion, 3D printed head
phantom.
I. INTRODUCTION
Microwave Imaging (MWI) [1] for bio-medical applications aims at localizing and reconstructing a
pathological tissue region from scattered microwaves. In the framework of head MWI this non-invasive,
non-ionizing technique is suitable to monitor brain anomalies such as brain stroke [2], internal bleeding, etc.
Several main factors influence the quality of the MWI: the scattered power, the frequency and the medium
in which the test object is immersed, called the matching or the background medium. The frequency is an
essential parameter since all biological tissues are dispersive and the losses increase exponentially according
to it.
Another important parameter is the spatial resolution of MWI which has a lower bound defined by the far
field and only depends on the wavelength in the background medium. Devaney [3] first suggested that this
limit of resolution was about 𝜆 √2
⁄ , then Bolomey and Pichot [4] estimated it to 𝜆 2⁄ . Chen and Chew [5] experimentally observed a resolution up to 𝜆 4⁄ , for high contrast, but non-dispersive and lossy objects,
2 which is a so-called super-resolution behavior, exploiting the near field and non-linear reconstruction
algorithms. Meaney et al. [6] have suggested that image reconstruction “is fundamentally unlimited by wavelength” and “is restricted by signal-to-noise” ratio. The latter papers have been experimentally
discussed by Semenov [7] and tested for the detection of myocardial ischemia and infarction. They
concluded that the resolution lies between a quarter and a half of a wavelength in the background medium.
Several groups have developed complex imaging setups and algorithms for imaging brain anomalies [8] [9]
[10] [11]. Experimental phantoms for the head have been developed, the most complex one using molded
semi-rigid parts assembled inside an outer solid cavity [12]. The complex molding procedure and the high
number of used ingredients makes this approach precise, however not easily repeatable. Moreover, the skin is not represented realistically as it is included in the fat/bone layer printed in a plastic material with
dielectric constant of 6 at 2 GHz [13]. These models are very useful to realistically simulate the dielectric
properties inside the brain itself and are used for imaging [9]. To validate numerical models, interesting
works have been done in the microwave imaging community with a 3D printed breast phantoms [17] [18]
with Triton X-100 based mixtures to mimic biological tissues. In the 7T MRI community 3D printed liquid
phantoms [19] are also used as they are easy to handle and transportable. A similar approach is followed
here, to our best knowledge, for the first time in the framework of MWI of the brain, and a first attempt of
using this simple, repeatable and over time stable procedure was published recently in [20].
In [14] guidelines to design an optimal MWI setup and to properly set the working frequency and the
matching medium, needed to facilitate the penetration of the probing wave into the head, are determined
using a plane wave Transmission Line (TL) model since it allows a simple analysis. On the other hand, a
multilayered spherical model better approximates the head geometry while still allowing an analytical
solution to the electromagnetic scattering problem [15] [16].
This paper focuses on the analysis of the power transmission through the four main layers between the brain
and the background medium, namely the Cerebrospinal Fluid (CSF), the bone, the fat and the skin. These
3 to the frequency. For this, a spherically stratified head phantom has been built to experimentally estimate
the power transmitted into the brain and to analyze the influence of these layers on the propagation of the
EM wave.
II. MODEL AND ELECTROMAGNETIC ANALYSIS
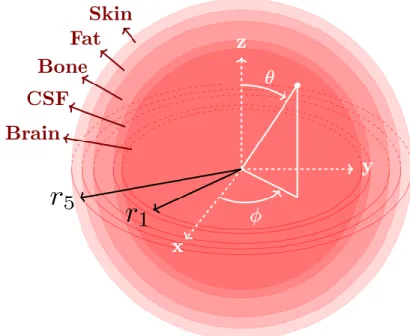
Figure 1: Spherical multilayered model to analyze the power transmitted into the human head.
The spherically stratified model, sketched in Fig. 1 (right), is a more realistic model of the human head than
the planar model in [14] while still allowing an analytic solution for the electric field distribution. The core of the sphere is the brain with a radius of 𝑟1= 43mm, the 𝑗𝑡ℎ layer (the core is the 1𝑠𝑡 layer) is given by 𝑟 ∈ [𝑟𝑗−1, 𝑟𝑗], 𝑗 = 2,3,4,5, and represents, respectively, the CSF (3mm), the cortical bone (7mm) (denoted here bone), the fat (4mm), the skin (4mm) and the matching medium (see Fig. 1). In [19] for 7T MRI the
Larmor frequency is around 300MHz and the brain region is modeled as a combination of CSF, grey matter,
and white matter. Since we deal with higher frequencies and, thus, shorter wavelengths, we model the CSF
4 ratio) of 1.5 as shown in [21]. A similar ratio was used in [20], as the dielectric properties of the latter two
are similar in the frequency range of interest.
Due to the spherical geometry of the boundary conditions, the electric field can be expanded as an infinite
sum of vector spherical harmonics and be expressed analytically. Reference [22] provides a review on the
governing equations of the spherical wave expansion used to solve this problem, and gives a detailed
analysis and validations of the implementation. These results are valid for a plane wave impinging on the
head phantom. This needs to be taken into account when comparing theoretical and experimental results.
However, because we are only interested in the transmission inside the head, this is not a real restriction and
the results using a plane wave should be also valid for an antenna directly placed on the head since the
propagation of an electromagnetic wave depends only on the properties of the medium and not on the
characteristics of the wave, that is plane wave, spherical wave, etc. Finally, we define the normalized transmitted power, 𝑃𝑁𝑡, as the ratio between the transmitted power into a bounded domain in the center of the brain and the power available in the lossless background in the very same bounded domain.
C. Simulation Results and Discussion
Figure 2: Normalized transmitted power according to the frequency [0.5 − 4]GHz, for a matching medium of 𝜀𝑚𝑚= [1 − 80]
(left). Cuts for 𝜀𝑚𝑚= 14,56,80 of the 𝑃𝑁𝑡 (right).
The normalized transmitted power represents the incoming power that can excite any anomaly in the center
5 normalized transmitted power plotted in dB for the spherical (left) model. The permittivity of the matching medium is varying in the range 𝜀𝑚𝑚= [1 − 80] (from air to water) and frequencies [0.5 − 4] GHz. The analysis is made for a lossless matching media as the conductivity has very small influence on the
normalized transmission power [14]. The color change corresponds to a drop in the normalized transmitted power in steps of 3dB and up to -36dB (all values below -36dB are depicted as the same dark blue color).
The power drop front is quasi constant, with respect to the matching medium and moves right in a constant
way with increasing frequency, revealing a similar attenuation over frequency independent of the matching medium’s permittivity. Cuts for 𝜀𝑚𝑚= 14, 56, 80 of 𝑃𝑁𝑡 are shown in the right picture of Fig. 2. It indicates that the power transmission is mainly affected by the tissue attenuation which is exponentially increasing with frequency. At 1GHz for example, the optimum is at 𝜀𝑚𝑚= 10, however the normalized transmitted power drops by approximately 3dB if 𝜀𝑚𝑚= 80 (approximately water at 1GHz), but the imaging resolution would increase by almost a factor of 3. The same normalized transmitted power is obtained considering the
field scattered by the anomaly and received by the probe. According to these observations, one can freely
choose the permittivity of the matching medium with respect to power transmission. The critical parameter
is the frequency that significantly influences the transmitted power. The almost free choice of the permittivity (1dB drop of 𝑃𝑁𝑡 for increasing 𝜀𝑚𝑚 from 56 to 80) means also, that it can be used to improve the imaging resolution according to the discussion in the introduction. A good compromise for the frequency
is around 1 GHz for which the attenuation in the head tissues is still acceptable.
III. EXPERIMENTAL VALIDATION A. Head Prototype
A 3D printed concentric multilayered spherical structure (see Fig. 3) has been manufactured. We used the
6
Figure 3: Pictures of the multilayered sphere prototype.
The filling system consists of 5 entries, allowing to use a different liquid for each shell. The filling system
and the holding system are designed in one piece to minimize its influence regarding the ideal multilayered
concentric spherical model (Fig. 1 (right)) that we want to confront with measurements. Each of the entries
has a blockage cap, 3D printed in a flexible material. The materials and thicknesses were designed to ensure
waterproofness. The dielectric properties of the ABS plastic structure of the 3D printed prototype were measured in the range of [0.5 − 4] GHz using the Agilent 85070E dielectric probe kit. The relative permittivity is 2.6 and constant while the conductivity is negligible in the frequency range of interest. The
plastic shells are 2mm thick. Several recipes are available to make liquids mimicking the main human head tissues. Following the guidelines adopted in [23], Triton X-100-water mixtures with NaCl (salt) (see Table
7
Figure 4: Theoretical (solid line) [12] and measured (dashed line) dielectric properties of the measurements of brain (black), CSF (dark blue), bone (green), fat (light blue) and skin (magenta).
The results for permittivity and conductivity measurements are depicted in Fig. 4, where the dispersive
characteristics of their theoretical (targeted) values can be observed over the frequency band of interest.
Table 1: Triton X-100 and NaCl concentrations.
Tissue Triton X-100 [%] NaCl [g/L] Thickness [mm]
Brain 35 4.3 43
CSF 7 14 3
Bone 85 0 7
Fat 100 0 4
8
B. Measurement Results
The transmission parameter |𝑆12| between a monopole antenna (port 2) vertically placed in the center of the head phantom and a vertically polarized horn antenna (port 1) placed at 1m distance is measured between 0.5 and 4 GHz with a HP 8720D to ensure far field conditions of a linearly polarized plane wave, along the
z-direction. As discussed in Section II, the matching medium is essentially useful to increase the imaging
resolution, therefore measuring with a horn antenna in air is acceptable since the purpose of this simple
setup is to experimentally validate only the power transmission inside the head computed by the analytical
modeling tool.
Figure 5: Schematic and picture of the measurement setup.
The measurements in the case of empty and filled spheres are denoted by 𝑆𝑖𝑗𝑒 and 𝑆𝑖𝑗𝑓 parameters, respectively. The ratio between these two measurements determines the amount of power injected into the
brain from the horn antenna and is defined as the normalized transmitted power,
𝑃𝑁𝑡(𝜔) = 𝐹(𝜔) |𝑆12𝑓(𝜔)|2 |𝑆12𝑒(𝜔)| 2 with 𝐹(𝜔) =1−|𝑆22 𝑒(𝜔)|2 1−|𝑆22𝑓(𝜔)|2 (2)
9 The coefficient 𝐹(𝜔) enables to account the changing mismatch of the receiving monopole when immersed into the brain-mimicking mixture. The monopole, similar to the one used in [24] for breast imaging purposes
with the only difference of a longer pin (4cm) to be adapted to the brain mimicking environment is
well-matched over the entire measured frequency band (see Fig. 6).
Figure 6: Monopole antenna specifications: measurement (blue) and simulation (red).
Additionally, 𝑆11𝑓 ≈ 𝑆11𝑒 as the emitting horn antenna is in free space in both configurations. In Fig. 7 the measured normalized transmitted power is plotted in blue and compared to simulations obtained using the spherical model (in green, when 𝜀𝑚𝑚= 1 in Fig. 2 (left)).
10
Figure 7: Normalized transmitted power as a function of the frequency: measured and simulated results.
One can easily observe that in the range [1.5 − 3]GHz the normalized transmitted power 𝑃𝑁𝑡 drops very rapidly by 15dB due to the strong attenuation in the tissues, which was predicted by both the planar and the
spherical model. This figure shows reasonable agreements between the measured and the simulated data of
the same configurations. At 1.6GHz the normalized transmitted power is -17dB for both simulated and measured 𝑃𝑁𝑡. The difference of the normalized transmitted power of the simulations and the measurements can be explained by the difference of the targeted dielectric properties and the Triton-based mixtures (see
Fig. 4) as well as the omission of the plastic layers in the numerical models.
As the filling process allowed to fill each layer on-site without moving the prototype (see Fig. 5), it was
possible to estimate the influence of each layer on the power transmission. In Fig. 8 (upper part) are plotted
ratios in dB of the 𝑛𝑡ℎ layer over the (𝑛 − 1)𝑡ℎ one, after the 𝑛𝑡ℎ layer is filled (from the brain to the skin layer). This power ratio 𝑅𝑛(𝜔) = |𝑆12𝑛(𝜔)|2
|𝑆12𝑛−1(𝜔)|
2, represents the propagation of the wave between the transmitting
antenna (here the monopole antenna in the center of the brain region) and the surrounding environment in
the case when only the core layer, representing the brain, is filled. In this representation 0dB means that
11 (green surface), it means that the added layer is beneficial to the propagation, or has a bad influence in the
negative case (red region). It appears clearly that the “forbidden frequency band” observed in [14] around 2
GHz is mainly dictated by the layers of CSF and skin. The bone strongly cuts the propagation around 3
GHz, however, as the attenuation is high at those frequencies, this additional “forbidden band” is somehow
hidden by the low levels of transmitted powers. The fat layer is good or neutral in the investigated frequency
band. The frequencies for which the propagation is the most suited for imaging the brain is around 1 GHz. In the lower part of Fig.8, the product of all these influences gives the total influence 𝑅(𝜔), of all the layers on the wave propagation. It appears clearly that up to around 1.2GHz the “barrier” formed by the CSF, bone,
fat and skin, is beneficial to the power transmission, and the opposite above this limit.
Figure 8: CSF, bone, fat and skin influences on the propagation.
IV. CONCLUSION
In this paper, the analysis of the normalized transmitted power of an impinging electromagnetic field onto
a simplified model of the human head for MWI applications has been presented using a spherical
multilayered model. Additionally, we presented a methodology to perform measurements outside and inside
liquid phantoms using the 3D printing technology. The strong attenuation of at least 15dB between 1.5GHz
12 confirms experimentally the trend to perform head MWI around 1GHz as the power attenuation is less than
10dB, for all considered matching media. The experimental results have been compared to theoretical results
based on a spherical wave expansion and showed reasonable agreement. The background medium has a
small influence on the power transmission into the brain and influences mainly the resolution of microwave
imaging for a defined frequency, therefore one should choose a high permittivity. Moreover, the influence
of the layers separating the imaging region (the brain) from the measurement setup on the propagation was
qualitatively measured and analyzed. This information provides insight on the limit of the frequency, where
this parameter starts to have a negative impact on the signal transmission between the brain and the matching
medium, and therefore on the imaging quality. Depending on the sensitivity of the data acquisition of the
imaging system, the frequency and matching medium ranges can be chosen using simplified analytical
models and then be fine-tuned using more complex EM solvers and more realistic models of the head.
ACKNOWLEDGMENT
This work has been supported by COST TD1301 MiMed and by the Swiss State Secretariat for Education,
Research and Innovation under contract No. SBFI C14.0071. Furthermore, we would like to thank Dr.
Lorenzo Crocco and Dr. Rosa Scapaticci for the fruitful conversations and collaboration on the topic of
MWI for brain stroke monitoring. We would also like to thank the EPFL-AFA and the DTU-EMS
workshops for building, respectively, the prototype and the measurement setup.
REFERENCES
[1] M. Pastorino, «Microwave Imaging,» Wiley Series in Microwave and Optical Engineering. John Wiley & Sons, 2010.
[2] R. Scapaticci, O. Bucci, I. Catapano et L. Crocco, «Differential microwave imaging for brain stroke followup,» International Journal of Antennas and Propagation, vol. Article ID 312528, p. 11, 2014.
[3] A. J. Devaney, «Current research topics in diffraction tomography,» chez Inverse Problems in
13 [4] C. Pichot, L. Jofre, G. Peronnet and J. Bolomey, «Active microwave imaging of inhomogeneous
bodies,» IEEE Transactions on Antennas and Propagation, vol. 33, n°14, p. 416–425, 1985.
[5] F. C. Chen and W. C. Chew, «Experimental verification of super resolution in nonlinear inverse scattering,» Appl. Phys. Lett., vol. 72, n°123, p. 3080–3082, 1998.
[6] P. M. Meaney, K. D. Paulsen, A. Hartov and R. C. Crane, «Microwave imaging for tissue assessment: Initial evaluation in multitarget tissue equivalent phantoms,» IEEE Transactions on Biomedical
Engineering, vol. 43, p. 878–890, 1996.
[7] S. Y. Semenov, R. H. Svenson, A. E. Bulyshev, A. E. Souvorov, A. G. Nazarov, Y. E. Sizov, V. G. Posukh, A. V. Pavlovsky, P. N. Repin and a. G. P. Tatsis, «Spatial Resolution of Microwave Tomography for Detection of Myocardial Ischemia and Infarction–Experimental Study on Two-Dimensional Models,»
IEEE Transactions on Microwave Theory and Techniques, vol. 48, n°14, pp. 538-544, 2000.
[8] A. T. Mobashsher, A. Mahmoud and A. M. Abbosh, «Portable Wideband Microwave Imaging System for Intracranial Hemorrhage Detection Using Improved Back-projection Algorithm with Model of Effective Head Permittivity,» Scientific Reports, vol. Article number: 20459, n°16, 2016.
[9] A. T. Mobashsher and A. M. Abbosh, «On-site Rapid Diagnosis of Intracranial Hematoma using Portable Multi-slice Microwave Imaging System,» Scientific Reports, vol. 6, p. 37620, 2016.
[10] A. T. Mobashsher, K. S. Bialkowski, A. M. Abbosh and S. Crozier, «Design and Experimental Evaluation of a Non-Invasive Microwave Head Imaging System for Intracranial Haemorrhage Detection,» PLoS
ONE, vol. 11, n°14, p. e0152351 https://doi.org/10.1371/journal.pone.0152351, 2016.
[11] M. Persson, A. Fhager, H. D. Trefna, Y. Yu, T. McKelvey, G. Pegenius, J.-E. Karlsson and M. Elam, «Microwave-Based Stroke Diagnosis Making Global Prehospital Thrombolytic Treatment Possible,»
IEEE Transactions on Biomedical Engineering, vol. 61, n°111, pp. 2806-2817, 2014.
[12] A. T. Mobashsher and A. Abbosh, «Three dimensional human head phantom with realistic electrical properties and anatomy,» IEEE Antennas and Wireless Propagation Letters, vol. 13, p. 1401 – 1404, 2014.
[13] S. Gabriel, R. W. Lau and C. Gabriel, «The dielectric properties of biological tissues: III. Parametric models for the dielectric spectrum,» Physics in Medicine & Biology, vol. 41, p. 2271–2293, 1996.
[14] R. Scapaticci, L. D. Donato, I. Catapano and L. Crocco, «A feasibility study on microwave imaging for brain stroke monitoring,» PIERB, vol. 40, p. 305–324, 2012.
[15] A. Moneda, M. Ioannidou and A. D. Chrissoulidis, «Radio-wave exposure of the human head: analytical study based on a versatile eccentric spheres model including a brain core and a pair of eyeballs,» IEEE Transactions on Biomedical Engineering, vol. 50, n°16, p. 667–676, 2003.
[16] L. F. and C. S., «Electromagnetic fields inside a lossy, multilayeredspherical head phantom excited by MRI coils: models and methods,» Physics in Medicine & Biology , vol. 49, p. 1835–1851, 2004.
14 [17] M. Burfeindt, T. Colgan, R. Mays, J. Shea, N. Behdad, B. V. Veen and S. Hagness, «MRI-Derived
3-D-Printed Breast Phantom for Microwave Breast Imaging Validation,» in IEEE Antennas and Wireless
Propagation Letters, vol. 11, p. 1610–1613, 2012.
[18] N. Joachimowicz, C. Conessa, T. Henriksson and B. Duchłne, «Breast Phantoms for Microwave Imaging,» IEEE Antennas and Wireless Propagation Letters, vol. 13, n°11, p. 1333, 2014.
[19] B. Guerin, J. P. Stockmann, M. Baboli, A. Torrado-Carvajal, A. V. Stenger and L. L. Wald, «Robust Time-Shifted Spoke Pulse Design in the Presence of Large B0 Variations with Simultaneous Reduction of Through-Plane Dephasing, B11 Effects, and the Specific Absorption Rate Using Parallel Transmission,» Magnetic Resonance in Medicine, vol. 76, p. 540–554, 2016.
[20] N. Joachimowicz, B. Duchêne, C. Conessa and O. Meyer, «Reference Phantoms for Microwave Imaging,» 11th European Conference on Antennas and Propagation (EUCAP), Paris, 2017.
[21] Y. Ge, R. Grossman, J. Babb, M. Rabin, L. Mannon and a. D. Kolson, «Correlations among Brain Gray Matter Volumes, Age, Gender, and Hemisphere in Healthy Individual,» AJNR Am J Neuroradiol, vol. 23, pp. 1327-1333, 2002.
[22] R. A. Shore, «Scattering of an Electromagnetic Linearly Polarized Plane Wave by a Multilayered Sphere,» IEEE Antennas & Propagation Magazine, p. 69–116, 2015.
[23] MiMed, «TD1301, COST Action MiMed. http://cost-action-td1301.org».
[24] T. Rubæk, K. S. Oleksiy and P. Meincke, «Computational Validation of a 3-D Microwave Imaging System for Breast-Cancer Screening,» IEEE Transactions on Antennas and Propagation, vol. 57, n°17, pp. 2105-2115, 2009.
[25] M. Slaney, A. C. Kak and L. E. Larsen, «Limitations of Imaging with First-Order Diffraction Tomography,» in IEEE Transactions on Microwave Theory and Techniques, vol. 32, n°18, p. 860–874, 1984.
15
FIGURES (8=>2 pages)
Figure 1: Spherical multilayered model to analyze the power transmitted into the human head. ... 3
Figure 2: Normalized transmitted power according to the frequency [0.5-4]GHz, for a matching medium of ε_mm=[1-80] (left). Cuts for ε_mm=14,56,80 of the P_Nt (right). ... 4
Figure 3: Pictures of the multilayered sphere prototype... 6
Figure 4: Theoretical (solid line) [12] and measured (dashed line) dielectric properties of the measurements
of brain (black), CSF (drak blue), bone (green), fat (light blue) and skin (magenta). ... 7
Figure 5: Schematic and picture of the measurement setup. ... 8
Figure 6: Monopole antenna specifications: measurements (blue) and simulations (red). ... 9
Figure 7: Normalized transmitted power as a function of the frequency: measured and simulated results. 10
![Figure 2: Normalized transmitted power according to the frequency [0.5 − 4]GHz, for a matching medium of](https://thumb-eu.123doks.com/thumbv2/123doknet/8232922.276884/5.918.113.807.637.913/figure-normalized-transmitted-according-frequency-matching-medium-.webp)

![Figure 4: Theoretical (solid line) [12] and measured (dashed line) dielectric properties of the measurements of brain (black), CSF (dark blue), bone (green), fat (light blue) and skin (magenta)](https://thumb-eu.123doks.com/thumbv2/123doknet/8232922.276884/8.918.228.703.105.614/figure-theoretical-measured-dashed-dielectric-properties-measurements-magenta.webp)


