Pour l'obtention du grade de
DOCTEUR DE L'UNIVERSITÉ DE POITIERS UFR des sciences fondamentales et appliquées
Pôle poitevin de recherche pour l'ingénieur en mécanique, matériaux et énergétique - PPRIMME (Diplôme National - Arrêté du 7 août 2006)
École doctorale : SIMMEA - Sciences et ingénierie en matériaux, mécanique, énergétique et aéronautique
Secteur de recherche : Génie mécanique, productique, transports Cotutelle : Universitatea politehnica (Bucarest)
Présentée par :
Daniela Georgeta Cobla
Procedures for the rheological characterization of the nonlinear behaviour of complex fluids in shear
and squeeze flows Directeur(s) de Thèse : Mohamed Hajjam, Corneliu B lan Soutenue le 01 novembre 2012 devant le jury
Jury :
Président Constantin Bulac Profesorul, Universitatea Politehnica Bucure ti Rapporteur Benyebka Bou-Saïd Maître de conférences, INSA de Lyon
Rapporteur Romeo Susan-Resiga Profesorul, Universitatea Politehnica Timi oara Membre Mohamed Hajjam Professeur des Universités, Université de Poitiers Membre Corneliu B lan Profesorul, Universitatea Politehnica Bucure ti Membre Aurelian Fatu Maître de conférences, Université de Poitiers
Membre Alexandru R dulescu Maitre de conferin e, Universitatea Politehnica Bucure ti
Pour citer cette thèse :
Daniela Georgeta Cobla . Procedures for the rheological characterization of the nonlinear behaviour of complex fluids in shear and squeeze flows [En ligne]. Thèse Génie mécanique, productique, transports . Poitiers : Université de Poitiers, 2012. Disponible sur Internet <http://theses.univ-poitiers.fr>
Investeşte în oameni!
Programul Operaţional Sectorial pentru Dezvoltarea Resurselor Umane 2007 – 2013
Proiect POSDRU/88/1.5/S/60203 – Dezvoltarea de cariere stiintifice competitive prin programe de burse doctorale (COMPETE)
UNIVERSITATEA POLITEHNICA DIN BUCUREŞTI
Facultatea Inginerie EnergeticăCatedra Hidraulică, Maşini Hidraulice şi Ingineria Mediului
UNIVERSITE DE POITIERS
Ecole Doctorale SI-MMEA Institut P’ - UPR 3346
Nr. Decizie Senat __________ din _____________
TEZĂ DE DOCTORAT
Procedures for the Rheological Characterization of the Nonlinear Behavior of
Complex Fluids in Shear and Squeeze Flows
Proceduri pentru Caracterizarea Comportamentului Reologic Neliniar al
Fluidelor Complexe în Mişcări de Forfecare şi Expulzare
Autor: Ing. DANIELA GEORGETA COBLAŞ
COMISIA DE DOCTORAT
Preşedinte Prof. dr. eng. Constantin BULAC de la Universitatea Politehnica Bucureşti Conducător
de doctorat-1 Prof. dr. eng. Corneliu Bălan de la Universitatea Politehnica Bucureşti Conducător
de doctorat-2 Prof.dr.eng. Mohamed Hajjam de la Université de Poitiers, France Referent Prof. dr. eng. Bou-Said Benyabka de la INSA-Lyon, France
Referent Prof. dr. eng. Romeo Susan-Resiga de la Universitatea Politehnica Timişoara Referent Conf. dr. eng. Aurelian Fătu de la Université de Poitiers, France Referent Conf. dr. eng. Alexandru Rădulescu de la Universitatea Politehnica Bucureşti
I dedicate this thesis to my wonderful mother.
Aknowlegements
Dear reader, I am very grateful for the attention you dedicate to read these lines, because saying “thanks!!!” is the most important thing when people around are showing you kindness and encouragement. You have to know that when I look back at the three years dedicated to this thesis I have a smile on my face thinking at all the great people that I met during this time, at all the things I have learned and all the places I have visited. I certainly believe that this PhD is like a gift for me, for the person I am now and the one I will be later on.
During the elaboration of this thesis I have received advices and encouragements from many people to whom I express my sincere consideration and to which I will be grateful each time I will read my thesis, talk about it or remember the PhD years.
Firstly I would like to express my deep and sincere gratitude to my principal thesis advisor, Prof. Corneliu Bălan for his continuously support, for the encouragement I received from his part, the enthusiasm and immense knowledge that he shares with us, the students. I also want to thank him for all the priceless advices about science, about life and the philosophy necessary to understand and live with both of them.
I wish to express my warm and sincere thanks to my thesis advisor Prof. Mohamed Hajjam for his guidance that started long before this thesis, during the preparation of my license project. Without his inestimable guidance, without his patience, flexibility, genuine and valuable kindness I would have not stepped in the doors of “science” and “research” that brought me here today.
I owe my deepest gratitude to Conf. Diana Broboană for her infinite friendship, for the scientific, administrative and financial support that she offered me unconditionally during this three years. I hope that over the years to come I will still enjoy this beautiful friendship from this wonderful person.
This thesis would not have been possible without the unconditioned scientific support and friendship that I have received from Conf. Alexandru Rădulescu, to whom I want to express my heartfelt gratitude.
It is a pleasure to thank Hdr. Aurelian Fătu for all the help I received from his part, the generosity with which he helped me during my license dissertation and thesis stages in Angouleme, for his friendship, understandings and encouragements.
I am very grateful to Dr. Tiberiu Bărbat for his priceless and essential help in numerical simulations I conducted with Fluent software.
I warmly thank my colleagues from REOROM group, especially Dr. eng. Cătălin Bălan, Dr. eng. Roland Kadar and Dr. eng. Cătălin Mărculescu for their unconditioned support and for providing a stimulating and fun-filled environment without whom even the most dedicated PhD student looses motivation.
I would like to thank also to all the members of Structures and Interfaces Team, LMS from Poitiers University, to all the members of the Hydraulic Machines and Environmental Engineering Department from Polytehnica University and all the professors and colleagues who have helped me with my work and received me with open arms and beautiful smiles when I needed the most.
Last, but by no means least, I thank my family and my friends for all their understanding, their never fading support and the love that they showed me not only during the last three years.
I owe my loving thanks to my mother, to David and to my best friends Mirela, Dana and Iosif for their caring, concern, friendship and love.
SCIENTIFIC WORK ISI Papers:
1. Coblaş D., Broboană D., Bălan C., Simple shear of materials characterized by steady non-monotonous flow curve, Proccedings of the seventh International Symposium on Advanced Topics in Electrical Engineering, ISSN 2068-7966, Bucharest, 12-14, May, 2011, pp. 121-124. 2. Coblaş D., Broboană D., Bălan C., Characterization of yield state in soft matter. Appl.
Rheology, submited paper Published B+ and BDI articles:
1. Coblaş D., Cristea A., Theoretical analysis of film squeeze for a stepped pin immersed in a newtonian fluid. U.P.B Scientific Bulletin, Series D - accepted for publication.
2. Coblaş D., Bălan C., Numerical and experimental analyse of viscous fluids in oscillatory squeezing flow. Mathematical Modeling in Civil Engineering - Scientific Journal, Volume 7 - No. 1-2, March, 2011, 8 pp.
3. Coblaş D., Broboană D., Bălan C., Characterization of viscous fluids in oscillatory squeezing flows. U.P.B Scientific Bulletin, Series D, Vol. 72, No 3, Bucharest, Romania, 2010, pp. 176-184. 4. Coblaş D., Hajjam M., Rădulescu A., Slip/no-slip influence on the behavior of a radial bearing with a static load. EHD analyzes. Innovative Technology – Machine Building, Vol. 61/ 2-3, Bucharest, Romania, 2009, pp. 51-54.
5. Coblaş D., Fătu A., Rădulescu A., Slip/no-slip influence on the behavior of a radial bearing with a static load. HD analyzes. Innovative Technology – Machine Building, Vol. 61/2-3, Bucharest, Romania, 2009, pp. 55-58.
Papers in international conference proceedings:
1. Coblaş D., Hajjam M., Rădulescu A., Bălan C., Experimental investigation of pure viscous fluids in constant velocity squeeze flow, Proceedings of the International Conference BALTTRIB’2011, Lithuania, 17-19, November, 2011, 7 pp.
2. Coblaş D., Broboană D., Bălan C., Yield-stress fluids behavior analyze in large amplitude oscillatory shear flow. Proceedings of « Le 45-eme colloque anuel de Group Francais de Rheologie (GFR) », Lyon, France, 3-5, November, 2010, 4 pp.
3. Coblaş D., Broboană D., Rădulescu A., Oscillatory squeeze flow: experimental and numerical analyzes. Proceedings of « Le 45-eme colloque anuel de Group Francais de Rheologie (GFR) », Lyon, France, 3-5, November, 2010, 4 pp.
Papers in national conference proceedings:
1. Coblaş D., Broboană D., Bălan C., Hajjam M., Numerical simulations of constant velocity squeeze flow. Proceedings of the 7th Hydro-Energetic Romanian Conference, Dorin Pavel,
Bucharest, Romania, 24-25, Mai, 2012, pp. 116-125.
2. Coblaş D., Broboană D., Bălan C., Rheology of yield stress fluids: experiments, constitutive relation, numerical simulations, Proccedings of the 33rd "Caius Iacob" Conference on Fluid Mechanics and its Technical Applications, Bucharest, Romania, 29-30, September, 2011, pp. 43-49.
3. Coblaş D., Broboană D., Bălan C., Rheology of yield stress fluids: constitutive relations and experiments. Proceedings of the 2nd Summer School of Rheology (SSR), Vol. II, Iaşi, Romania,
28 August – 3 September, 2011, pp. 58-67.
4. Broboană D., Coblaş D., Bălan C., Rheology of complex fluids characterized by non-monotonous flow curve, Proccedings of the Conference: Dynamics of Complex Fluids, Iaşi, Romania, 5-7, May, 2011, pp. 30-40.
5. Coblaş D., Broboană D., Bălan C., Rheological analysis of lubricants in oscillatory squeeze flows. Proceedings of the 1st Summer School of Rheology (SSR), Vol. I, Cluj-Napoca, Romania,
26-29, August, 2010, pp. 111-112.
6. Coblaş D., Broboană D., Bălan C., Rheological characterization of viscous fluids in oscillatory squeezing flows. Proceedings of the 6th Hydro-Energetic Romanian Conference, Dorin Pavel,
Bucharest, Romania, 2010, pp. 113-120. International Congresses:
1. Coblaş D., Broboană D., Bălan C., Rheology of complex fluids with discrete viscosity function. Proceedings of the XVIth International Congress on Rheology, Lisabon, Portugal, 5-10, August, 2012. (book of abstracts).Oral presentation.
2. Broboană D., Coblaş D., Bălan C., Numerical rheometry of complex fluids with yield stress. Poster session at the XVIth International Congress on Rheology, Lisabon, Portugal, 5-10, August, 2012. (book of abstracts). Poster session
International Conferences:
3. Coblaş D., Broboană D., Numerical solutions of non-newtonian flows in thin films. Minilubes Scientific Workshop, Iaşi, Romania, 23-23, April, 2012. Oral presentation.
4. Coblaş D., Broboană D., Bălan C., Viscosity function of materials with apparent yield stress, Non-Newtonian Fluid Mechanics: Progress and Challenges, Portmeirion, U.K., 18april 2011 - 20april 2011. Poster Session.
5. Coblaş D., Broboană D., Bălan C., Rheological characterization of yield stress fluids using oscillatory tests. DRG Annual Meeting, Berlin, Germany,31 March – 01 April, 2011 (book of abstracts). Oral presentation.
6. Coblaş D., Broboană D., Bălan C., Transient viscosity function of biocompatible creams and pastas. Proceedings of the 4th International Conference “Biomaterials, Tissue Engineering &
Medical Devices” BiomMedD, Sinaia, Romania, 23-25, September, 2010, pp. 119. Oral presentation.
7. Broboană D., Coblaş D., Bălan C., Hemodynamics of coronary stented artery. Proceedings of the 4th International Conference “Biomaterials, Tissue Engineering & Medical Devices”
BiomMedD, Sinaia, Romania, 23-25, September, 2010, pp. 148. Poster session. Editor:
1. Bălan C., Broboană D., Coblaş D., Proceedings of the 1st Summer School of Rheology – SSR
2010, Vol. I. Cluj-Napoca, Romania, 26-29, August, 2010, ISSN 2066-5790. Also part of organizing comitee.
2. Bălan C., Broboană D., Coblaş D., Proccedings of the 2nd Summer School of Rheology - SRR
2011, Vol. II. Bucarest and Iaşi, Romania, 28 August – 3 September, ISSN 2066-5790.
3. Bălan C., Broboană D., Coblaş D., Proceedings of CNCS-UEFISCDI Exploratory Workshop Program: “Actual research topics in fluid mechanics in relation to hystory and philosophy of science”. Sinaia, Romania, 5-8, June, 2012, ISSN 2066-5790.
National and International funding:
The work has been funded by the Sectoral Operational Programme Human Resources Development 2007-2013 of the Romanian Ministry of Labour, Family and Social Protection through the Financial Agreement POSDRU/88/1.5/S/60203.
Scientific Afiliations:
Romanian Society of Rheology, SRR – since 2009 Groupe Francais de Rheologie, GFR – since 2009
TABLE OF CONTENTS
Aknowlegements ... i
SCIENTIFIC WORK ... iii
LIST OF FIGURES ... 4
LIST OF TABLES ... 13
LIST OF NOTATIONS ... 14
C Chhaapptteerr 11.. INTRODUCTION ... 17
1.1. THE CONTEXT OF THIS STUDY AND ITS MOTIVATION ... 17
1.2. THESIS STRUCTURE ... 19
C Chhaapptteerr 22.. RHEOLOGY AND RHEOMETRY... 21
2.1. CAUCHY’S EQUATION OF MOTION AND THE STRESS TENSOR... 22
2.2. RHEOLOGICAL PROPERTIES OF SIMPLE AND COMPLEX FLUIDS ... 24
2.3. RHEOMETRY – TESTING PROCEDURES FOR SIMPLE AND COMPLEX FLUIDS ... 29
2.3.1. Viscometric motions... 29
2.3.2. Extensional motions ... 35
2.3.3. Complex motions – squeeze of fluid films ... 36
2.4. NON-LINEAR VISCOELASTICITY ... 40
2.4.1. Large amplitude oscillatory shear tests ... 44
2.5. ADHERENCE AND CAPILLARITY PHENOMENA ... 45
2.5.1. Capillarity phenomena and surface tension ... 46
2.5.2. Adherence and contact angle ... 50
C Chhaapptteerr 33.. SQUEEZE FLOW ... 53
3.1. CURRENT STAGE OF RESEARCH ... 55
3.1.1. Squeeze flow applications ... 55
3.1.2. Rheological squeeze tests and configurations of the testing geometries ... 57
3.2. THEORETICAL CONSIDERATIONS ... 58
3.2.1. Analytical formulation of squeeze motion in various geometries ... 58
3.2.2. Influence of contact surfaces inclination ... 64
3.2.3. Influence of adherence ... 69
3.2.4. Presence of inertial effects ... 73
3.2.5. Squeeze flow for generalised Newtonian fluids and viscoelastic fluids ... 73
C Chhaapptteerr 44.. NUMERICAL MODELLING OF SQUEEZING FLOW PHENOMENON ... 77
4.1. DESCRIBING THE NUMERICAL PROCEDURES – NUMERICAL CODE FLUENT ... 78
4.1.1. Volume of fluids method (VOF) ... 79
4.1.2. End Effects. Superficial tension and contact angle in numerical simulation of real flows. ... 81
4.2. GEOMETRY DEFINITION AND FLOW DOMAIN MESHING ... 82
4.2.1. Description of geometries used for single phase numerical simulations ... 83
4.2.2. Description of geometries used for multiphase numerical simulations ... 86
4.3.1. Comparative analysis between numerical solutions and theoretical predictions
for Newtonian fluids ... 88
4.3.2. The oscillatory squeezing flow of generalized Newtonian fluids ... 92
4.3.3. Nonlinear behavior of viscoelastic samples in oscillatory squeezing flow ... 95
4.3.4. End effects obtained numerically for oscillatory squeeze flow ... 98
4.3.5. Free surface evolution in oscillatory squeeze flow simulations ... 100
4.4. NUMERICAL MODELING OF CONSTANT VELOCITY SQUEEZE FLOW ... 104
4.4.1. Qualitative and quantitative analysis between transient and quasi-steady approximations ... 104
4.4.2. End effects in single phase constant velocity squeeze flow ... 107
4.4.3. Multiphase modeling of simple squeeze flow ... 108
4.5. COMPARISON BETWEEN NUMERICAL SOLUTIONS: GENERALIZED REYNOLDS EQUATION AND NAVIER-STOKES EQUATIONS FOR OSCILLATORY SQUEEZE FLOW ... 117
4.5.1. Results obtained for Newtonian fluids ... 119
4.5.2. Results obtained for Carreau-Yasuda model ... 120
4.6. CONCLUSIONS ... 122
C Chhaapptteerr 55.. EXPERIMENTAL INVESTIGATIONS OF SQUEEZE FLOW ... 124
5.1. EXPERIMENTAL SETUPS AND TESTING PROCEDURES ... 124
5.1.1. Devices and procedures for oscillatory squeezing flow ... 124
5.1.2. Instrumentation and procedures for constant velocity squeezing flow ... 127
5.2. PURE VISCOUS FLUIDS RHEOLOGY IN OSCILLATORY SQUEEZING TESTS.. 130
5.3. THE RHEOLOGY OF COMPLEX FLUIDS IN OSCILLATORY SQUEEZING FLOW... 136
5.4. THE RHEOLOGICAL BEHAVIOR OF NEWTONIAN FLUIDS IN CONSTANT VELOCITY SQUEEZE FLOW ... 140
5.4.1. Establishing the reliability domain depending on the fluid film thickness ... 141
5.4.2. Dimensionless force formulation ... 142
5.4.3. Free surface influence in constant velocity squeeze flow ... 146
5.5. COMPLEX FLUIDS RHEOLOGY IN SIMPLE SQUEEZE FLOW ... 149
5.6. CONCLUSIONS ... 151
C Chhaapptteerr 66.. NONLINEAR BEHAVIOR OF COMPLEX FLUIDS IN SHEAR TESTS ... 153
6.1. MATERIALS AND METHODS ... 153
6.2. NONLINEAR VISCOELATIC BEHAVIOR IN DYNAMIC SHEAR TESTS ... 155
6.3. NONLINEAR VISCOELASTICITY IN SIMPLE SHEAR FLOWS ... 162
6.4. FOURIER ANALYSIS AND INVESTIGATION OF SLIP OCCURRENCE ... 166
6.5. CONCLUSIONS ... 168
C Chhaapptteerr 77.. THE INFLUENCE OF SURFACE MICROSTRUCTURE ON THE SQUEEZING FORCE ... 172
7.1. THE INFLUENCE OF SURFACE MICROSTRUCTURE ON NEWTONIAN FLUIDS ADHESION PROPERTY ... 172
7.1.1. The experimental setup ... 172
7.1.2. Contact angle between various Newtonian sample and micro-structured surfaces... 174
7.2. CONSTANT VELOCITY SQUEEZE FLOW IN THE PRESENCE OF MICRO-STRUCTURED SURFACES... 175
7.3. NUMERICAL SIMULATION OF CONSTANT VELOCITY SQUEEZE FLOW IN
THE PRESENCE OF MICRO-STRUCTUREDSURFACES ... 179
7.3.1. The construction and meshing of the flow domain ... 179
7.3.2. Simulation results for mineral oil sample ... 180
7.4. CONCLUSIONS ... 183
C Chhaapptteerr 88.. FINAL CONCLUSIONS ... 184
8.1. GENERAL ASPECTS ... 184
8.2. PRACTICAL APPLICATIONS OF SQUEEZE FLOW MOTION ... 186
8.3. ORIGINAL CONTRIBUTIONS ... 186
8.4. FURTHER DEVELOPMENT OF THE STUDY ... 188
Bibliography ... 189 ANNEXES 1
ANNEX 1. Rheological models dependency on their constitutive parameters... A.1 ANNEX 2. Approximation of the experimental modules of a viscoelastic fluid by a
Maxwell model with 8 elements ... A.2 ANNEX 3. Determination of radial and axial velocity formulations for the simple squeeze
flow of newtonian fluids between paralel plates. ... A.4 ANNEX 4. Geometries construction and meshing for single phase quasi-steady
approximation of squeeze flow simulations. Influence of the free surface
geometry. ... A.9 ANNEX 5. Generalized Reynold Equations ... A.12 ANNEX 6. The evolution of the free surface for all Newtonian samples in constant
velocity squeeze flow, at all speeds ... A.14 ANNEX 7. Cream and polysiloxane microstructure, before and after a simple shear test ... A.25 ANNEX 8. Microstrucured surfaces details ... A.25
LIST OF FIGURES
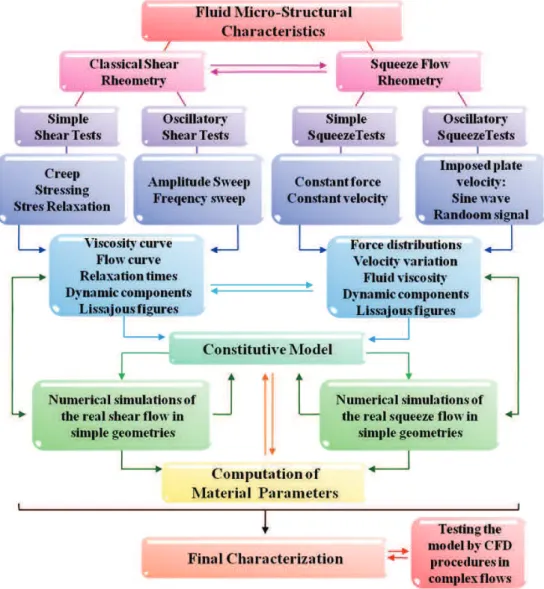
Fig. 1.1. Rheological characterization of fluids using experimental measurements, numerical
modeling and analitical constitutive models. ... 188 Fig. 2.1. Variation of shear stress (a) and of viscosity function (b) depending on the
rheological behavior of fluids. ... 26 Fig. 2.2. Variation of viscosity function (a) and shear stress (b) for different rhelogical
models. ... 27 Fig. 2.3. Maxwell (a) and Kelvin-Voigt (b) analogical models. ... 27 Fig. 2.4. The Maxwell model with “m” elements conected in parallel. ... 28 Fig. 2.5. The schematic representation of the viscometric motion of the incompressible
Newtonian fluids in various geometries used in usual rheometric tests: Hagen-Poiseuille flow in a capillary tube (a) and the Couette rotation flow in a geometry with coaxial cylinders (b), a cone-plate geometry (c) and a plate-plate geometry
(d). ... 30 Fig. 2.6. The applied shear stress (a) and the variation of the strain rate (b) for a Polysiloxane
sample, results obtained following a Creep test, at. . ... 31 Fig. 2.7. The imposed shear rate (a) and relaxation of stress (b) for a Polysiloxane sample,
results obtained following a Relaxation test, at . ... 32 Fig. 2.8. Phase angle variation for different types of materials (a) and complex modululus
definition depending on its elastic and viscous components (b). ... 33 Fig. 2.9. Approximation of the experimental modules and for a viscoelastic solution
with the Maxwell model with 8 elements, with variable relaxation time steps, at different amplitudes of the applied strain: (a); (b) şi
(c). ... 34 Fig. 2.10. Usual geometries used in extensional tests: forming of fluid filaments on
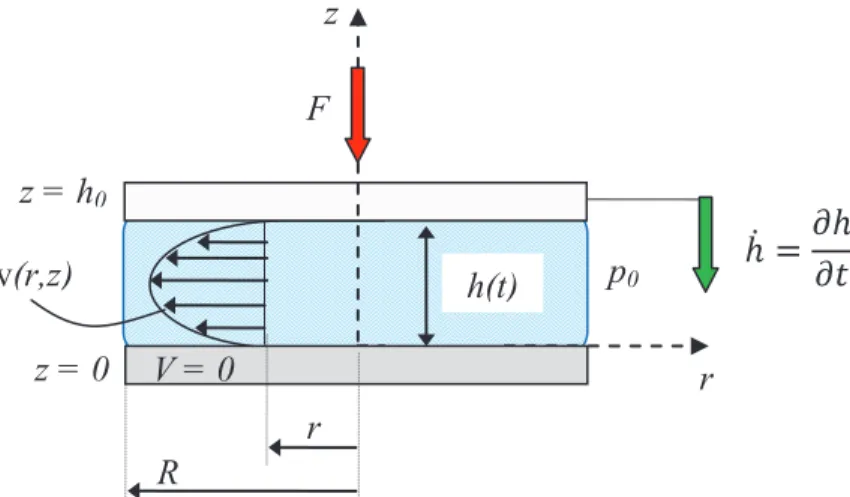
horizontal (a) and vertical directions (b, c); aspiration of fluids in tubes with small
diameters (d). ... 35 Fig. 2.11. Fluid squeezed between two parallel surfaces. ... 37 Fig. 2.12. Squeeze of a fluid between two parallel surfaces in case of a constant area squeeze
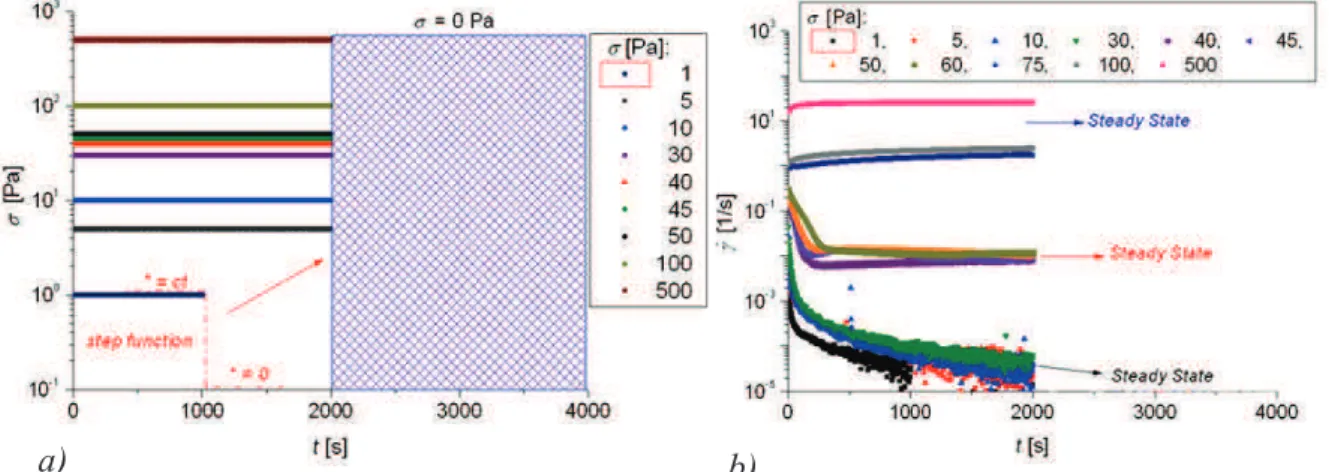
flow (a) and of a constant volume of fluid (b). ... 39 Fig. 2.13. Illustration of the non-linear behavior of complex fluids with yield stress σ0 by the
material flow curve (non-monotonous variation ). ... 41 Fig. 2.14. Deformation of stress output signal for complex in large amplitude oscillatory
shear flow. The input deformation signal is a pure sinusoide with increasing strain
amplitude. ... 42 Fig. 2.15. Variation of complex moduli components depending on the type of rheological
behavior associated to the material: strain thinning (a); strain hardening (b); weak
strain over shoot (c); strong strain overshoot (d) ... 43 Fig. 2.16. The Lissajous diagram for viscous and viscoelastic fluids at different values of the ... 44 Fig. 2.17. Action of cohesion forces over liquid molecules, inside it and at the... 46 Fig. 2.18. Effects of capillarity and superficial stress: breaking of a jet and formation of
drops (a); formation of spherical drops when breaking soap bubbles (b); water colum rising in capillary tubes (c); transport and retention of fluids in plants capillaries (d); formation of foams and emulsions (e); floating small objects on
the water surface (f); adhesion between the polymeric wires of a brush (g). ... 47 Fig. 2.19. Deformation of any free area under the action of the superficial stress forces (a)
and the raising phenomenon of a fluid in a capillary vessel of circular section ... 48 Fig. 2.20. Rising of fluid on a solid wall (a) and formation of the meniscus (hydrodynamic
bridge) between two solid surfaces (b). ... 49 Fig. 2.21. The contact angle in a liquid-solid-gaseous system and its variation depending on
the no slip properties of the solid surface (from total adherence – left side, to
perfect slip – right side). ... 50 Fig. 2.22. Velocity profile on the fluid film thickness in a plane shear motion for various
Fig. 3.1. Axial-symmetric squeeze flow of a fluid between two solid surfaces of different
sizes. ... 58 Fig. 3.2. Immersed plates geometries (in the volume of fluid). ... 58 Fig. 3.3. The squeeze flow of a viscous fluid of thickness between parallel plane discs
(axial symmetric flow with ). ... 59 Fig. 3.4. Flow of a viscous fluid in the thin layer of thickness between two solid surfaces. ... 60 Fig. 3.5. The oscillatory squeeze flow of a viscous fluid of thickness between parallel
plane discs ... 62 Fig. 3.6. The squeeze flow of a viscous fluid of thickness between two parallel plates of
infinite length (axially symmetricmotion with , , ). ... 63 Fig. 3.7. The squeeze flow of a viscous fluid of thickness between an annular surface and
a plane circular surface (axially symmetric motion with ). ... 63 Fig. 3.8. The squeeze flow of a viscous fluid of thickness between a spherical surface and
a plane disc (symmetrical axial flow with and ). ... 64 Fig. 3.9. The squeeze flow of a viscous fluid due to the immersion of a solid plate into a
fluid tank. ... 65 Fig. 3.10. The squeeze flow of a viscous fluid of thickness between two discs. The upper
disc is inclined with the angle . ... 67 Fig. 3.11. Plane squeeze flow (2D) of a viscous fluid of thickness between two discs. The
lower disc is inclined with the angle . ... 68 Fig. 3.12. Plane squeeze flow (2D) of a viscous fluid of thickness between two discs. The
lower disc is inclined with the angle . ... 68 Fig. 3.13. Form of fluid blocks in the squeeze flow for visco-plastic materials: in the
presence of a sheared fluid layer in the vicinity of walls (a) and in its absence (b). ... 74 Fig. 4.1. Quasi-steady approximation sketch of the unsteady constant velocity squeeze flow. ... 79 Fig. 4.2. The computation of cell volume fraction αA and the interpolation of two fluid
phases interface. ... 80 Fig. 4.3. The S1 geometry used for the numerical simulation of the oscillatory squeezing
flow, boundary conditions definition and the meshed flow area. ... 84 Fig. 4.4. S2 and S3 geometries used for the unsteady constant velocity squeeze flow,
boundary conditions definition and the meshed flow area. ... 84 Fig. 4.5. CS1 geometry used for the quasi-steady approximation of constant velocity squeeze
flow: boundary conditions definition and the meshed flow area (a); variation of
geometry dimensions depending on the initial film thickness (b). ... 85 Fig. 4.6. VOF1 geometry used for two phase simulation of oscillatory squeezing flow:
construction and meshing of the flow area (a); defining the fluid phases (b). ... 86 Fig. 4.7. VOF2 geometry used for two phase simulation of constant velocity squeezing flow:
construction and meshing of the flow area (a); setting the boundary conditions
(b); defining the fluid phases (c). ... 87 Fig. 4.8. Viscosity dependence on the testing temperature for mineral oil. ... 89 Fig. 4.9. The maximum amplitude of the force signal obtained by numerical simulations and
using the analytical expression for different values of , , and a constant input
amplitude of . ... 89 Fig. 4.10. The maximum amplitude of the force signal obtained by numerical simulations
and using the analytical expression (a) and the relative errors between them (b) for different values of , constant oscillatory frequency of
(simulation time step . ... 90 Fig. 4.11. The maximum amplitude of the force signal obtained by numerical simulations
and using the analytical expression (a) and the relative errors between them (b) for different values of , a constant oscillatory frequency of and
. ... 91 Fig. 4.12. Computational time step influence on the relative error between numerical
simulation results and analytical predictions for different values of oscillatory frequency , constant oscillatory amplitude and two different
Fig. 4.13. Computational time step influence on the relative error between numerical simulation results and analytical predictions for different values of oscillatory
amplitude , constant oscillatory frequency and . ... 92 Fig. 4.14. PAA rheology in shear tests: complex viscosity and shear stress variation (a);
storage and loss modulus variation (b). ... 92 Fig. 4.15. Experimental force and displacement signals for mineral oil sample (a) and PAA
sample (b) in oscillatory squeezing flow motion at , ,
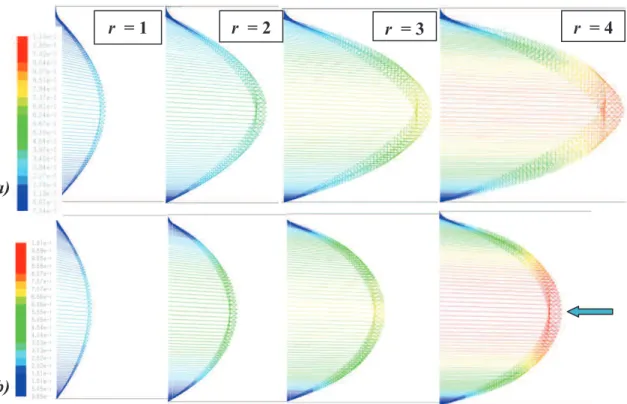
. ... 93 Fig. 4.17. Radial velocity vectors distribution trough the gap and along plate radius for the
Newtonian mineral oil sample (a) and a polymer sample described by
Carreau-Yasuda model (b). ... 94 Fig. 4.16. Force and displacement signals obtained trough numerical simulation of the
oscillatory squeezing flow for a polymer sample described by the
Carreau-Yasuda model at , and ... 95 Fig. 4.18. Viscosity dependence on shear rate (a) and the flow curve, usual curve for positive
flow index and with the occurrence of a plateau for negative flow index (b) for different parameters of the rheological Carreau-Yasuda model which can
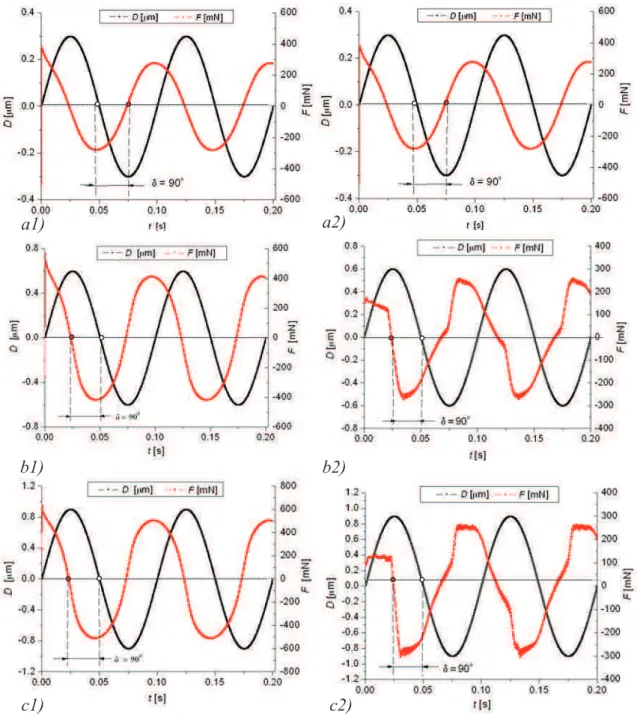
approximate the behavior of polymer solutions ... 95 Fig. 4.19. Quasi-steady linear (a1,b1,c1) and nonlinear (a2,b2,c2) behavior of a
polymer solution described by the generalized Newtonian Carreau-Yasuda model (PAA1, PAA2, see Table 4.2). The results are obtained from numerical simulations of oscillatory squeezing flow characterized by ,
şi (a), (b), (c). ... 97 Fig. 4.20. Quasi-steady linear (a1,b1) and nonlinear (a2,b2) behavior of an
emulsion described trough generalized Newtonian Carreau-Yasuda model (Cream1, Cream2, see Table 4.2). The results are obtained from numerical simulations of oscillatory squeezing flow characterized by ,
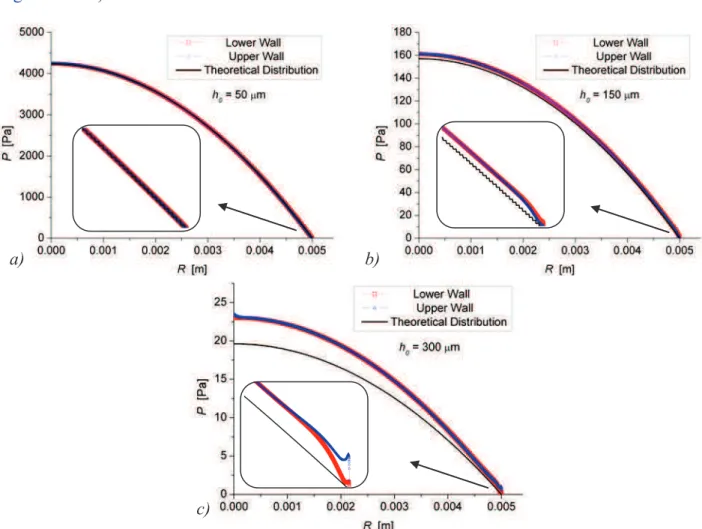
and (a) respectively (b). ... 98 Fig. 4.21. Pressure distribution on upper and lower walls obtained numerically, in
comparison with the analytical formulation at: (a),
(b), (c). Results for oscillatory squeezing flow of mineral oil at
and . ... 99 Fig. 4.22. Iso-pressure lines in the gap (in the vicinity of the outlet zone) obtained trough the
numerical simulation of the oscillatory squeezing flow of mineral oil at , , and different initial film thickness: (a),
(b), (c). ... 99 Fig. 4.23. Oil-air interface evolution (for a complete oscillation) obtained for the numerical
simulation of oscillatory squeezing flow ( , , ,.) in the absence of gravity by using GR scheme (a) and in the presence
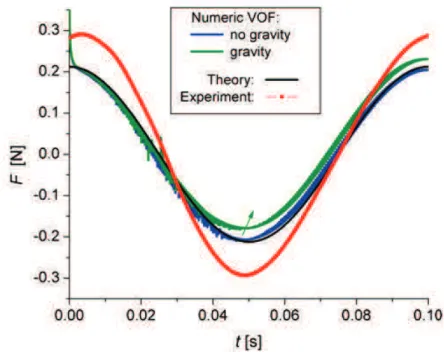
of gravitational effects by using CICSAM scheme (b). ... 101 Fig. 4.24. Force signal obtained trough numerical simulations of single and multiphase
squeeze flow. Numerical results are compared with the analytical predictions and the experimental measurements for the following conditions: ,
, . ... 102 Fig. 4.25. Oil-air interface and velocity vector distributions obtained for oscillatory
squeezing flow in the presence of surface tension and liquid-solid contact angle
( , , ). Case F1: Solver GGCB, GR
scheme for interface tracking; Cae F2: Solver GGNB, GR scheme for interface
tracking; Case F3: Solver GGNB, CICSAM scheme for interface tracking. ... 103 Fig. 4.26. Normal force dependence on film thickness and squeeze velocity obtained
numerically using transient and quasi-steady approximations of the constant
velocity squeeze motion of mineral oil. ... 104 Fig. 4.27. Radial velocity distribution in the gap, for the mineral oil sample, at a constant
squeezing velocity of and . Comparison between analytical solution and the numerical simulations using a quasi-steady
.Fig. 4.28. Axial velocity distribution in the gap, for the mineral oil sample, at a constant squeezing velocity of and . Comparison between analytical solution and the numerical simulations using a quasi-steady
approximation (case a) and ... 105 Fig. 4.29. Pressure distribution on the upper wall for the mineral oil sample at a constant
squeezing velocity of and . Comparison between analytical solution and the numerical simulations using a quasi-steady
approximation (case a) and ... 106 Fig. 4.30. Different shapes of the free surface in squeeze motion, observed experimentally
(red curve) and as considered by most of the numerical solutions and analytical
model. ... 107 Fig. 4.31. Pressure distribution on upper and lower walls (a) and pressure isolines in the gap
(b) for the transient numerical solution of constant velocity squeeze flow, mineral
oil sample ... 107 Fig. 4.32. Pressure distribution on upper and lower walls (a) and pressure isolines in the gap
(b) for the transient numerical solution of constant velocity squeeze flow, mineral
oil sample ... 108 Fig. 4.33. Pressure distribution on upper and lower walls (a) and pressure isolines in the gap
(b) for the transient numerical solution of constant velocity squeeze flow, mineral
oil sample ... 108 Fig. 4.34. Oil-air interface and velocity vectors obtained numerically for the constant
velocity squeeze flow using VOF2 geometry with different boundary conditions: two pressure outlet zones - red line (a) and a single outlet zone (b, c). The simulation settings imply the use of Pressure-Based solver with GGNC model and GR (a, b) and CICSAM (c) interface tracking methods. The simulation is
performed without taking into account gravity, surface tension or contact angle. ... 109 Fig. 4.35. The development of oil-air interface obtained trough numerical simulation of
constant velocity squeeze flow ( ) without ... 111 Fig. 4.36. Development of oil-air interface obtained trough numerical simulation of constant
velocity squeeze flow ( ) for different wetting conditions imposed on
the lower walls, (corresponding to case D1, D2 and D3 – see Figure 4.37-4.38). ... 112 Fig. 4.37. The development of oil-air interface obtained trough numerical simulation of
constant velocity squeeze flow ( ), in the presence of gravity and surface tension, using different slip conditions: no slip condition on all walls (case D1); partial slip, only on the external lower wall (case D2); almost perfect slip on the entire lower surface (case D3). Comparison with the experimental
visualizations for . ... 113 Fig. 4.38. The development of oil-air interface obtained trough numerical simulation of
constant velocity squeeze flow ( ), in the presence of gravity and surface tension, using different slip conditions: no slip condition on all walls (case D1); partial slip, only on the external lower wall (case D2); almost perfect slip on the entire lower surface (case D3). Comparison with the experimental
visualizations for . ... 114 Fig. 4.39. The variation of the upper plate displacement ∆h wall and the advance of the fluid
column on the margin ∆h fluid with fluid film thickness. Comparison between
experimental measurements and numerical simulation results for the constant velocity squeeze flow ( ), using different wetting conditions (see case
D1, D2 and D3). ... 115 Fig. 4.40. The development of oil-air interface obtained trough numerical simulation of
constant velocity squeeze flow ( ) in comparison with the analytical predictions. Results are obtained in the presence of gravity and surface tension, using different adherence conditions: perfect adherence (a); almost no adherence
(b). ... 115 Fig. 4.41. Radial velocity distribution in the gap, for the mineral oil sample, at a constant
squeezing velocity of and . Comparison between numerical simulations: single phase quasi-steady approximation (case a);
transient multiphase approximation with no slip condition (case b), transient
multiphase approximation with perfect slip condition (case c). ... 116
Fig. 4.42. Axial velocity distribution in the gap, for the mineral oil sample, at a constant squeezing velocity of and . Comparison between numerical simulations: single phase quasi-steady approximation (case a); transient multiphase approximation with no slip condition (case b), transient multiphase approximation with perfect slip condition (case c). ... 116
Fig. 4.43. Normal force distribution for constant velocity squeeze flow ( ) of mineral oil sample. Comparison between numerical simulations results in both single and multi phase modes and the experimental measurements performed at different testing temperatures. ... 117
Fig. 4.44. Winteracter console and the affichage of input data for numerical simulations with the personalized code created in Fortran. ... 118
Fig. 4.45. Comparison between numerical simulations results obtained with FORTRAN code and analytical predictions. Oscillatory squeeze flow of mineral oil sample, , and: ... 119
Fig. 4.46. Comparison between numerical simulations results obtained with FORTRAN code (red dots), analytical predictions (black line) and numerical simulations obtained with FLUENT code for a larger (green dots) and a smaller time step (blue dots). Oscillatory squeeze flow of mineral oil sample, , , and (a); (b). ... 120
Fig. 4.47. Comparison between numerical simulations results obtained with FORTRAN code (red dots), analytical predictions (black line) and numerical simulations obtained with FLUENT code for a larger (green dots) and a smaller time step (blue dots). Oscillatory squeeze flow of mineral oil sample, , and: (a); (b)... 120
Fig. 4.48. Results obtained with Fortran Code, for a Carreau-Yasuda fluid in oscillatory squeezing flow ( and different ). The parametes (PAA3) are indicated in Table 4.2. ... 121
Fig. 4.49. Results obtained with Fortran Code, for a Carreau-Yasuda fluid in oscillatory squeezing flow ( ). The parametes (PAA3 and PAA 4) are indicated in Table 4.2. Comparison between a positive and negative flow index of the constitutive model, at (a) and force signals obtained for a negative flow index and different oscilltory amplitudes. ... 121
Fig. 5.1. Micro Fourier Rheometer- MFR 2100 (a) and the parallel plate ... 124
Fig. 5.2. Outline drawing of MFR 2100 rheometer. ... 125
Fig. 5.3. Experimental scheme of the setup used for oscillatory squeezing flow. ... 127
Fig. 5.4. Physica MCR 301Rheometer: experimental setup (a) and the parallel plate ... 128
Fig. 5.5. Schematic representation of the Peltier system used temperature control. ... 129
Fig. 5.6. Experimental force and displacement signals obtained in oscillatory squeezing flow of mineral oil sample at , , . ... 130
Fig. 5.7. Filtered force signal obtained in oscillatory squeezing flow of mineral oil sample ... 131
Fig. 5.8. Comparison between experimental and theoretical force (a) and displacement (b) signals obtained in oscillatory squeezing flow of mineral oil sample ... 131
Fig. 5.9. Displacement signal fitting (a), by using 5000 (b) or 10.000 points (b) for the interpolation. The results correspond to an oscillatory squeezing test of mineral oil sample at , and . ... 132
Fig. 5.10. Comparison between theoretical and experimental force signals for mineral oil sample in oscillatory squeezing flow: different initial film thickness, (a, b, c) and (d, e, f); different values of oscillatory displacement amplitude, (a, d), (b, e), (c, f) and . ... 133
Fig. 5.11. Experimental and corresponding theoretical force magnitude (a) and force amplitude difference (b), as function of and at . Values extracted from the signals for mineral oil sample investigations in oscillatory squeezing flow tests... 134
Fig. 5.12. Comparison between theoretical and experimental force signals (measured and corrected) for glycerin sample in oscillatory squeezing flow at ;
,and different values of oscillatory displacement amplitude:
(a), (b), (c), (d),
(e), (f). ... 135 Fig. 5.13. Chemical structure of polysiloxane (PDMS). ... 136 Fig. 5.14. Time dependent displacement and force signals obtained in oscillatory squeezing
flow of PAA sample at , and different oscillatory
amplitudes: (a), ... 137 Fig. 5.15. Time dependent displacement and force signals obtained in oscillatory squeezing
flow of PS sample at , and diferent oscillatory
frequencies: (a), (b) and (c). ... 138 Fig. 5.16. Lissajous figures obtained in oscillatory squeezing flow for the mineral oil (a) and ... 138 Fig. 5.17. Lissajous figures obtained in oscillatory squeezing flow for the PS sample. The
curves correspond to , and different oscillatory
frequencies, (a), (b), (c), (d),
(e) and to , ... 139 Fig. 5.17. Lissajous figures obtained in oscillatory squeezing flow for the PAA sample ... 140 Fig. 5.19. Comparison between experimental measurements and theoretical predictions for
mineral oil sample in constant velocity squeeze flow ( ) at different temperature values. Establishing the reliability domain depending on the
fluid film thickness. ... 141 Fig. 5.20. Comparison between experimental measurements and theoretical predictions for
mineral oil sample in constant velocity squeeze flow ( ) and
. ... 141 Fig. 5.21. Comparison between experimental measurements and theoretical predictions for
mineral oil sample in constant velocity squeeze flow at different temperature
values and (a); . (b) ... 142 Fig. 5.22. Dimensionless experimental values (using different viscosity coefficients) and
theoretical predictions for mineral oil sample in constant velocity squeeze flow at
and . ... 143 Fig. 5.23. Dimensionless experimental values and theoretical predictions for mineral oil
sample in constant velocity squeeze flow at and different
temperatures. ... 143 Fig. 5.24. Dimensionless experimental values and theoretical predictions for mineral oil
sample in constant velocity squeeze flow at different temperatures and:
(a), (b). ... 144 Fig. 5.25. Dimensionless experimental values and theoretical predictions for glycerin sample
in constant velocity squeeze flow at different temperatures and:
(a), ... 144 Fig. 5.26. Dimensionless experimental values and theoretical predictions for honney in
constant velocity squeeze flow at different temperatures and:
(a), ... 145 Fig. 5.27. Master curve representing the dimensionless experimental and theoretical force
distribution for all investigated Newtonian samples in constant velocity squeeze
flow at different temperatures: ... 146 Fig. 5.28. Free surface development depending on film thickness ( ) for the glycerin
solution in constant velocity squeeze flow, . ... 147 Fig. 5.29. Free surface evolution during constant velocity squeeze flow ( ) for
mineral oil (a), glycerin (b) and honey (c). The captured images correspond to the beginning of the test (a1, b1, c1); an intermediate observational time (a2, b2, c2)
and the end of the test (a3, b3, c3). ... 148 Fig. 5.30. Comparison between experimental measurements and analytical predictions
(Power-Law model) of squeezing force for the analyzed samples (IK, PS, CR and
Fig. 5.31. Comparison between experimental measurements and analytical predictions (Power-Law model) of squeezing force for the CR (a) and PS (b) samples at
different squeezing velocities. ... 150 Fig. 5.32. Squeeze viscosity for: Newtonian fluids (honey - MI, glycerin - GL, oil - IK),(a);
PS sample (b); cosmetic cream sample CR (c) and gel sample (d). ... 152 Fig. 6.1. Dynamic strain sweeps at constant angular frequency, (a) and
(b): cosmetic cream (CR), polysiloxane (PS), lanolin (LN) and glycerin (GL). Hollow marks indicate the points where the Lissajous figures
were extracted. ... 155 Fig. 6.2. Oscillatory shear stress output for CR sample as function of the strain amplitude
input , corresponding to the points selected in Figure 6.1. ... 156 Fig. 6.3. Dynamic strain sweeps at various angular frequency values for CR (a) and PS (b)
sample. The delimitation of the flow regimes as function of the input strain
amplitude and shear stress variation. ... 157 Fig. 6.4. Dynamic strain sweeps at various angular frequency values for CR (a,b) and PS
(c,d) sample. The delimitation of the flow regimes as function of the input strain
amplitude: storage modulus (a,c) ... 158 Fig. 6.5. Lissajous figures, oscillatory stress vs. oscillatory strain, for CR sample
corresponding to the points indicated in Figure 6.1, . (a); the detail
P3 point marks the onset of non-linearity (b). ... 159 Fig. 6.6. Lissajous figures, oscillatory stress vs. oscillatory strain, for PS sample
corresponding to the points indicated in Figure 6.1, . (a). And a
detail on P4 and P5 points (b). ... 159 Fig. 6.7. Normalized Lissajous figures corresponding to the maximum of for CR and PS
samples at (see Figure 6.1). ... 160 Fig. 6.8. Dynamics moduli vs. angular frequency in SAOS regime for CR and PS samples:
gel structure for CR, respectively transition region for PS. ... 161 Fig. 6.9. Area of Lissajous figures vs. strain amplitude for the tested sample, oscillatory
stress vs. oscillatory strain (a) and oscillatory stress vs. oscillatory shear rate (b)
at ... 161 Fig. 6.10. Transient up (filled points) and down (hollow points) flow curves (shear stress vs.
shear rate) for CR sample (stress controlled experiments at .). ... 162 Fig. 6.11. Critical strain value emphasized for CR sample in shear experiments (see Figure
6.10): applied shear stress vs. starin (a) and strain vs. time (b). ... 163 Fig. 6.12. Time dependent viscosity curves obtained through multiple Creep tests for PS
sample... 164 Fig. 6.13. Viscosity dependence on shear rate for PS sample and the interpolation of the
measured values using Carreau-Yasuda model: comparison between dynamic shear tests (strain controlled) and simple shear tests (stress controlled), (a);
construction of a transient flow curve from multiple ... 164 Fig. 6.14. Quasi-steady flow curve for PS sample (multiple stress and strain controlled shear
tests). ... 165 Fig. 6.15. Creep curves performed for the PS sample: a) constant shear stress, see Fig. 7; b)
shear stress sweep. In both experiments is emphasis the same value of critical
strain, i.e. [-]. ... 165 Fig. 6.16. Answers of CR sample in oscillatory tests under different experimental conditions
(strain/stress amplitude sweep ), see also Figure 6.1. ... 166 Fig. 6.17. Frequency sweep (controlled strain and controlled stress experiments) for CR
sample. The corresponding values of loss tangent are: tan = 2.6 (point A – controlled strain), respectively tan = 0.52 (point B – controlled stress), see
Figure 6.16. ... 167 Fig. 6.18. Shear stress amplitude and loss tangent in frequency sweep test at different input
strain amplitudes (CR sample). It is important to remark that rheological characteristics recorded in the stress controlled experiment from Figure 6.17 are
Fig. 6.19. The normalized Fourier harmonics extracted from stress input (a) and strain input (b) tests at . The results mark the same interval for critical values
of strain, respectively stress, amplitudes from which the materials start to flow. ... 168 Fig. 6.20. The evidence of plateau behavior in the topology of Lissajous figures shear stress
vs. shear rate for CR sample: a) well defined flow behavior at , b) detail with the transition/plateau domain (input stress amplitude tests at
). ... 169 Fig. 6.21. Doubled Lissajous figures for different imposed stress magnitude. In the flow
domain the difference between two consecutive tests is sharp increasing, see
Figure 22, which suggest ... 170 Fig. 6.22. The difference in maximum rate magnitude between two consecutive cycles of
oscillatory tests performed at imposed stress amplitude. In detail is shown the variation of maximum rate amplitude with the shear stress. The region were possible slip can be observed follows the instability domain, which is associated
with the plateau. ... 171 Fig. 7.1. Video acquisition system used to determine the influence of surface microstructure
on Newtonian fluids contact angle: experimental assembly (a) silicon surface
micro textured (b) and micro-spiral (c). ... 173 Fig. 7.2. Contact angle determination by measurements of the droplet height and the radius
of circle segment corresponding fluid-solid contact, performed using Image-Pro
software. ... 173 Fig. 7.3. Influence of surface microstructure on Newtonian fluids contact angles: water (a1,
a2, a3), glycerin (b1, b2, b3), honey (c1, c2, c3), mineral oil (d1, d2, d3). The contact surfaces have different micro architectures: plane surface (a1, b1, c1, d1); micro-textured surface (a2, b2, c2, d2); micro-spiral surface (a3, b3, c3, d3). All images correspond to an observational time of 80 s at which the drop is
considered to have reached steady state value. ... 174 Fig. 7.4. number variation in constant velocity squeeze flow of mineral oil (a) and
honey (b) at . ... 176 Fig. 7.5. Normal force dependency on film thickness for a mineral oil sample during simple
squeeze tests at , and . Surface
microstructure influence on the normal force: plane plate (PSI), micro-textured
plate (PTXT), micro-spiral plate (PSP) ... 177
Fig. 7.6. Normal force dependency on film thickness for a honey during simple squeeze
tests at , and . Surface
microstructure influence on the normal force: plane plate (PSI), micro-textured
plate (PTXT), micro-spiral plate (PSP) ... 178
Fig. 7.7. Influence of patterned surfaces on shear viscosity of pure viscous, mineral oil sample (a) and viscoelastic, PAA solution (b) in simple and oscillatory shear tests
. ... 179 Fig. 7.7. Construction of geometries and meshing of floe area for the micro-spiral geometry:
top view of the lower plate (a); 3D arbitrary view of the geometry (b); transversal
section of the mesh at z=0 with detail on the outlet zone (c) ... 180 Fig. 7.8. Transversal iso-surface construction (at ) for numerical results representation
of the simple squeeze flow of mineral oil (a), pressure distribution in the gap for a
squeezing velocity of . ... 181 Fig. 7.9. Wall shear stress distribution in the gap obtained from the numerical simulation of
constant velocity squeeze flow ( ) of mineral oil sample for: micro-spiral geometry (a) with detain on the last two microchanels near the outlet area
(b) and the parallel plane plate geometry (c). ... 181 Fig. 7.10. Velocity distribution in the gap obtained from the numerical simulation of
constant velocity squeeze flow ( ) of mineral oil sample for: micro-spiral geometry (a) with detain on the last two microchanels near the outlet area
Fig. 7.11. Velocity vectors in the gap obtained from the numerical simulation of constant velocity squeeze flow ( ) of mineral oil sample for the micro-spiral
geometry. Fluid recirculation in the microchanel. ... 182 Fig. 7.12. Cells number distribution in the gap obtained from the numerical simulation of
constant velocity squeeze flow ( ) of mineral oil sample for: micro-spiral geometry (a) with detain on the last two microchanels near the outlet area
(b) and the parallel plane plate geometry (c). ... 182
Fig. A. 1. Viscosity curve variation for Carreau-Yasuda model, depending on constitutive
parameters ... A.1 Fig. A. 2. Viscosity curve variation for Bingham model, depending on constitutive
parameters: ... A.2 Fig. A. 3. Analysis module of Origin 8.0 software used for the aproximation of the
experimental measurements. ... A.3 Fig. A. 4. Squeeze flow of Newtonian incompressible fluid between paralell plates ... A.4 Fig. A. 5. Boundary conditions imposed for both simple and oscillatory squeeze flow, in the
case of transient dynamic mesh approximation. ... A.10 Fig. A. 6. Boundary conditions imposed for both simple squeeze flow, in the case of
quasis-teady aproximation. ... A.10 Fig. A. 7. Boundary conditions imposed for multiphase (VOF) simulations of squeezing flow. ... 11 Fig. A. 8. Geometries construction and meshing for single phase quasi-steady approximation
of squeezing flow. Investigation of end effects by using different shapes of the
oultet area. ... A.12 Fig. A. 9. Free surface evolution depending on film thickness ( ) for the mineral oil sample
in constant velocity squeeze flow, . ... A.16 Fig. A. 10. Free surface evolution depending on film thickness ( ) for the mineral oil sample
in constant velocity squeeze flow, . ... A.17 Fig. A. 11. Free surface evolution depending on film thickness ( ) for the mineral oil sample
in constant velocity squeeze flow, . ... A.18 Fig. A. 12. Free surface evolution depending on film thickness ( ) for glycerin sample in
constant velocity squeeze flow, .. ... A.19 Fig. A. 13. Free surface evolution depending on film thickness ( ) for glycerin sample in
constant velocity squeeze flow, .. ... A.20 Fig. A. 14. Free surface evolution depending on film thickness ( ) for glycerin sample in
constant velocity squeeze flow, .. ... A.21 Fig. A. 15. Free surface evolution depending on film thickness ( ) for honey sample in
constant velocity squeeze flow, .. ... A.22 Fig. A. 16. Free surface evolution depending on film thickness ( ) for honey sample in
constant velocity squeeze flow, .. ... A.23 Fig. A. 17. Free surface evolution depending on film thickness ( ) for honey sample in
constant velocity squeeze flow, . ... A.24 Fig. A. 18. Samples microstructure: cream before (a1) and after (a2) shear test; polysiloxane
before (b1) and after (b2) shear test. ... A.25 Fig. A. 19. Micro textured surface details. ... A.26 Fig. A. 20. Micro-spirals plate details. ... A.26
LIST OF TABLES
Table 2.1. Definition of material functions depending on the type of viscometric motion and
on the flow domain geometry. ... 31 Table 4.1. Carreau-Yasuda parameters used to approximate ... 93 Table 4.2. Carreau-Yasuda parameters used to approximate the linear and nonlinear
rheological behavior of emulsions and polymer solutions in shear flow. ... 96 Table 4.3. Imposed values for the dynamic contact angle at solid-fluid interface ( ), used for
the multiphase numerical simulation of constant velocity squeeze flow. ... 110 Table 5.1. Technical specifications of Physica MCR 301 Rheometer [ (Anton-Paar)]. ... 128 Table 5.2. Corrected force amplitude, apparent viscosity and relative error of measured
viscosity (in comparison with shear viscosity) for the glycerin sample in oscillatory
squeezing flow. ... 134 Table 5.3. Testing parameters for different Newtonian samples in constant velocity squeeze
flow. ... 140 Table 5.4. Parameters used for the approximation of experimental force distribution of
analyzed samples in constant velocity squeeze flow, by using Power-Law force
expression. ... 150 Table 5.5. Parameters used for the approximmation of experimental force distribution for
CR and GEL samples in constant velocity squeeze flow by using Power-Law force
expression. ... 151 Table 7.1. Measured contact angles for all tested samples in contact with different silica
micro structured surfaces: plane surface, micro textured surface, micro—spiral
surface. ... 175 Table 7.2. Normal force values obtained through the numerical simulations of constant
velocity squeeze flow of mineral oil sample, using the quasi-steady approximation of the flow. Surface microstructure influence on force values. Comparison with the
theoretical prediction for parallel plate geometries. ... 182 Table. A. 1. Parameters used for the representation of Careau-Yasuda model dependency ... A.1 Table. A. 2. Parameters used for the representation of Bingham model dependency ... A.2 Table. A. 4. The relaxation times and corresponding viscosities values for the aproximation
of fluid viscoelastic behavior with a Maxwell model (8 elements) for a initial
applied deformation of ... A.3 Table. A. 5. The relaxation times and corresponding viscosities values for the aproximation
of fluid viscoelastic behavior with a Maxwell model (8 elements) for a initial
applied deformation of ... A.3 Table. A. 6. The relaxation times and corresponding viscosities values for the aproximation
of fluid viscoelastic behavior with a Maxwell model (8 elements) for a initial
LIST OF NOTATIONS
Symbol Description measurements Unit of
Carreau-Yasuda exponent acceleration vector area
specific mass vector
, , specific mass vector components B plate width
Bingham number Capillary number geometric constant Courant number
Cf correction factor for experimental oscillatory squeeze flow
measurements
distance from the initial position of the pressure distribution center
symmetric rate tensor outer diameter of the ring inner diameter of the ring Deborah number
the center of pressure distribution numerical force amplitude analytical force amplitude time dependent squeeze velocity constant squeeze velocity
total force acting on a Wilhelmy plate gravity force
arhimedic force
dimensionless squeeze force elastic modulus
complex modululs
storage modulus (elastic component) loss modulus (viscous component) time dependent film thickness, testing gap dimensionless film thickness
maximum height of a liquid column lifting in a capillary tube minimum film thickness in a inclined plate geometry
initial film thickness, initial gap squeeze velocity
momentum vector unit tensor
second invariant of deformation tensor k consistency index geometric constant capillary length slip lenght plate lenght velocity gradient
m number of elements of Maxwell model slip coefficient, friction coefficient momentum
flow behavior index normal vector (or normal) first normal stress difference second normal stress difference pressure
pressure difference free surface pressure
pressure difference along the interface flow rate
capillary radius
plate radius, cylinder radius for Couette geometry RS sphere radius
, radii of curvature in each of the axes that are parallel to the surface
plasticity number time
dimensionless time observation time
necessary time to achieve plates contact temperature
Cauchy stress tensor
objective derivative introducing the nonlinearity extra stress tensor
dimensionless Trouton number computational time step velocity vector
, , velocity vector components in a Cartesian coordinate system , , velocity vector components in a Cylindrical coordinate system
lower plate velocity in shear motion upper plate velocity in shear motion fluid bulk velocity
fluid velocity at the wall constant squeeze velocity
dimensionless Weissenberg number inclination angle of a solid surface slip parameter
cone inclination angle (cone-plate geometry) phase angle
correction value of phase lag hencky strain
oscillatory strain amplitude, oscillatory squeeze amplitude angular frequency
frequency (squeeze flow)
specific deformation rate (extensional flow) relative error
strain (angular deformation in shear motion) shear rate
strain amplitude
, corresponding strain of viscoelastic mechanical models components (shear movement)
complex viscosity
elastic component of complex viscosity viscous component of complex viscosity Bingham viscosity
extensional viscosity zero shear viscosity infinite shear viscosity relaxation time contact angle wetted perimeter density
shear stress
critical Yield value, yield point
, corresponding shear stress of viscoelastic mechanical models components (shear movement)
, , normal components of stress tensor in a Cylindrical coordinate system wall shear stress
critical wall shear stress solid-gas interfacial energy solid-liquid interfacial energy
liquid-gas interfacial energy or surface tension
, , normal component of stress tensor in a Cartesian coordinate system volume
mean curvature (of a free surface) arbitrary function
C
C
h
h
a
a
p
p
t
t
e
e
r
r
1
1
. INTRODUCTION
.
1.1. THE CONTEXT OF THIS STUDY AND ITS MOTIVATION
The technological advance has encouraged, during the last decade, the manufacturing and use of new materials, with complex micro-structures and innovating properties. Their existence has been and still is conditioned by the need to enhance the efficiency of certain technological processes, of the advance in important fields such as medicine, manufacturing of medicines and of cosmetics, the food and cosmetic industries, the production of energy, recycling of resources, industry of transports, of car manufacturing, etc.
Within the thesis framework, we may assert that, as regards complex fluids, the three mandatoy stages– development, production and use – are conditioned by the possibility to understand and model fluid rheological behavior, both at macroscopic level, and at the micro or nanoscale levels. Fluid reology is implicitly determined by its properties of viscosity, elasticity and plasticity. A high interest has always been shown to the viscoelastic behavior of materials, viscoelasticity being the property of a material to manifest simultaneously a rheological behavior that is both viscous, and elastic, when it is subject to a deformation, due to the application of stress.
Fluids rheological characterisation supposes the determination of the extra stress tensor, present in the equations of motion, starting from rheological measurements. Extra stress tensor expression depends on deformation (applyed strain) and on the deformation rate, is called a constitutive relation. The rheological characterization, respectivley material functions modelling, is made by submitting the samples (fluids) to various mechanical tests that implicate shear motions, extension motions or squeeze flow.
In the last years, the analysis of the materials with nonlinear viscoelastic behavior has becomed one of the main problems in the field of rheology. The understanding, use and correction of testing procedures; the correlation between the macroscopic response of fluids obtained following the applied deformations (viscosity curves, flow curves, components of the complex module) with the changes occurred in the microstructure of materials (chemical reactions, particles dynamics); classification of materials depending on the nonlinear viscoelastic response; all these aspects represent important steps which form the basis of nonlinear viscoelasticity theory. Covering all these steps is imperative for science and
research advance, for the human society needs to manufacture new complex materials with specific properties, to process and use them.
The present thesis „Procedures for the Rheological Characterization of the Nonlinear Behavior of Complex Fluids in Shear and Squeeze Flows”, represents an analysis of rheological testing procedures for simple and complex fluids in both linear and nonlinear viscoelasticity domains. The study has been achieved following the agreement of joint supervision between the Polytechnic University of Bucharest and the Poitiers University of France. Therefore, the entire activity has been financed out of the European Social Fund through the Operational Sectorial Programme of Development of Human Resources - POSDRU 2007-2013. The research activity has been carried out within the REOROM Laboratory, Interaction Field-Substance (BIOINGTEH Platform), the Department of Hydraulics and of Hydraulic Machines, the Faculty of Energetics of the Polytechnic University of Bucharest, and within the Structure and Interference Laboratory of Axa TriboLub of the Mechanic Engineering Department and Complex Systems, the Poitiers University of France.
Fig. 1.1. Rheological characterization of fluids using experimental measurements, numerical modeling and analitical constitutive models.
The importance and innovative character of this work is justified by the correlation of the experimental testing procedures with the numerical modelling of the flow processes, technically supporting a new concept in the field of rheology, namely the Computational
Rheometry (see Figure 1.1).
The limitations of experimental instrumentation for rheometric measurements available nowadays (fulfillment of “no slip” or adherence condition during tests, visualisation of flow dynamics within the testing gap) encourages the findings of new investigations solutions, the understanding of dynamics and kinematics of flow motions used in rheometric tests.
Thus, in this work, rheometrical experimental procedures are correlated with numerical simulations of the real flows, allowing the analysis of velocity fields and fluid kinematics in the testing gaps, adherence condition influence on flow kinematics and implicitly over the rheological properties measured during the experimental investigations.
Equally, the complexity of the study is justified by the correlation of the simple shear tests with the complex squeeze motion, both in simple or dynamic controll of the applied deformation.
1.2. THESIS STRUCTURE
The approach of an extended range of rheological testing procedures, and a variety of fluids behaviors, requires the presentation of theoretical continum mechanics, rheology and rheometry, presentend in Chapter 2 and Chapter 3.
Thus Chapter 2. Rheology and Rheometry presents some fundamental notions of Fluid Mechanics and Rheology, concepts regarding rheological properties of simple and complex materials (viscosity, elasticity, surface tension, adherence), the linear and non-linear viscoelastic behavior and, not least, the shear, extension and squeeze motions commonly used in rheometric tests.
Since a large part of the thesis is dedicated to the complex motion of fluid squeeze,
Chapter 3. The Squeeze Flow represents a wide study on current stage of research concerning
squeeze flow and the theoretical expressions of the flow in various geometries, tests, with or without the influence of no slip, inertia or thermal conditions. Also in Paragraph 3.2.5 are presented several analytical solutions used for the squeeze flow of generalised Newtonian fluids, and the studies achieved so far for viscoelastic fluids in squeeze flow.
Chapter 4. Numerical Investigations of the Squeeze Phenomenon represents a broad
study of the squeeze phenomenon by using numerical simulations, for both constant velocity and oscillatory motions. In this chapter are presented simulations of the real yield both in the