Exploring the Diversity of Physiology for Applications in Wastewater Treatment and Biofuels Production
Patrick C. Hallenbeck*, Gustavo B. Leite, and Ahmed E. M. Abdelaziz
Département de microbiologie, infectiologie, et immunologie, Université de Montréal, CP 6128, Centre-ville, Montréal. PQ H3C 3J7 Canada
*Corresponding author: patrick.hallenbeck@umontreal.ca, fax: 514-343-5701
Keywords: Biofuels; sustainability; algae; wastewater; wastewater treatment; biodiesel;
nutrients; harvesting; oil extraction
Abstract
A recently established strain collection of freshwater microalgae native to Quebec was examined for physiological diversity. The 100 strains appeared very heterogeneous in terms of growth when they were cultured at 10±2 °C or 22±2 °C on the secondary effluent from a municipal wastewater treatment plant (WW) and defined BBM medium. Scatterplots were used to examine the diversity in physiology that might be present in the collection. These showed a number of interesting results. There was a fair amount of dispersion in growth rates by media type independent of temperature. Surprisingly considering that all the isolates had been initially enriched on BBM, the distribution was quite symmetrical around the iso-growth line, suggesting that enrichment on BBM did not seem to bias the cells for growth on this medium versus WW. As well, considering that all the isolates had been initially enriched at 22 °C, it is quite surprising that the distribution of specific growth rates was quite symmetrical around the iso-growth line with roughly equal numbers of isolates found on either side. Thus enrichment at 22 °C does not seem to bias the cells for growth at this temperature versus 10°C. The scatterplots obtained when the percentage lipid of cultures grown on BBM were compared with cultures grown on WW at either 10 °C or 22 °C made it apparent that lipid production was favored by growth on WW at either temperature and that lipid production does not seem to be particularly favored by one temperature over the other. When the collection was queried for differences with respect to sampling location, statistical analysis showed that roughly the same degree of physiological diversity was found with samples from the two different aggregate locations.
1.0 Introduction
There is a great deal of interest at present at both the research and development levels in microalgal biofuels production systems. A number of very significant challenges remain to be overcome before the dream of sustainable algal biofuels production becomes a reality (Georgianna & Mayfield 2012; Leite & Hallenbeck 2011; Larkum et al. 2012; Abdelaziz, Leite & Hallenbeck 2013a; Abdelaziz, Leite & Hallenbeck 2013b; Leite et al. 2013; Work et al. 2013). Among the many challenges, some may be solved by technological advances, e.g. harvesting and effective lipid extraction and conversion to biodiesel, whereas others, including: fast growth rates, high levels of lipid production, competitiveness, tolerance to variation in local conditions, are a function of the biology of the system. These latter goals then can be addressed through strain selection, with native, indigenous strains more likely to be competitive and hardy under local conditions.
Thus, a number of studies involving the isolation of strains in different locales have been undertaken with an eye to biofuels production since the late 1970’s over a number of continents and climatic zones (Sheehan et al. 1998; Nascimento et al. 2012; Griffiths & Harrison 2009; Mutanda et al. 2011; Rodolfi et al. 2009; Elliott et al. 2012; Do Nascimento et al. 2012; Abdelaziz, Leite, et al. 2014b; Araujo et al. 2011; Zhou et al. 2011). Almost invariably these bioprospecting efforts have had a narrow, immediate focus on very specific attributes, such as high lipid productivity, and usually go on to examine in detail the characteristics of only a few strains. Recently, we established a collection of over 100 native freshwater microalgae indigenous to Quebec (Abdelaziz, Leite, et al. 2014b). We have shown that some of the strains have interesting characteristics in terms of growth and lipid production and have gone on to carry out a RSM (response surface methodology) analysis of lipid production and growth, showing that one of the strains in the collection, PCH90 could grow well at both 22 and 10 °C on secondary wastewater effluent, producing up to 36% lipid (Abdelaziz, Ghosh, et al. 2014a). A more in depth look at some of the other strains indicated that there were a significant number that might be of potential interest for biofuels production.
However, such a collection also has the potential of being a valuable resource as a long term genetic resource or in examining local diversity. Algal diversity has long fascinated and in fact was the subject of the first book devoted to scientific photographs (Atkins 1843). Thus, from the very beginning discussions of algal diversity has been dominated by morphology. In general biodiversity has traditionally been described through taxonomy and taxonomic concepts, and since the phenome used to describe species is usually morphology, taxonomically defined biodiversity of microalgae has been dominated by microscopic examination. Even from this view point microalgal diversity has been regarded as enormous with an estimate of hundreds of thousands of undiscovered species being given more than two decades ago (Andersen 1992).
Traditional taxonomy, arguably the oldest recognized scientific profession (Genesis 2:19) (Boero 2010), may be at a cross-roads for a number of reasons; the number of described species is increasing exponentially, but so are the numbers of taxonomists, with no end in sight (Boero 2010; Joppa et al. 2011; Bacher 2012). Additionally, the naming of species present is not enough to describe the diversity present at a deep level due to: “hidden” diversity, the absence of observation of rare species; “cryptic” species, organisms with significant differences below the morphological level (Hopkins 2005; Bickford et al. 2007); and even the recently demonstrated existence of “ecotypes” in marine microalgae (Rodríguez et al. 2005). Thus, another descriptive process that looks at diversity on a different level is some type of DNA analysis, with a particularly useful approach called DNA barcoding where using sequence analysis of multiple genetic markers; mitochondrial cytochrome oxidase (COX), LSU rDNA, and Rubisco (rbcL), can identify new species and uncover cryptic species (Le Gall & Saunders 2010). This has of course greatly increased the information available about microalgal taxonomic diversity, but at a cost. As the number of sequences accumulates with time, there are fewer and fewer associated with taxonomically recognized names (<20 % in 2010), suggesting that taxonomy is on the road to a future without names (Clerck et al. 2013)!
Obviously, each approach has its benefits and should be matched to the specific goal at hand. However, ultimately and on many levels, including ecological and
biotechnological (bioprospecting), the most interesting question is, what is the functional diversity that is present. Nevertheless, this is seldom addressed. While it is known that the functional diversity of large culture collections is vast(Lang et al. 2011), little is known about functional diversity, i.e. physiological and metabolic robustness, within small, region specific collections. Since we had established a collection of one hundred different strains collected from the local waters of Quebec, we were interested in assessing the functional diversity present within this collection. The collection was queried for specific growth rate and lipid productivity on two different media at two different temperatures. The observed diversity was surprisingly large, suggesting that in general desirable microalgal phenotypes can readily be discovered in a restrained geographical search.
2.0 Materials and Methods
2.1 Establishment of the microalgal culture collection
Water samples were collected from five different locations; three freshwater lakes (Lac Croche (45° 59' 24.37" N 74° 0' 21.01" W) and Lac Pilon (46° 0' 14.02" N 74° 1' 7.09" W), Lac Triton (45° 59' 17.11" N 74° 0' 20.55" W)), situated in the Laurentian region north of Montreal, Canada; and two on each side of the Saint Lawrence river, situated approximately 10 km downstream from the confluence with the Ottawa river, where the water of both rivers are not yet totally mixed (45° 25' 39.12" N 73° 49' 15.78" W and 45° 21' 23.36" N 73° 48' 49.96" W). The detailed sampling protocol and initial isolation were described previously (Abdelaziz, Leite, et al. 2014b). No enrichment was used other than the use of a filtration step to concentrate the samples (Abdelaziz, Leite, et al. 2014b). The isolation procedure involved BBM agar plates (Abdelaziz, Leite, et al. 2014b) and incubation in a light chamber at 22 ± 2 ºC with atmospheric CO2 for a period
of four to six weeks. Light was provided by warm white fluorescent bulbs at 25 W/m2 operated on a 12/12 hour light/dark cycle. Individual strains were stored in dim light in 50 ml tubes.
2.2 Growth and lipid production
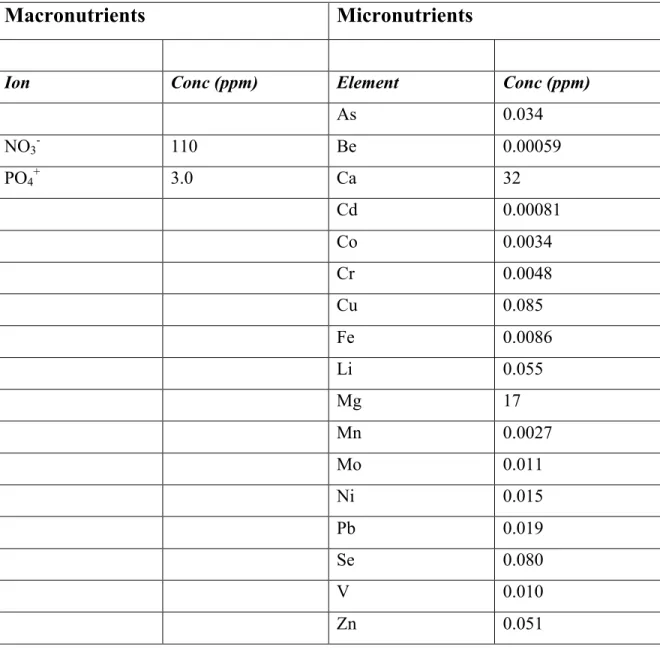
One hundred isolates were grown at 10±2 °C or 22±2 °C on the secondary effluent from a municipal wastewater treatment plant (La Praire, QC, Canada) and on BBM medium. The nitrate and phosphate content of the wastewater was determined as previously described (Abdelaziz, Leite, et al. 2014b), giving an estimated N:P ratio of 37:1 with a phosphate concentration of 3 mg· l-1 (Table 1). Strains were inoculated (1% v/v of OD600 value 1.0) in un-treated 12 well flat bottom plates containing either 4 ml
sterile municipal wastewater or BBM medium and incubated for 14 days in a photoincubator at 10±2 °C or 22±2 °C at a light intensity of 40 W·m-2 and a 12:12 h light/dark cycle. This method has some variability and an analysis of data obtained in this way indicates that variation between biological replicates done at different times is +25%. As well, although given the large number of strains it was not possible to carryout replicate samples at the same time, analysis of six duplicates that were included showed that the variation was +25%. Growth was quantified daily by measuring the optical density (OD600) using a microplate reader (Biotek EL800) as previously described
(Abdelaziz, Leite, et al. 2014b). Specific growth rates were calculated using the periodic OD measurements and choosing the exponential growth phase. The cellular content of lipid was determined by Nile Red as described previously(Abdelaziz, Leite, et al. 2014b) and given in Supplementary Materials. A Varian Vista MPX ICP-OES spectrophotometer was used to measure the partial elemental composition of the wastewater. Scatterplots were generated using Microsoft Excel and data analysis was made using intrinsic Excel tools or the Regression and Megabase addins.
3.0 Results and Discussion
The present article reanalyzes, from a different perspective, an existing data set, one that is too large to completely interpret in a single article. Previously, this collection was used to screen for a few selective strains that either were adept at wastewater treatment or that gave high lipid production under specific conditions. Here we have re-examined this collection (Table S1) in order to determine the extent of functional
diversity present. The strains were tentatively identified by microscopic examination (Table S1). The identity of ten strains picked randomly was checked by sequence analysis of the 18 SRNA and in every case agreed with that determined microscopically.
3.1 Culture collection and growth curves
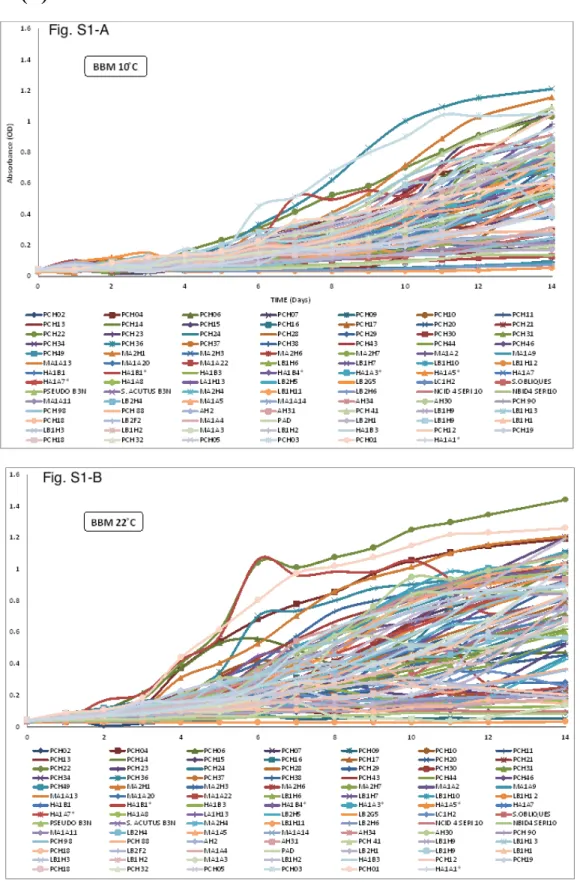
As described previously, we have established a culture collection of microalgae native to freshwaters of Quebec and, using a high throughput 12 well plate procedure, were able to select a few strains showing interesting growth properties, or an apparent capacity for high lipid production (Abdelaziz, Leite, et al. 2014b). We grew the close to 100 strains at 10±2 °C or 22±2 °C on the secondary effluent from a municipal wastewater treatment plant (La Prairie, QC, Canada) (the chemical composition is given Table 1) and BBM medium. It was apparent from the growth patterns that the collection was very heterogeneous in terms of metabolic properties under these conditions (Fig. S1A, B and Fig. S2A, B). A number of interesting questions arose in terms of the diversity in physiology that might be present. Although the strains were originally enriched with synthetic BBM medium, how did their patterns of growth on this medium compare with that on wastewater (WW)? Equally intriguing was the question of the effect of temperature on growth. All strains were originally enriched by cultivation at 22±2 °C, but what were their patterns of growth at 10±2 °C compared to the original 22±2 °C? In order to visualize these questions, we used scatterplots to assess the strain by strain covariance with the different parameters.
3.2 Patterns of growth on BBM versus WW
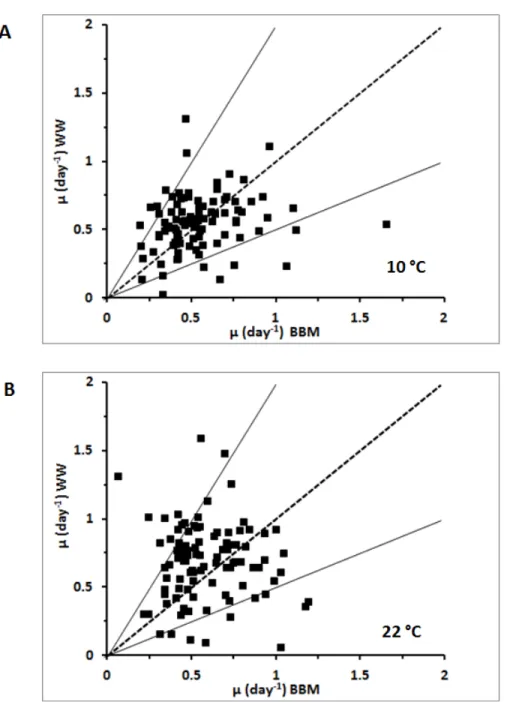
Since two different temperatures were used, two separate plots are required to visualize specific growth rate (µ day-1) differences by media type. The results are in fact quite instructive (Fig. 1 A & B). A comparison of Fig. 1A and 1B shows a number of interesting points. One, independent of the medium and temperature, there are a wide variety of growth rates, ranging from <0.25 day-1 to 1.5 day-1. Second, there is a fair
amount of dispersion in growth rates by media type independent of temperature. This can be seen by examination of either Fig. 1A or 1B. In these figures the dotted line represents the iso-growth line, that is the position of strains that grow equally well in either medium (line through the origin with a slope of 1). A large proportion of the isolates are found close to this line, with a fair number in the space between this line and the X-favored or Y-favored solid lines which define the slope where the specific growth rate on BBM is twice that on WW (X-favored) or where the specific growth rate on WW is twice that on BBM (Y-favored). Outside of these solid lines, in the space closer to either X or Y axes, are found strains with a very strong predilection for one medium over the other. Independent of the temperature, there appears to be roughly an equal number that strongly prefer WW or BBM; at 10°C, 6 for WW versus 7 for BBM and at 22 °C, 11 for WW versus 9 for BBM. Interestingly, the individual strains forming these “outliers” were different at the two different temperatures. Finally, somewhat surprisingly considering that all the isolates had been initially enriched on BBM, the distribution was quite symmetrical around the iso-growth line with roughly equal numbers of isolates found on either side. Thus enrichment on BBM did not seem to bias the cells for growth on this medium versus WW.
Some of these observations can be quantified by using linear regression analysis (Table 2). Fitting the specific growth rates on BBM versus WW at 22 °C to a straight line through the origin gives a slope of 1.019, indicating that the specific growth rates of different strains are distributed equally on either side of the iso-growth line. Similarly, specific growth rates of BBM versus WW at 10 °C gives a slope of 0.894, suggesting a roughly equal distribution of specific growth rates with specific growth rates in BBM being in general slightly higher at 10 °C. The correlation coefficient (R2) can be interpreted as an indication of the dispersion in values from the iso-growth line. Using this index, specific growth rates on either BBM or WW are clustered to iso-growth at 22 °C (R2=0.818) and at 10 °C (R2=0.800) (Table 2).
3.3 Patterns of growth at 10 °C versus 22 °C
Since two different media were used, two separate plots are required to visualize specific growth rate (µ day-1) differences by temperature. The results are in fact quite interesting and surprising (Fig. 2 A & B). A comparison of Fig. 2A and 2B shows a number of interesting points. One, independent of the medium and temperature, there are a wide variety of growth rates, ranging from ∼ 0.25 day-1 to ∼1.5 day-1. Second, there is a fair amount of dispersion in growth rates by temperature independent of media type. This can be seen by examination of either Fig. 2A or 2B where again the dotted line represents the iso-growth line, that is the position of strains that grow equally well at either temperature. A large proportion of the isolates are found close to this line, with a fair number in the space between this line and the X-favored or Y-favored solid lines which define the slope where the specific growth rate at 10 °C is twice that at 22 °C (X-favored) or where the specific growth rate at 22 °C is twice that at 10 °C (Y-(X-favored). Outside of these solid lines, in the space closer to either X or Y axes, are found strains with a strong predilection for one temperature over the other. There was a great deal more divergence with temperature for cultures grown on wastewater (Fig. 2B WW) than for cultures grown on BBM (Fig. 2A BBM). There are a significant number of these “outliers”, with higher numbers associated with growth at 22 °C than that at 10 °C. Finally, considering that all the isolates had been initially enriched at 22 °C, it is quite surprising that the distribution of specific growth rates was quite symmetrical around the iso-growth line with roughly equal numbers of isolates found on either side. Thus enrichment at 22 °C does not seem to bias the cells for growth at this temperature versus 10°C.
Again, these observations can be quantified by using linear regression analysis (Table 2). Fitting the specific growth rates on WW at 10 °C versus 22 °C to a straight line through 0,0 gives a slope of 1.118, indicating that the specific growth rates of different strains are distributed equally on either side of the iso-growth line. Similarly, specific growth rates on BBM at 10 °C versus 22 °C gives a slope of 0.964, suggesting again that the specific growth rates of different strains are distributed equally on either side of the iso-growth line. The correlation coefficient (R2) can be interpreted as an
indication of the dispersion in values from the linear regression line. Since the iso-growth line (slope = 1) is approximately the same as the linear regression lines (slopes of 1.118 and 0.964). Therefore, using this index, specific growth rates at either 10 °C or 22 °C are again roughly equally dispersed around the iso-growth line whether the medium is BBM (R2=0.818) or WW (R2=0.791).
3.4 Patterns of lipid production on BBM versus WW
It was also of interest to examine the capacity for lipid production among the strains isolated and to analyze the differences brought about by growth on different media and at different temperatures. It should be noted that no special culture conditions to enhance lipid production were used, thus the results shown here are certainly not the maximum lipid production that might be expected. Nevertheless, this analysis might provide some additional insight into the diversity of physiology represented in the culture collection.
The scatterplots obtained when the percentage lipid (at the end of 14 days of incubation) of cultures grown on BBM were compared with cultures grown on WW at either 10 °C or 22 °C are quite striking (Fig. 3A and B). It is readily apparent that lipid production was favored by growth on WW at either temperature. This is perhaps not surprising as the macronutrient content of WW (NO3 110 ppm, PO4 3.0 ppm) is
appreciably lower than BBM (NO3 183 ppm, PO4 163 ppm). At the end of the growth
period at least some of the cultures were probably experiencing some degree of nutrient limitation, a known trigger in many microalgae for increased lipid production. These observations can be quantified by using linear regression analysis (Table 2) which gives best fit lines with slopes of 0.408 (10 °C) and 0.396 (22 °C). Not only are these slopes nearly identical, showing a high degree of quantitative similarity in this difference regardless of the temperature, these are half of the iso-lipid line with a slope of 1, indicating that on the average, the percentage lipid content of a given strain is twice that when grown on WW than when grown on BBM. This is borne out by a simple calculation of the average lipid content of all the strains under the four different
conditions. The average lipid content on WW was 13.8% at 10 °C and 12.4% at 22 °C whereas on BBM it was 5.6% at 10 °C and 6.3% at 22 °C. It is apparent that independent of the temperature (10 °C or 22 °C), there were some high-performing strains producing over 30% lipid by weight when grown on WW (7 at 10 °C and 6 at 22 °C), see Table 3. It is interesting to note that in each case, with the exception of one strain (HA1B1*), the strains were different, again indicating the diversity in physiological capacities represented in the culture collection. On the other hand, the two highest producers when cultures were grown on BBM at 22 °C, PCH03 (39.4%) and MA2H1 (27.6%), also produced appreciable amounts of lipids when grown on BBM at 10 °C, PCH03 (15.7%) and MA2H1 (31.4%). (Results not shown).
We examined the potential correlation between nitrogen depletion and high lipid production in the best performers (highest lipid producers) on WW at both 10 °C and 22 °C (Table 3). Contrary to what might have been expected, there appears to be very little relationship between nitrate removal and lipid content. The one strain that showed high lipid production at both temperatures, HA1B1*, did so even though at both temperatures more than 70% of the initial nitrate remained. Four of the top producing strains at 22 °C (AH2, PCH16, HA1B3, PCH36) showed nearly equal capacity for nitrate removal at both temperatures, with in fact higher removal at 10 °C. Thus, lipid production in these strains may be temperature dependent with higher rates at higher temperatures. For unknown reasons, nitrate removal was low for all the best performers at 10 °C when they were grown at 22 °C. Two of the top producers at 10 °C (PCH20 and LB2G5) had high levels (> 30%) of lipids only at the lower temperature even though a large amount (>60%) of the nitrate remained. Here again, high lipid production seems to be primarily related to temperature, but in this case it seems to be increased at colder temperatures. Finally, out of all the top producers, only five (PCH37, PCH41, LB2H5, AH30, and MA1A3) appeared to have a lipid production response that fits the classical notion of this response being driven by nitrogen deprivation (Table 3).
3.5 Patterns of lipid production at 10 °C versus 22 °C
It was also instructive to examine any potential temperature effect on lipid production for the culture collection as a whole by using scatterplots to compare the lipid contents of the strains grown either on BBM or WW at the two different temperatures (Fig. 4). A number of conclusions, corroborating what was seen when lipid production was compared between media types (Section 3.4), are immediately apparent. One, there is a great diversity seen in lipid production with the two different media types at the two different temperatures. Secondly, lipid production with WW is in general greater than that seen with BBM. Thirdly, lipid production does not seem to be particularly favored by one temperature over the other, with a significant number of strains growing on wastewater producing higher amounts of lipids at either the higher temperature (22 °C) or the lower temperature (10 °C). However, there were a larger number of strains that showed a strong temperature effect at 10 °C as compared to 22 °C. Thus, 12 strains showed two-fold or greater lipid production at 22 °C and 21 strains showed two-fold or greater lipid production at 10 °C. These strains occupy the region on or above the line with a slope = 2, or on or below the line with a slope = 0.5 (Fig. 4B).
3.6 Is the observed physiological diversity locale dependent?
The above considerations show that this collection of microalgae isolated from a relatively few number of freshwater sources in Quebec appears to have a remarkable diversity in terms of growth on synthetic medium (BBM) versus wastewater (WW), and growth at 10 °C versus 22 °C. This diversity appears to extend to lipid production in response to environmental conditions and medium. Therefore the question arose as to whether or not the fact that the samples were obtained at different locales, three lakes and two rivers, had at least some contribution to the observed diversity in physiological responses. This question was addressed by binning the data by location and then examining lipid accumulation and specific growth rates under different conditions. The analysis was simplified and rendered more robust by grouping the strains in two different
categories; St. Lawrence River, or the three Laurentian Lakes combined, which covered 55 % and 42 % of the total strain collection respectively.
First, the dispersion in growth rates on both BBM and WW was examined as a function of sampling location. An examination of scatterplots shows that both locations provided a great diversity in growth rates when specific growth rates of individual strains at 22 °C was compared to that obtained at 10 °C (Fig. 5 and Fig. 6). Independent of sampling location, the variation and diversity in specific growth rates at the two temperatures showed the same relationship to media type as before, growth rates appeared to be more clustered on BBM medium (Fig. 5) than on WW (Fig. 6). Once again, growth rates of strains from the two aggregate locations were equally distributed about the isogrowth line, as indicated by the slopes of linear regression fits, which were close to 1 in all cases (Table 4). As expected, the correlation coefficients for growth of the samples on WW were somewhat lower than on BBM, with relatively little difference with respect to sampling location.
As well, the ability to grow well at a particular temperature does not seem to correlate very well with the temperature of the body of water from which the samples were obtained. For example, of the five strains that grew much better on WW at 10 °C than at 22 °C (LB2H2, PCH13, NCID4, PCH10, and LB1H9), two were from 2 °C water, one from 15.2 °C water and two from relatively high temperature waters, 25.3 °C and 24.7 °C (Table S1 ). Conversely, of the six strains showing a strong preference for growth on WW at 22 °C (LB1H11, MA1A14, PCH34, PCH28, LB2H6, and PCH98) three were isolated from 2 °C water, one from 12 °C water and only two from higher temperature waters, 23.5 °C and 24.7 °C (Table S1 ). Similarly, of the six strains that grew much better on BBM at 22 °C than at 10 °C (LB2H4, PCH06, PCH02, PCH38, HA1A3, and MA1A3), three were isolated from 2 °C waters, two from 12 °C water and only one from 25.3 °C water. Of course, the basis for this adaptive plasticity is unknown, but certainly demonstrates the underlying diversity present and might reflect a heterogeneous population of strains able to individually respond to the wide seasonal temperature variations encountered in these locations.
Next, the dispersion in the ability to accumulate lipid on both BBM and WW was examined as a function of sampling location (Fig. 7 and Fig. 8). Independent of sampling location, and as expected from the previous results, when growth on BBM was examined, most of the strains were clustered at the low end of percent lipid accumulation and appeared to be evenly distributed around the isolipid line (Fig. 7) with slopes of linear regression fits of approximately 1 (Table 5). Similarly, when percent lipid accumulation after growth on WW at 10 °C and 22 °C was examined as a function of sampling location, the variation appeared to be independent of where the samples had been collected (Fig. 8). As noted before, for both locations, lipid accumulation was greater at 10 °C than at 22 °C, most easily seen from the slopes of the linear regression fits, which were 0.736 (Laurentian Lakes) and 0.749 (St. Lawrence River) (Table 5). Again, the correlation coefficients, an indication of the dispersion in values around the linear regression line, were nearly the same, indicating the same degree of physiological diversity in samples from the two different aggregate locations. Additionally, when this question was examined in another manner, using PCA (principal component analysis), none of the principal components identified correlated with sampling location (Figs. S3).
A large number of the strains were identified as Chlorella sp. based on microscopic morphology and eight of those thus identified were also shown to be highly related to Chlorella by 18 SRNA analysis. However, there were small sequence differences, and, as shown here, functional differences as well. There appeared to be no strong correlation between species identification and the properties examined here. For example, in Table 3, four out of the five best performers at 22 °C and five out of the six best performers at 10 °C were all identified microscopically as strains of Chlorella.
4.0 Conclusion
An examination of specific growth rates and lipid accumulation by the collection of one hundred local microalgae indigenous to Quebec as a function of both medium type and temperature, showed that there was remarkable physiological diversity present within the collection. Indeed, the full spectrum of responses, strongly favoring one condition
over the other, or relatively indifferent, appeared to be present. Within the collection were some strains of potential biotechnological interest in terms of wastewater treatment or lipid production. Of fundamental interest are strains showing good growth at low temperatures. Here a convenient multiwall plate format was used in order to collect data from all 100 isolates for this study. Further studies involving fewer strains will be done with a greater volume and higher degree of replication. When this relatively geographically constrained collection was further divided into sampling locales, the scatterplots obtained suggested that wide diversity was nevertheless retained. It has relatively recently been shown that phytoplankton species richness increase with area follows a power law (Smith et al. 2005). If this holds true for functional diversity, which is likely to be the case, than functional diversity at megascale must certainly be enormous.
Acknowledgements
This research was supported by a grant from FQRNT (Le Fonds Québécois de la recherche sur la nature et les technologies), programme de recherche en partenariat contribuant à la séquestration des gaz à effet de serre (2011-GZ-141307) to P.C.H. PCH holds a National Research Council Senior Research Associateship Award at the Life Sciences Research Center, Department of Biology, United States Air Force Academy.
References
Abdelaziz, A.E.M., Ghosh, D. & Hallenbeck, P.C., 2014a. Characterization of growth and lipid production by Chlorella sp. PCH90, a microalga native to Quebec.
Bioresource Technology, 156, pp.20–28.
Abdelaziz, A.E.M., Leite, G.B. & Hallenbeck, P.C., 2013a. Addressing the challenges for sustainable production of algal biofuels: I. Algal strains and nutrient supply.
Abdelaziz, A.E.M., Leite, G.B. & Hallenbeck, P.C., 2013b. Addressing the challenges for sustainable production of algal biofuels: II. Harvesting and conversion to biofuels.
Environmental Technology, 34(13-14), pp.1807–1836.
Abdelaziz, A.E.M., Leite, G.B., et al., 2014b. Screening microalgae native to Quebec for wastewater treatment and biodiesel production. Bioresource Technology, 157, pp.140–148.
Andersen, R.A., 1992. Diversity of eukaryotic algae. Biodiversity & Conservation, 1(4), pp.267–292.
Araujo, G.S. et al., 2011. Bioprospecting for oil producing microalgal strains: evaluation of oil and biomass production for ten microalgal strains. Bioresource Technology, 102(8), pp.5248–5250.
Atkins, A., 1843. British Algae: Cyanotype Impressions. Halstead Place, Sevenoaks.
Privately printed, 3, pp.1843–1853.
Bacher, S., 2012. Still not enough taxonomists: reply to Joppa et al. Trends in Ecology &
Evolution, 27(2), pp.65–66.
Bickford, D. et al., 2007. Cryptic species as a window on diversity and conservation.
Trends in Ecology & Evolution, 22(3), pp.148–155.
Boero, F., 2010. The Study of Species in the Era of Biodiversity: A Tale of Stupidity.
Diversity, 2(1), pp.115–126.
Clerck, O. et al., 2013. Algal taxonomy: a road to nowhere? Journal of Phycology, 49(2), pp.215–225.
Do Nascimento, M. et al., 2012. Bioprospecting for fast growing and biomass characterization of oleaginous microalgae from South-Eastern Buenos Aires, Argentina. Bioresource Technology, 125, pp.283–290.
Elliott, L.G. et al., 2012. Algal Research. ALGAL, 1(2), pp.102–113.
Georgianna, D.R. & Mayfield, S.P., 2012. Exploiting diversity and synthetic biology for the production of algal biofuels. Nature, 488(7411), pp.329–335.
Griffiths, M.J. & Harrison, S.T.L., 2009. Lipid productivity as a key characteristic for choosing algal species for biodiesel production. Journal of Applied Phycology, 21(5), pp.493–507.
Hopkins, A., 2005. Body doubles. pp.1–1.
Joppa, L.N., Roberts, D.L. & Pimm, S.L., 2011. The population ecology and social behaviour of taxonomists. Trends in Ecology & Evolution, 26(11), pp.551–553.
Lang, I. et al., 2011. Fatty acid profiles and their distribution patternsin microalgae: a comprehensive analysis of morethan 2000 strains from the SAG culture collection. BMC Plant Biology, 11(1), p.124.
Larkum, A.W.D. et al., 2012. Selection, breeding and engineering of microalgae for bioenergy and biofuel production. Trends in Biotechnology, 30(4), pp.198–205.
Le Gall, L. & Saunders, G.W., 2010. DNA Barcoding Is a Powerful Tool to Uncover Algal Diversity: a Case Study of the Phyllophoraceae (Gigartinales, Rhodophyta) in the Canadian Flora. Journal of Phycology, 46(2), pp.374–389.
Leite, G.B. & Hallenbeck, P.C., 2011. 13 - Algal Oil. In Microbial Technologies in
Advanced Biofuels Production. New York: Springer, pp. 231–239.
Leite, G.B., Abdelaziz, A.E.M. & Hallenbeck, P.C., 2013. Algal biofuels: Challenges and opportunities. Bioresource Technology, 145, pp.134–141.
Mutanda, T. et al., 2011. Bioprospecting for hyper-lipid producing microalgal strains for sustainable biofuel production. Bioresource Technology, 102(1), pp.57–70.
Nascimento, I.A. et al., 2012. Screening Microalgae Strains for Biodiesel Production: Lipid Productivity and Estimation of Fuel Quality Based on Fatty Acids Profiles as Selective Criteria. BioEnergy Research, 6(1), pp.1–13.
Rodolfi, L. et al., 2009. Microalgae for oil: Strain selection, induction of lipid synthesis and outdoor mass cultivation in a low-cost photobioreactor. Biotechnology and
Bioengineering, 102(1), pp.100–112.
Rodríguez, F. et al., 2005. Ecotype diversity in the marine picoeukaryote Ostreococcus (Chlorophyta, Prasinophyceae). Environmental Microbiology, 7(6), pp.853–859.
Sheehan, J. et al., 1998. A Look Back at the U. S. Department of Energy's Aquatic Species Program, Knowledge Publications.
Smith, V.H. et al., 2005. Phytoplankton species richness scales consistently from laboratory microcosms to the world's oceans. Proceedings of the National
Academy of Sciences of the United States of America, 102(12), pp.4393–4396.
Work, V.H. et al., 2013. Biocommodities from photosynthetic microorganisms.
Environmental Progress & Sustainable Energy, 32(4), pp.989–1001.
Zhou, W. et al., 2011. Local bioprospecting for high-lipid producing microalgal strains to be grown on concentrated municipal wastewater for biofuel production.
Tables
Table 1 : Wastewater chemical composition
Macronutrients
Micronutrients
Ion Conc (ppm) Element Conc (ppm)
As 0.034 NO3- 110 Be 0.00059 PO4+ 3.0 Ca 32 Cd 0.00081 Co 0.0034 Cr 0.0048 Cu 0.085 Fe 0.0086 Li 0.055 Mg 17 Mn 0.0027 Mo 0.011 Ni 0.015 Pb 0.019 Se 0.080 V 0.010 Zn 0.051
Table 2: Linear regression analysis of scatterplots comparing specific
growth rates and percent lipid production in different media and at
different temperatures
Comparison
Slope
Correlation (R
2)
Specific growth rates BBM vs WW 10 °C 0.894 0.800 BBM vs WW 22 °C 1.019 0.818 BBM 10 °C vs 22 °C 0.964 0.818 WW 10 °C vs 22 °C 1.118 0.791 % lipid BBM vs WW 10 °C 0.408 0.600 BBM vs WW 22 °C 0.396 0.611 BBM 10 °C vs 22 °C 1.028 0.747 WW 10 °C vs 22 °C 0.749 0.653
Table: 3 Percent lipid content and percent nitrate removal for best
performing strains on WW at 10 ° C and 22 °C
Isolate
10 °C
22 °C
% Lipid % NO3 removed % Lipid % NO3 removed Best performers 22 °C AH2 12.1 96.7 34.9 92.3 PCH16 18.0 97.6 43.8 97.6 HA1B3 17.9 97.6 41.4 94.8 PCH36 23.6 97.6 35.7 85.9 PCH37 17.5 23.5 37.1 95.5Best, both 10 °C and 22 °C
HA1B1* 39.6 22.5 35.3 29.7 Best performers 10 °C PCH41 39.4 88.5 25.9 25.2 PCH20 32.3 27.0 13.5 14.3 LB2H5 33.3 97.6 12.9 19.7 AH30 34.5 88.1 22.6 32.0 MA1A3 45.5 97.6 9.39 22.3 LB2G5 31.5 34.3 11.1 27.0
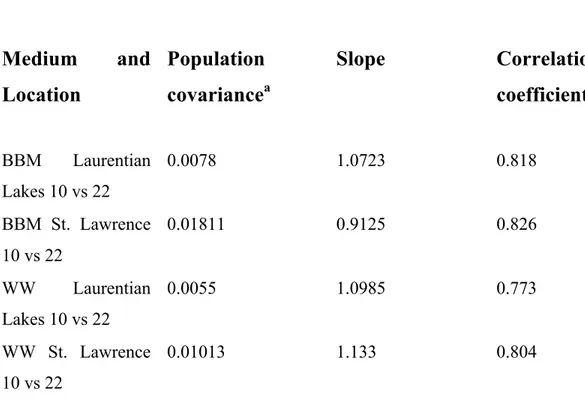
Table 4: Population covariance and correlation of growth rates as a
function of sampling location
Medium
and
Location
Population
covariance
aSlope
Correlation
coefficient
BBM Laurentian Lakes 10 vs 22 0.0078 1.0723 0.818 BBM St. Lawrence 10 vs 22 0.01811 0.9125 0.826 WW Laurentian Lakes 10 vs 22 0.0055 1.0985 0.773 WW St. Lawrence 10 vs 22 0.01013 1.133 0.804Table 5 : Population Covariance and correlation of lipid production by
as a function of sampling location
Medium
and
Location
Population
covariance
aSlope
Correlation
coefficient
BBM Laurentian Lakes 10 vs 22 14.6 1.014 0.871 BBM St Lawrence 10 vs 22 18.4 1.018 0.676 WW Laurentian Lakes 10 vs 22 36.1 0.736 0.637 WW St Lawrence 10 vs 22 30.4 0.749 0.664Table S1: Growth rate and lipid content under of the strains cited in this work under different conditions (%L = % lipids / dry weight; WW = waste water; BBM = Bold’s Basal Medium). # STRAIN Tentative Identification Date a °C site µ WW 10°C µ WW 22°C µ BBM 10°C µ BBM 22°C % L WW 10°C % L WW 22°C % L BBM 10°C % L BBM 22°C 74 AH2 Chlorella sp. 4-20 2 0.60 0.77 0.54 0.41 12.2 40.2 3.56 5.71 70 AH30 Chlorella sp. 4-20 12 0.41 0.41 0.43 0.72 34.5 23.7 4.58 6.71 75 AH31 Pseudochlorella sp. 4-20 2 0.63 1.01 0.44 0.54 9.64 11.2 6.39 11.6 69 AH34 Pseudochlorella sp. 4-20 2 0.41 0.74 0.40 0.55 7.87 9.54 4.89 5.95 99 HA1A1* Chroococcus sp. 5-20 12 1.11 0.90 0.96 0.72 2.82 9.11 3.32 1.70 48 HA1A3* Chlorella sp. 5-20 12 0.51 0.64 0.40 0.90 4.05 3.67 5.94 4.22 49 HA1A5* Pseudokirchneriella sp. 5-20 12 1.06 0.71 0.47 0.43 5.47 4.89 6.02 4.47 50 HA1A7 Kirchneriella sp. 5-20 12 0.52 0.65 0.35 0.34 6.10 7.42 3.47 6.66 51 HA1A7* Cylindrocystis sp. 5-20 12 0.55 0.91 0.34 0.48 3.94 5.93 3.48 3.19 52 HA1A8 Desmodesmus sp. 5-20 12 0.71 1.01 0.63 0.24 8.30 18.2 5.68 5.29 44 HA1B1 Scenedesmus sp. 5-20 12 0.33 0.83 0.42 0.42 8.55 7.35 2.75 2.36 45 HA1B1* Scenedesmus sp. 5-20 12 0.49 0.36 0.90 1.17 39.6 25.7 16.9 20.8 46 HA1B3 Kirchneriella sp. 5-20 12 0.61 0.76 0.53 0.43 13.2 24.4 5.34 7.77 47 HA1B4* Chlamydomonas sp. 5-20 12 0.63 0.88 0.38 0.63 3.76 4.05 3.16 3.03 53 LA1H13 Chlorella sp. 6-09 23.2 0.55 0.81 0.46 0.75 7.64 10.4 6.71 7.44 85 LB1H01 Oocystis sp. 6-09 24.7 0.41 0.83 0.40 0.31 17.6 5.27 2.50 1.84 87 LB1H02 Pseudochlorella sp. 6-09 24.7 0.49 0.62 0.34 0.57 19.4 6.40 2.17 2.88 86 LB1H03 Chlorella sp. 6-09 24.7 0.63 1.03 0.80 0.42 8.63 3.25 2.81 2.27 40 LB1H06 Chlorella sp. 6-09 25.3 0.50 0.77 0.34 0.47 5.76 2.86 4.13 2.22 41 LB1H07 Chlorella sp. 6-09 25.3 0.45 0.62 0.54 0.51 18.9 25.4 5.80 5.04 77 LB1H09 Pseudochlorella sp. 6-09 24.7 0.43 0.39 0.52 0.60 23.4 23.5 16.7 14.3 42 LB1H10 Chlorella sp. 6-09 25.3 0.47 0.75 0.42 0.52 6.77 11.8 2.87 3.15 61 LB1H11 Anabaena sp. 6-09 24.7 0.03 1.31 0.33 0.06 17.9 2.92 11.0 14.3 43 LB1H12 Chlorella sp. 6-09 25.3 0.50 0.44 0.40 0.70 8.24 5.03 3.68 2.62 78 LB1H13 Chroomonas sp. 6-09 24.7 0.75 0.84 0.71 0.54 6.23 2.90 5.35 9.25 80 LB2F2 Anabaena sp. 7-05 25.3 0.72 0.51 0.69 0.80 6.02 11.2 12.6 10.0 55 LB2G5 Chlorella sp. 7-05 25.3 0.57 0.74 0.76 0.47 31.5 11.2 4.26 11.1 83 LB2H1 Nitzschia sp. 7-05 25.3 0.38 0.65 0.20 0.73 13.3 4.70 5.98 2.05 66 LB2H4 Chlorella sp. 7-05 25.3 1.32 0.55 0.46 0.99 14.9 14.5 1.99 2.21
54 LB2H5 Anabaena sp. 7-05 25.3 0.74 0.69 0.48 0.79 33.3 12.3 2.48 5.14 62 LB2H6 Anabaena sp. 7-05 25.3 0.29 0.94 0.21 0.53 9.79 4.68 9.46 4.37 56 LC1H2 Oocystis sp. 6-09 24.4 0.67 0.69 0.56 0.45 23.6 9.12 5.41 7.57 35 MA1A02 Chlorella sp. 5-20 12 0.39 0.77 0.40 0.43 15.5 15.2 4.26 6.09 88 MA1A03 Chlorella sp. 5-20 12 0.74 0.98 0.38 0.81 45.5 9.16 4.56 7.16 81 MA1A04 Chlorella sp. 5-20 12 0.39 0.43 0.39 0.51 8.17 13.9 3.11 5.08 67 MA1A05 Desmodesmus sp 5-20 12 0.45 0.69 0.79 0.76 5.79 7.99 3.18 7.32 36 MA1A09 Chlorella sp. 5-20 12 0.67 0.80 0.25 0.71 6.76 14.6 8.89 2.41 65 MA1A11 Chlorella sp. 5-20 12 0.25 1.48 0.32 0.69 14.9 8.13 4.39 4.58 37 MA1A13 Chlorella sp. 5-20 12 0.52 0.55 0.52 0.51 5.87 4.79 3.18 2.79 68 MA1A14 Chlorella sp. 5-20 12 0.25 0.35 0.75 0.45 4.00 4.89 3.75 4.44 38 MA1A20 Closterium sp. 6-19 12 0.17 0.16 0.33 0.31 12.8 12.0 4.63 3.56 39 MA1A22 Closterium sp. 6-19 12 0.53 0.33 0.19 0.48 4.31 11.9 6.55 4.02 31 MA2H1 Chlorella sp. 6-19 18 0.54 0.70 1.65 0.93 27.5 15.6 31.4 27.6 32 MA2H3 Chlorella sp. 6-19 18 0.62 0.80 0.69 0.46 6.34 4.64 3.54 3.34 60 MA2H4 Chlorella sp. 6-19 17.5 0.87 0.92 0.81 0.84 8.83 4.88 3.26 3.12 33 MA2H6 Chlorella sp. 6-19 18 0.80 1.14 0.65 0.59 7.37 5.14 2.35 6.81 34 MA2H7 Chlorella sp. 6-19 18 0.40 0.72 0.65 0.42 7.09 6.91 5.11 2.51 64 NBID4 Chlorococcum sp. 6-06 15.2 0.14 0.30 0.20 0.24 16.7 14.2 8.12 9.01 63 NCID4 Chlorococcum sp. 6-06 15.2 0.62 0.16 0.64 0.38 15.9 16.9 4.62 7.80 82 PAD Anabaena sp. 6-19 12 0.62 0.89 0.31 0.93 12.1 3.33 6.13 2.85 98 PCH01 Chlorella sp. 4-20 2 0.63 0.65 0.61 0.87 8.38 28.3 11.6 6.92 1 PCH02 Chlorella sp. 4-20 2 0.49 0.40 0.55 1.19 28.0 11.8 4.47 4.01 97 PCH03 Chlorella sp. 4-20 2 0.24 0.33 1.06 0.59 28.6 13.8 15.7 39.4 2 PCH04 Chlorella sp. 4-20 2 0.66 0.61 1.10 1.03 7.68 4.77 4.41 3.54 96 PCH05 Chlorella sp. 4-20 2 0.56 0.45 0.44 0.34 21.6 7.06 5.65 7.25 3 PCH06 Chlorella sp. 4-20 2 0.59 0.75 0.54 1.04 11.7 19.1 4.47 4.90 4 PCH07 Chlorella sp. 4-20 2 0.85 0.45 0.65 0.93 5.40 6.95 5.27 4.08 6 PCH09 Chlorella sp. 4-20 2 0.57 0.31 0.46 0.22 9.45 9.31 7.96 11.9 7 PCH10 Chlorella sp. 4-20 2 0.59 0.06 0.95 1.03 7.87 18.6 2.03 20.1 8 PCH11 Chlorella sp. 4-20 2 0.57 0.69 0.54 0.46 8.24 11.2 2.50 2.84 92 PCH12 Chlorella sp. 4-20 2 0.32 0.29 0.54 0.73 21.7 14.0 5.79 6.96 9 PCH13 Chlorella sp. 4-20 2 0.91 0.10 0.73 0.58 9.28 16.7 6.02 8.62 10 PCH14 Pseudochlorella sp. 4-20 2 0.34 0.82 0.27 0.76 18.2 9.89 9.77 1.03 11 PCH15 Pseudochlorella sp. 4-20 2 0.56 0.30 0.51 0.43 13.2 13.8 14.9 6.72
13 PCH17 Chlorella sp. 4-20 2 0.60 0.49 0.49 0.42 6.80 5.68 2.84 2.07 79 PCH18 Closterium sp. 4-20 2 0.57 0.58 0.35 0.42 13.7 5.38 4.51 5.10 93 PCH19 Chlorella sp. 4-20 2 0.71 0.62 0.85 0.56 3.51 3.76 6.72 5.19 14 PCH20 Chlorella sp. 4-20 2 0.39 0.68 0.57 0.75 32.3 14.5 2.83 3.73 15 PCH21 Scenedesmus sp. 4-20 2 0.77 0.65 0.42 0.57 6.16 2.89 2.50 2.63 16 PCH22 Botrydiopsis sp. 4-20 2 0.50 0.80 1.12 0.82 7.53 12.4 4.54 4.45 17 PCH23 Chlorella sp. 4-20 2 0.79 1.26 0.34 0.73 21.8 8.87 2.65 2.47 18 PCH24 Chlorella sp. 4-20 2 0.53 0.85 0.46 0.37 4.54 9.71 4.83 1.98 19 PCH28 Chlorella sp. 4-20 2 0.14 1.01 0.67 0.34 18.9 13.1 1.78 2.53 20 PCH29 Chlorella sp. 4-20 2 0.50 0.42 0.56 0.41 17.1 9.42 3.14 2.22 21 PCH30 Scenedesmus sp. 4-20 2 0.44 0.61 0.51 0.51 7.26 6.47 3.74 2.90 22 PCH31 Chlorella sp. 4-20 2 0.47 0.49 0.69 0.34 20.9 21.6 4.47 2.56 95 PCH32 Scenedesmus sp. 4-20 2 0.77 0.92 0.48 0.42 7.23 7.15 2.23 4.62 23 PCH34 Chlorella sp. 4-20 2 0.71 1.59 0.75 0.55 20.0 23.1 4.88 1.40 24 PCH36 Chlorella sp. 4-20 2 0.74 0.78 0.70 0.71 23.7 34.8 9.32 11.6 25 PCH37 Chlorella sp. 4-20 2 0.74 0.94 0.92 0.55 17.5 37.8 3.36 4.95 26 PCH38 Chlorella sp. 4-20 2 0.69 0.92 0.41 1.00 9.07 11.3 5.73 4.80 76 PCH41 Chlorella sp. 4-20 12 0.73 0.53 0.43 0.62 39.36 28.1 15.2 10.3 27 PCH43 Chlorella sp. 4-20 2 0.58 0.91 0.57 0.78 7.80 12.3 4.77 4.63 28 PCH44 Chlorella sp. 4-20 2 0.65 0.61 0.77 0.49 10.8 5.55 2.61 3.90 29 PCH46 Chlorella sp. 4-20 2 0.66 0.69 0.54 0.45 17.4 15.3 2.62 9.27 30 PCH49 Chlorella sp. 4-20 2 0.55 0.90 0.76 0.65 8.19 3.00 3.42 4.98 73 PCH88 Chlorella sp. 4-20 2 0.58 0.79 0.41 0.52 10.6 16.5 3.53 9.21 71 PCH90 Chlorella sp. 4-20 2 0.71 0.97 0.53 0.46 28.2 21.4 4.81 15.5 72 PCH98 Chlorella sp. 4-20 2 0.46 0.96 0.30 0.44 13.6 16.6 5.78 7.47
Figures
Figure 1: Effects of medium on specific growth rates; comparison of
WW and BBM at 10 °C (A) and 22 °C (B)
Figure 2: Effects of temperature on specific growth rates; comparison of
10 °C and 22 °C growth in BBM (A) and WW (B)
Figure: 3 Effects of medium on lipid accumulation; comparison of WW
and BBM at 10 °C (A) and 22 °C (B)
Figure: 4 Effects of temperature on lipid accumulation; comparison of
10 °C and 22 °C growth conditions in BBM (A) and WW (B)
Figure: 5 Effect of sampling location on specific growth rates in BBM
Cultures from the St Lawrence (A) and the Laurentian Lakes (B) were grown on BBM at 10 °C and 22 °CFigure 6: Effect of sampling location on specific growth rates in WW
Cultures from the St Lawrence (A) and the Laurentian Lakes (B) were grown on WW at 10 °C and 22 °CFigure 7: Effect of sampling location on lipid accumulation in BBM
Cultures from the St Lawrence (A) and the Laurentian Lakes (B) were grown on BBM at 10 °C and 22 °CFigure: 8 Effect of sampling location on lipid accumulation in WW
Cultures from the St Lawrence (A) and the Laurentian Lakes (B) were grown on WW at 10 °C and 22 °CFigure S1: Growth of the one hundred strains on BBM at 10 °C (A) and
22 °C (B)
Figure S2: Growth of the one hundred strains on WW at 10 °C (A) and
22 °C (B)
Figure S3: Principal Component Analysis of variation in physiological properties with sampling location
The plots on the left show the loadings that lead to the particular principal components examined here. Principal components are combinations of the variables that lead to high correlations. Variables that are close are correlated. Thus PC1 is very closely related to maximum growth on WW at both 10 °C and 22 °C, PC2 is closely related to the percent lipid formed on WW at both 10 °C and 22 °C and PC3 is closely related with maximum growth rate on BBM at 22 °C.