HAL Id: hal-01877119
https://hal.archives-ouvertes.fr/hal-01877119
Submitted on 19 Sep 2018HAL is a multi-disciplinary open access archive for the deposit and dissemination of sci-entific research documents, whether they are pub-lished or not. The documents may come from teaching and research institutions in France or abroad, or from public or private research centers.
L’archive ouverte pluridisciplinaire HAL, est destinée au dépôt et à la diffusion de documents scientifiques de niveau recherche, publiés ou non, émanant des établissements d’enseignement et de recherche français ou étrangers, des laboratoires publics ou privés.
Application of sensitivity analysis in the life cycle design
for the durability of reinforced concrete structures in the
case of XC4 exposure class
van Loc Ta, Tristan Senga Kiessé, Stéphanie Bonnet, Anne Ventura
To cite this version:
van Loc Ta, Tristan Senga Kiessé, Stéphanie Bonnet, Anne Ventura. Application of sensitivity analysis in the life cycle design for the durability of reinforced concrete structures in the case of XC4 exposure class. Cement and Concrete Composites, Elsevier, 2018, 87 (87), pp.53-62. �10.1016/j.cemconcomp.2017.11.024�. �hal-01877119�
1
Application of sensitivity analysis in the life cycle design
1
for the durability of reinforced concrete structures in
2
the case of XC4 exposure class
3
Van-Loc TAa , 1, Tristan SENGA KIESSEb, Stéphanie BONNETc, Anne 4
VENTURAa , d 5
a Université de Nantes, GeM, Institut de Recherche en Génie civil et
6
Mécanique – CNRS UMR 6183 – Chaire Génie Civil Eco-construction,
7
France.
8
b UMR SAS, INRA, Agrocampus Ouest, 35000 Rennes, France.
9
c Université de Nantes, GeM, Institut de Recherche en Génie civil et
10
Mécanique – CNRS UMR 6183, France.
11
d Institut Français Transports Aménagement Réseaux (IFSTTAR – MAST –
12
GPEM), France.
13
Abstract
14
The aim of this study is to develop a new design procedure for the durability 15
of the Reinforced Concrete (RC) structures in aggressive environments. The 16
study approach developed here includes: (i) a qualitative analysis phase to 17
characterize the design parameters and environmental exposure conditions of 18
1 Corresponding author. Tel.: +33 2 72 64 87 61;
2
RC structures; (ii) a quantitative analysis phase, to establish the relationship 19
between service life and design parameters and environmental exposure 20
conditions using the service life prediction model firstly, and then to 21
determine the most influential design parameters on service life using 22
sensitivity analyses; and (iii) a final design phase, to design RC structures 23
using some favorable values of the most influential design parameters firstly, 24
and then to compare the service life thus obtained with that of RC structures 25
designed using a standardized approach. An application is also proposed on 26
simulated RC structure exposed to carbonation in Madrid (Spain). This RC 27
structure follows the recommendations of the European standard EN 206-1 28
for XC4 exposure class. The sensitivity analysis results are discussed in 29
detail including influence trends, importance ranking, non-monotonic effects 30
and parameter interaction influences. The most influential design parameters 31
obtained are cement strength class ( ), water-to-cement ratio ( / ) and 32
cement type ( ). By using / of about 0.4, of about 52.5 MPa and 33
CEM I cement type instead of their limiting value as recommended by EN 34
206-1, the service life of the RC structure is significantly improved. 35
Key words: Carbonation; Durability design; Corrosion; Service life. Morris
36
analysis, Sobol indices.
37
1.
Introduction
38
In the literature, two basic approaches are proposed for the design of the 39
durability of Reinforced Concrete (RC) structures in aggressive 40
3
environments [1]: a prescriptive approach and a performance-based 41
approach. 42
The prescriptive approach is primarily based on the acquired experience in 43
the durability performance of existing RC structures. Because experience is 44
generally insufficient to allow for the quantitative requirements, most of the 45
requirements for durability are formulated in a qualitative and empirical way. 46
In the case of reinforcing steel corrosion due to carbonation or chlorides, the 47
prescriptive approach defines an exposure class and subsequent prescriptions 48
including (i) concrete composition (a maximum water-to-cement ratio, a 49
minimum cement content and a cement type); (ii) a minimum 28-day 50
compressive strength of the concrete; and (iii) a minimum concrete cover 51
depth for service life design [2] [3]. 52
The key feature of the performance-based approach is to assess relevant 53
concrete material properties using some relevant test methods or service life 54
prediction models. This approach can be used to formulate requirements as 55
regards material properties and structure dimensions. In the case of corrosion 56
of reinforcing steel due to carbonation [4] [1] [5] or chlorides [6] [7] [8], the 57
estimation of the deterioration evolution depending on expected influential 58
parameters is mostly performed by applying a probabilistic approach. This 59
estimation makes it possible to formulate requirements for the structural 60
responses depending on the service life design [3]. Then, durability design 61
can be completed in two ways: (i) using a fully probabilistic method, for 62
which the concrete cover depth and the diffusion coefficient of CO2 or
4
chlorides are usually considered as main probabilistic design parameters for 64
the required service life design and the reliability level [4] [1] [5] [6] [7] [8]; 65
and (ii) using the partial factor method to determine the characteristic values 66
and the partial factors for the design parameters [4] [1] [7]. 67
The strength of the prescriptive approach lies in its flexibility to account 68
for experience and its easy application. The obvious weakness of this 69
approach is that: (i) a simple set of general prescriptions cannot be optimal 70
for all the different parts of a structure exposed to different levels of 71
aggressiveness depending on the structure areas [9]; (ii) our understanding 72
of service durability performance of the structure at the design stage must be 73
improved [1]; and (iii) it does not encourage the use of novel materials for 74
durability design. The strength of the performance-based approach, on the 75
other hand, is its relevance for the durability responses so that service life 76
design can be carried out in a more scientific and reliable way. However, two 77
main difficulties must be faced: (i) a better understanding of the deterioration 78
mechanisms must combine the results of both the scientific research with 79
long-term in-situ observations; and (ii) the uncertainty associated with 80
deterioration mechanisms must be properly taken into consideration in the 81
design process. This last issue can be solved by carrying out a sensitivity 82
analysis of service life in relation to modeling parameters. The Sensitivity 83
Analysis (SA) is the study of how the uncertainty of a mathematical model 84
or system (numerical or other systems) results can be apportioned to different 85
sources of uncertainty and variability of the input parameters [10]. In the 86
5
literature, many studies present the SA of the simplified diffusion-based 87
corrosion initiation model of RC structures exposed to chlorides. This 88
analysis is conducted to identify, among the different parameters like 89
concrete cover depth, chloride diffusion coefficient, chloride threshold level, 90
and chloride concentration at the surface, those which are the most 91
significant [11] [12]. Other studies describe the SA of corrosion rate 92
prediction models [13] or simplified carbonation models [14] conducted to 93
classify the different influences of the input parameters. Some authors use 94
the “One At a Time (OAT)” SA method [11] [12], which provides some semi-95
qualitative sensitivity information by varying one parameter at a time while 96
keeping the others constant. Sensitivity is observed graphically. Other 97
authors use the SA method based on the regression analysis [13] [14]. This 98
method quantifies the effect of the input parameters on the model results. 99
It is sometimes difficult to distinguish between prescriptive or 100
performance-based design approaches. For instance, if the existing RC 101
structures on a given project site have achieved the objective set by service 102
life design, then the durability design of new RC structures can rely on the 103
rational analysis of the durability measurements carried out on these RC 104
structures. Consequently, determining whether structure design is 105
specifically based on the prescriptive or the performance-based approach is 106
difficult, in this case. The experimental data on the durability performance 107
of the structures thus collected must be integrated into the different phases 108
of the performance-based approach to determine the preliminary dimensions 109
6
of the structure [3]. Thus, both approaches are useful as regards durability 110
design and are complementary methods in the global design process. 111
The present paper reports a study conducted to develop a new design 112
procedure for the durability of the RC structures in aggressive environments. 113
The procedure discussed here is the result of the combination of both 114
prescriptive and performance-based approaches. Qualitative and quantitative 115
SA methods are integrated into the design procedure to determine durability 116
action levers (refer to definition of “action levers” in Appendix). These are 117
used to design the best durable RC structure. 118
The new design procedure for the durability of RC structures in aggressive 119
environments is presented in Section 2. An application of this procedure to 120
a simulated RC structure exposed to carbonation in Madrid (Spain) is 121
described in Section 3. Some recommendations for the durability design 122
according to EN 2016-1 for XC4 exposure class are discussed in Section 4. 123
2.
Development of the new durability design procedure
124
The durability design procedure proposed here includes: (1) a qualitative 125
analysis, (2) a quantitative analysis, and (3) a final design procedure (Figure 126
1). The purpose of the qualitative analysis is to determine the preliminary
127
dimensions of a RC structure at a general level within the context of 128
aggressive environments. It also includes the characterizations of the design 129
parameters and the environmental exposure conditions. This analysis is 130
carried out using a prescriptive approach. The quantitative analysis aims at 131
7
establishing a relationship between the aggressive environment and the 132
service life of structure using a service life prediction model [4]. The purpose 133
of the quantitative analysis is to determine the action levers by applying the 134
SA method to the service life prediction model. The final design phase 135
consists in using the action levers to redesign the RC structure properties in 136
order to achieve the longest service life possible. This phase also includes a 137
comparison between the service life of a structure designed using the 138
procedure proposed here and that of a structure designed using the 139
recommended limiting values of EN 206-1 [15]. 140
141
Figure 1. Design procedure for durability of RC structures in aggressive
142
environments.
143
In order to determine the action levers, suitable SA methods must be 144
selected. They must provide the trend of action levers in relation to the 145
service life, the quantization of their influence and the interactions with other 146
2/ QUANTITATIVE ANALYSIS o Establishment of the
relationship between the service life and input parameters based on the service life prediction model. o Determination of the
action levers for the service life using sensitivity analysis. 1/ QUALITATIVE ANALYSIS
o Preliminary design (characterizations of input parameters).
3/ FINAL DESIGN
o Detailed design finalization by setting the action levers at their most
favorable value.
o Validation of final results
(comparison with the standardized approach).
8
parameters. Thus, the SA methods used in the previous studies [11] [12] [13] 147
[14] are not relevant in this context. Consequently, a combination of two SA 148
methods, Sobol’s quantitative method [16] and Morris’ qualitative method 149
[17] is chosen. This combination has been previously used for the same 150
purpose in environmental design using Life Cycle Assessment (LCA) [18] 151
[19]. It can provide complementary information on the influence of the input 152
parameters on the model results in the decision-making process. Sobol’s 153
method is used to quantify the input parameters contribution to model result 154
variations. Morris’ method, on the other hand, provides additional 155
information on the trend of the input parameters. Both methods require that 156
all the input parameters are independent of one another. Both methods are 157
summarized in the next subsections. 158
2.1.
Sobol’s quantitative sensitivity analysis
159
Sobol’s method [16] is based on the analysis of the variance decomposition 160
of the model in order to quantify the contribution of variability of the input 161
parameter to the total variance of the output . The individual contribution 162
of input parameter is measured using the first order sensitivity index ( ) 163
such as: 164
= ∣ (1)
where: ∣ is the conditional variance of produced by the
165
variation of , is the total variance of .
9
The individual Sobol indices lie in the interval [0-1]. Moreover, the overall 167
output sensitivity to the parameter (i.e., including first and higher order 168
effects (interaction) of ) can be measured using the total sensitivity index 169
( ) [20] as: 170
= 1 − ∣ (2)
where: ∣ is the conditional variance of produced by the
171
variation of all the input parameters except .
172
Sobol’s method requires to have characterized the Probability Density 173
Function (PDF) of each input parameter. The Monte Carlo simulations are 174
carried out by varying simultaneously all the input parameters according to 175
their PDF and by calculating the associated model results. In this study, 176
and are calculated. 177
2.2.
Morris’s qualitative sensitivity analysis
178
Morris’ method [17] is one of the most popular screening method, which 179
consists in developing a randomized experimental design process by varying 180
one parameter while keeping the others constant (OAT method) over a certain 181
number of repetitions ( = 1,2, … , ). Then, the variation coefficients, called 182
the elementary effects ( # ), are obtained as: 183
10
# ≈ %# + ' . ∆ − % #
∆ (3)
where: ∆ is a pre-defined step, ' is a vector of zero but with *-th equal ±1.
184
The mean value (+ ) of the elementary effects is calculated to determine the 185
trend of input parameter . The algebraic sign of + indicates increasing 186
(positive sign) or decreasing (negative sign) trends of the model output 187
related to . The standard deviation value (, ) of the elementary effects is 188
the measure of the sum of all the interactions of with the other parameters 189
and of all non-linear influences. We find: 190 + =1- # . #/0 (4) , = 1 − 1 - 21 # − + 34 . #/0 (5)
In the case of non-monotonic functions, the elementary effects can have an 191
opposite sign for the considered repetition, which can result in a + close to 192
zero if the parameter is influential. In order to prevent this, Campolongo et 193
al. [21] recommend to use the mean value of the absolute value (+∗) of the 194
elementary effects rather than the usual + . 195
+∗ =1-6. # 6 #/0
11
The information about the algebraic sign of + is lost when using +∗. 196
However, it is a good indicator for the assessment of the importance of the 197
input parameters in relation to each other. Morris’ method requires a local 198
interval range (minimum and maximum value) for each input parameter. The 199
number of repetitions ranges from 4 to 10 [22]. In this study, + , +∗ and , 200
are calculated. 201
Throughout the rest of the work, Morris and Sobol methods serve to identify 202
input parameters that are major contributors to the variability of service life. 203
More specifically, the controllable parameters related to technological 204
aspects (e.g., concrete mix, size of structure), i.e., the “technological 205
parameters”, are considered as action levers if they are major contributors to 206
the service life. 207
2.3.
Identification of action levers using sensitivity indices
208
Based on the Sobol indices, the technological parameters are identified as 209
action levers, if the value of is higher than 10%. Moreover, if the value of 210
is lower than 10% but the difference ( − ) is high, i.e., assumed to be 211
greater than 10%, they can also be considered as potential action levers [18] 212
[19]. This means that parameter is not individually influential but has a 213
non-negligible global contribution because of its interaction with the other 214
parameters. As regards the Morris indices, the parameters with a higher +∗ 215
are considered as potential action levers [17]. If the parameters satisfy the 216
condition , ≥ 7+ 7, they are considered to have a non-monotonic effect. In 217
12
contrast, non-influential input parameter is assumed to have indices 218
lower than 10% and +∗ low in relation to other indices +8,8∗ of input 219
parameters 8,8 . Recall that Morris indices +∗ and + have the same order of 220
magnitude than the model response while the first order Sobol indices are 221
normalized and lie in the interval [0-1]. 222
3.
Case study
223
3.1.
Presentation of the case study
224
The case study studied here consists of a RC structure subjected to 225
carbonation. The structure is assumed to be located in Madrid (Spain) 226
because this location presents optimal environmental conditions for 227
carbonation of concrete [23] [24]. Madrid, indeed, is a place with a high level 228
of carbon dioxide [25] and with an average relative external humidity of 229
about 0.56 [26]. The considered structure follows the recommendations of 230
EN 206-1 for XC4 exposure class [15]: concrete is exposed to the air and the 231
structure is not sheltered from rain. Carbonation is the only alteration 232
phenomenon of RC structure considered in this paper. The objective here is 233
to identify the action levers affecting service life to obtain the longest service 234
life possible by setting the identified action levers at their most favorable 235
value. 236
The service life of a structural component is the period after construction, 237
during which all the structure properties, when routinely maintained, are 238
13
higher than the minimum acceptable values [2]. Tuutti [27] proposed a 239
simplified model for predicting the service life of RC structures, considering 240
the degradation due to carbonation induced corrosion. Service life is divided 241
into two periods: initiation period and propagation period as shown in Figure 242
2. There are two periods because the mechanisms involved are different in
243
physical-chemical terms. The initiation period corresponds to the penetration 244
of CO2 into the concrete cover until the carbonation front reaches the
245
reinforced layer. The propagation period includes (i) steel corrosion; (ii) 246
cross section loss; (iii) concrete surface cracking; and (iv) spalling of 247
concrete cover. 248
249
Figure 2. Tuuti’s service life prediction model [27] .
250
Our case study deals with the initiation period only. The service life of RC 251
structure is limited to the corrosion initiation period. Thus, a model for the 252 Time D et er io ra ti on Penetration of CO2 Initation Propagation Service life
14
initiation period is required: that model calculates at any time the 253
carbonation depth within concrete. 254
3.2.
Qualitative analysis: characterization of input parameters
255
The service life considered here is predicted using the carbonation model 256
recently developed by Ta et al. [28] (Figure 3). This carbonation model is 257
validated using data from the literature on short and long-term natural 258
carbonation exposure conditions. Most of the experimental data concern 259
CEM I, CEM II, CEM III cement types. The prediction of this carbonation 260
model for estimation of carbonation depth is more accurate than Papadakis’ 261
model [29] and Yang’s model [30]. This model takes many influencing 262
design parameters of the carbonation process into account and predicts the 263
natural carbonation depth. It is based on the analytical solution of Fick’s law 264
given by: 265
9 = :2 × <=>?× @4× √B (7)
where: 9 (m) is the carbonation depth within concrete, <=>? (m2/s) is the CO2
266
diffusion coefficient of concrete, @4 (kg/m3) is the CO2 concentration in the
267
atmosphere, (kg/m3) is the amount of CO
2 absorbed in a unit volume of
268
concrete, B (s) is the exposure time.
15
270
Figure 3. Carbonation model presented in [28] (input parameters are
271
detailed in the text).
272
When the carbonation depth is equal to the concrete cover depth (C), i.e., 273
9 = C, the corrosion initiation period ends. The steel reinforcement could be 274 9 = :2. <=>?. @4. √B = 0.75 × × @ × GH8I# .×44 56 <=>4L?= 10MN× 10MO.O4PQR = 7.84 21 + . T1000 + UV8.. T 3 4 <=>?= <=>4L?× WX × Y × Z + [ \ × ZU, \ × B ZU, \ = Z \ ]Z0.93 − 3.95 × 0.94 0OO` = \ × U − UV8. 1000 + T a 0.L U = UV8.+ − 0.231000 B =1.9 × 10¹⁰MO.O4PQM4R + b1 −1.9 × 10¹⁰MO.O4PQM4Rc :0.01 × B28 WX = 1 − WX 4. WX4.d
Y = '9e f4700 Y − 293293Y g _i 9 (mm) UV8. (n.u.) 31.5 0.015
16 0.023
8 0.035
Linear interpolation for intermediate value Z + [ \ = Z + [\MO.0
16
then corroded with the presence of O2, humidity and temperature as defined
275
by Tuuti’s service life prediction model (Figure 2). Service life (Bm .) can be 276 written as: 277 Bm .= C 2× 2 × < @2× @2 (8)
The purpose then is to design a concrete structure with a maximum service 278
life value Bm .. 279
Many parameters are required for the calculation of <=>? and as shown in 280
Figure 3. For the application of Sobol and Morris’ methods to the
281
determination of the sensitivity of Bm . to input parameters, we use only the 282
expression of <=>? and in relation to the independent parameters. An 283
independent parameter does have a relationship with other independent 284
parameters. The dependent parameters are expressed through the independent 285
parameters. The time dependency of the input parameters is not taken into 286
account. Consequently, the expression of Bm . takes the form: 287
Bm .= , / , /[, _i 9, , , C, B , Y, WX, @4 (9)
or 288
Bm .= 1, 2, 3, 4, 5, 6, 7, 8, 9, 10, 11 (10)
where: (kg/m3 of concrete) is the amount of cement content, / (n.u.)
289
(n.u. = no unit) is the water-to-cement ratio, /[ (n.u.) is the sand-to-gravel
290
ratio, _i 9 (mm) is the maximum aggregate size, (n.u.) is the cement
17
type, (MPa) is the cement strength class, B (days) is the initial curing
292
period, Y (K) is the ambient temperature, WX (n.u.) is the relative external
293
humidity.
294
The input parameters, including the technological and environmental 295
parameters (refer to definition of “technological and environmental 296
parameters” in Appendix), characterized by determining the variability range 297
and the PDF of each parameter as summarized in Table 1. The technological 298
parameters are characterized by the limiting values recommended by EN 206-299
1 [15] for XC4 exposure class and the statistical analysis of the studies 300
addressing the problem of concrete carbonation found in the literature. To 301
provide the action levers, a uniform (discrete or continue) distribution is 302
usually set for the technological parameters because they are chosen by the 303
designer. Thus, all the values within the distribution interval are considered 304
equally probable. The interval is determined by minimum and maximum 305
values. 306
The environmental parameters are characterized from weather data [26], 307
which include the ambient temperature (Y) and the relative external humidity 308
(WX). The CO2 concentration in the atmosphere ( @4) is taken from [25].
309
Table 1. Input parameter characterization.
310
Parameter Unit Probability Density Function (PDF) Reference Technological parameters
18
0 kg/m3 U (min = 300; mean = 404.5; max = 509) [15] 4 / n.u. U (min = 0.4; mean = 0.45; max = 0.5) [15] n /[ n.u. U (min = 0.5; mean = 1.3; max = 2.1)
o _i 9 mm U (min = 20 ; mean = 26; max = 32) [15]
Group 2: cement
P n.u. dU (10 cement types) [15] d MPa dU (3 strength classes) [15]
Group 3: concrete cover depth and initial curing period
N C m U (min = 0.05; mean = 0.065; max = 0.08) [31] [32] L B days U (min = 1; mean = 2; max = 3) [33] Environmental parameters
p Y K trN (mean = 287.4; CoV = 0.03;
min = 272.4; max = 309.1)
[26]
0O WX n.u. trN (mean = 0.56; CoV = 0.33;
min = 0.2; max = 0.88) [26] 00 @4 ppm trN (mean = 380; CoV = 0.05; min = 304.6; max = 456.8) [25] Notes:
1. CoV = Coefficient of Variation; trN = truncated Normal distribution; U = Uniform distribution; dU = discrete Uniform distribution.
2. The variability range of 0, 4 and n parameters also comes from the statistical analysis conducted by some experimental investigations found in the literature (detailed in the text).
Group 1: concrete mix
311
The requirements for concrete of EN 206-1 [15] for XC4 exposure class are 312
a maximum water-to-cement ratio ( / ) of about 0.5, a minimum amount of 313
19
cement content ( ) of about 300 kg/m3 and maximum aggregate size ( _i 9)
314
within the range 20-32 mm. Previous studies [4] [34] [35] [36] reveal that (i) 315
CEM I cement type concrete with a water-to-cement ratio ( / ) lower than 316
0.4 has very high carbonation resistance; and (ii) concrete using CEM I 317
cement type has higher carbonation resistance than the other cement types 318
containing additions. In this work, we thus assume the minimum / of 319
about 0.4 for cement types considered in order to observe the carbonation 320
phenomenon; however, the carbonation phenomenon can appear for / 321
values lower than 0.4 for other cement types. Moreover, concrete casted with 322
such / is uncommon. Based on the statistical analysis of seventeen 323
experimental investigations on concrete carbonation [37] [5] [38] [39] [40] 324
[41] [42] [43] [44] [45] [24] [46] [47] [48] [1] [49] [50], the maximum 325
cement content ( ) is about 509 kg/m3 and the sand-to-gravel ratio ( /[)
326
varies between 0.5 and 2.1. 327
Group 2: cement
328
In the carbonation model proposed by Ta et al. [28], the cement type ( ) 329
is considered through the following three parameters: amount of Portland 330
clinker inside cement, amount of calcium oxide per weight of cement and 331
cement density. Therefore, among the 27 cement products presented in [51], 332
ten cement types are considered: CEM I; CEM II/A; CEM II/B; CEM III/A; 333
CEM III/B; CEM III/C; CEM IV/A; CEM IV/B; CEM V/A; and CEM V/B. 334
The characteristics of these cements are presented in Appendix (Table A1). 335
20
Cement strength class ( ) of all these cement types is available for strength 336
classes of 32.5 MPa, 42.5 MPa and 52.5 MPa. 337
Group 3: concrete cover depth and initial curing period
338
The concrete cover depth (C) must have a minimum thickness to protect the 339
steel reinforcements from the CO2 attack and to prevent the corrosion of steel
340
reinforcements [52]. This design parameter varies according to the exposure 341
class, the quality of construction and the intended service life [52]. 342
Combined to the requirements for concrete of EN 206-1 [15] for XC4 343
exposure class, the minimum recommended concrete cover depth (C) ranges 344
from about 0.05 m [31] to 0.08 m [32] for structure design with an expected 345
100-year service life. Consequently, C can vary between 0.05 and 0.08 m in 346
this study. 347
Because of a limited construction time, the initial curing period (B ) varies 348
between 1 day and 3 days [33]. 349
3.3.
Quantitative analysis
350
3.3.1.
Service life prediction and sensitivity analysis
351
Eq. (10) is used to establish the relationship between the service life (Bm .)
352
and the input parameters presented in Table 1. In Sobol’ method, the Bm . 353
values are simulated using Eq. (10) by varying all input parameters 354
simultaneously according to their PDF (Table 1). 355
21
The first order Sobol sensitivity index ( ) (Eq. (1)) and the total Sobol 356
sensitivity index ( ) (Eq. (2)) are calculated as described in Section 2.3. 357
They are calculated by means of a bootstrap method with 500 replications 358
from a half-sample (5,000) taken from an initial sample of about 10,000 as 359
recommended in [18]. 360
In Morris’ method, the Bm . values are simulated using Eq. (10) by varying 361
each input parameter one at a time. Then the mean value (+ ) (Eq. (4)), 362
standard deviation value (, ) (Eq. (5)) and mean value of the absolute value 363
(+∗) (Eq. (6)) of the elementary effects are calculated as described in Section 364
2.3. They are calculated by means of discretization of the input parameters
365
in 10 values with a prescribed number of trajectories of about 30 as 366
recommended in [18]. 367
3.3.2.
Determination of the action levers
368
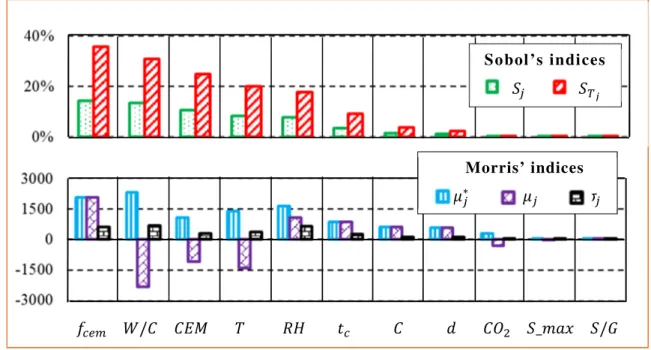
Our results shown in Figure 4 are related to the case study. It is important 369
to note that SA results depend on both PDF of input parameters given in 370
Table 1 and on carbonation model chosen.
371
Figure 4 displays the SA results.
22
373
Figure 4. Sobol and Morris sensitivity indices.
374
Figure 4 shows that cement strength class ( ), water-to-cement ratio
375
( / ), cement type ( ), ambient temperature (Y) and relative external 376
humidity (WX) (in descending rank) are the most influential parameters 377
because their and +∗ values are the highest. The difference − is 378
around 22% for cement strength class ( ), 17% for water-to-cement ratio 379
( / ), 14% for cement type ( ), 12% for ambient temperature (Y) and 380
10% for relative external humidity (WX). This means that their interactions 381
with the other parameters are important. Parameters , / and are 382
considered the most influent with a value above 10%. They are thus 383
technological parameters (i.e., controllable parameters) identified as action 384
levers. Y and WX are environmental parameters (uncontrollable parameters) 385
that are uncertain. The less-influential parameters ( < 10% and low +∗) are 386 / Y WX B C @4 _i 9 /[ Sobol’s indices Morris’ indices +∗ + ,
23
initial curing period (B ), cement content ( ), concrete cover depth (C), CO2
387
concentration in the air ( @4), maximum aggregate size ( _i 9) and sand-to-388
gravel ratio ( /[). Based on the algebraic sign of + , we observe that an 389
increase in WX, , C, B , and /[ and a decrease in / , _i 9, Y, and @4 390
result in the increase of Bm .. All parameters have , /+∗ within the interval 391
[0.19 – 0.39]. It indicates that the effects between parameter are monotonic. 392
Because and are discrete parameters, their algebraic sign of + is 393
not significant. Finding favorable value requires testing all of the values of 394
and . The simulation results are displayed in Figure 5. We plot the 395
service life on log scale versus clinker content. The service life is represented 396
by its mean value and standard deviation. 397
398
Figure 5. Comparison of service lives of cement strength classes and
399 cement types. 400 0 0.1 0.2 0.3 0.4 0.5 0.6 0.7 0.8 0.9 1 1 1.5 2 2.5 3 3.5 4 4.5 5 5.5
Clinker content (n.u.)
lo g 1 0 (s er v ic e l if e ) (y e a rs ) 100 years CEM I CEM II/A CEM II/B CEM III/A CEM III/B
CEM III/C CEM IV/B CEM IV/A
CEM V/A CEM V/B
fcem = 32.5 MPa fcem = 42.5 MPa fcem = 52.5 MPa
24
The highest service life is obtained with cement strength class ( ) 52.5 401
MPa, followed by 42.5 MPa and 32.5 MPa. The CEM I and CEM II/B cement 402
types are the most favorable to increase the service life with 52.5 MPa. 403
The CEM II/B has lower environmental impacts. These findings are in line 404
with previous study [38]. For both 42.5 and 52.5 MPa we found that 405
service life is higher than 100 years whatever the cement type. However, 406
none of the service lives considering standard deviation obtained with 407
32.5 MPa is higher than 100 years. 408
3.3.3.
Comparison of the sensitivity analysis results to the
409
literature
410
This section compares our SA results with the literature. Cement strength 411
class ( ) and water-to-cement ratio ( / ), two technological parameters, 412
are key parameters for the determination of the concrete porosity and the 28-413
day compressive strength of concrete ( ) [9] [53]. Both values, indeed, are 414
important indicators of the evaluation of the resistance to penetration of 415
carbon dioxide into concrete [54]. Higher cement strength class ( ) and a 416
decrease in water-to-cement ratio ( / ) result in an increase of . For a 417
given water-to-cement ratio ( / ), it has been shown that service life (Bm .) 418
increases by 1.89 times when using a CEM II/B cement with a cement 419
strength class ( ) value about of 42.5 MPa instead of 32.5 MPa [55]. 420
Furthermore, the service life (Bm .) increases by 2.49 times when using a 421
water-to-cement ratio ( / ) of about 0.4 instead of 0.43, according to the 422
25
literature [56]. Previous experimental results [55] [56] have confirmed that 423
service life (Bm .) is more sensitive to cement strength class ( ) and water-424
to-cement ratio ( / ). In addition, a survey of the literature also reveals that 425
the carbonation resistance of concrete depends on the amount of Portland 426
clinker cement in concrete [57]. When using a cement preparation containing 427
more Portland clinker for concrete composition, first, the 28-day 428
compressive strength of concrete ( ) is higher and the amount of Ca(OH)2
429
and CSH increases [58]. Both observations increase concrete carbonation 430
resistance. Finally, the other technological parameters considered here 431
demonstrate a negligible contribution to the variations of service life (Bm .). 432
An increase in cement content ( ), obviously causes the presence of higher 433
amounts of Calcium hydroxide (Ca(OH)2) and Calcium-Silicate-Hydrate
434
(CSH) inside the concrete, which lengthens the time of the neutralization 435
reaction between Ca(OH)2 and CSH and CO2. The carbonation resistance is
436
thus higher. An increase in maximum aggregate size ( _i 9) generates a 437
decrease in the carbonation resistance. The use of a bigger aggregate size, 438
indeed, induces (i) a reduction in the tortuosity of the flow path, which 439
increases permeability, and (ii) a possibility of internal water bleeding, 440
which increases concrete porosity [59]. As regards the initial curing period 441
(B ), many previous studies [56] [60] [41] have underlined that the longer the 442
curing period is, the higher the resistance of concrete to carbonation is. An 443
increase in B provides a higher degree of hydration and a lower concrete 444
porosity. As regards the concrete cover depth (C), it is widely accepted that 445
service life (Bm .) is proportional to the square of concrete cover depth (C) as 446
26
shown in Eq. (8). An increase in sand-to-gravel ratio ( /[) in one cubic meter 447
of concrete mixed increases sand content, which is responsible for the 448
reduction in air permeability. There also, the carbonation resistance is 449
increased [59]. 450
As regards the environmental parameters, previous experimental results 451
[23] [24] have shown that the highest carbonation rate is observed for a 452
relative external humidity (WX) around 57%. We observe that the carbonation 453
rate increases when relative external humidity (WX) increases from 0% to 454
57%, and decreases when relative external humidity (WX) increases from 57% 455
to 100%. This is consistent and corresponds to the highest , /+∗ of relative 456
external humidity (WX) (Figure 4) that is highlighted by the present 457
sensitivity analysis results. The carbonation rate also increases with 458
increasing ambient temperature (Y) due to increased molecular activity [61] 459
[62]. Finally, the carbonation depth is proportional to the square root of 460
carbon dioxide concentration in the air ( @4) (Eq. (7)). The presence of 461
carbon dioxide is necessary for the carbonation of concrete. However, 462
relative external humidity (WX) and ambient temperature (Y) play the most 463
important part in the carbonation rate within all the environmental 464
parameters. 465
The influence trend of parameters is consistent with the literature. The 466
important influence of parameters corresponding to their range variation 467
studied corroborates with previous experimental studies. 468
27
3.4.
Final design
469
Based on the SA results, the action levers of the case study are cement 470
strength class ( ), water-to-cement ratio ( / ) and cement type ( ). 471
The final design is carried out by setting the action lever at their most 472
favorable value to increase the service life (Bm .) (Table 2). As found 473
previously, the most favorable values of the three action levers consist of 474
minimum / (about 0.4), higher 52.5 MPa and CEM I or CEM II/B 475
cement type (Figure 5). The other parameters are randomly generated 476
according to their PDF presented in Table 1. This scenario is called 477
recommended scenario.
478
A reference scenario, called EN 206-1 scenario, is also developed by setting 479
the action levers at the limiting values recommended by EN 206-1 [15], i.e., 480
/ equal to 0.5, 32.5 MPa and CEM I cement type (Table 2). The other 481
parameters are randomly generated according to their PDF as with the 482
recommended scenario.
483
We compare the distribution of Bm . of EN 206-1 scenario and recommended 484
scenario with CEM I cement type in Figure 6. The recommended scenario
485
with CEM II/B cement type is not illustrated in Figure 6 as its Bm . 486
distribution is very close to that of CEM I cement type. The mean Bm . of 487
recommended scenario with CEM II/B cement type is of about 9,253 years.
488
The distribution of Bm . is simulated using a Monte Carlo simulation with a 489
sample size of 100,000. 490
28
Table 2. Values of action levers for both designed scenarios.
491
Parameter Symbol Unit Recommended scenario
EN 206-1 scenario
Water-to-cement ratio / n.u. 0.4 0.5 Cement strength class MPa 52.5 32.5
Cement type n.u. CEM I CEM I
492
Figure 6. Comparison between service life (Bm .) distributions of both
493
designed scenarios.
494
As shown in Figure 6, the Bm . of the recommended scenario is 105 times 495
higher than that of the EN 206-1 scenario. Both distributions of probabilities 496
are completely separated. The calculated differences are significant. The 497
simulation results confirmed , / as being effective action levers. The 498
recommended scenario corresponds to concrete with higher carbonation
499
resistance. We consider the high concrete cover depth (C) between 0.05 m 500
and 0.08 m, that is another reason for finding the mean service life of the 501 1 2 3 4 5 0 100 200 300 400 500 600
log10(tser) (years)
F re q u e n c y ( n .u .)
EN 206-1 scenario (mean tser = 93 years) Recommended scenario (mean tser = 9766 years)
29
recommended scenario of about 9,766 years. This finding corroborates with
502
previously experimental results [4] [34] [35] [36]. For example, Houst et al. 503
[34] reveal that more than five years of exposure to the atmosphere of CO2,
504
concrete with / = 0.3 is carbonated only to a depth of 0.2 to 0.3 mm. 505
Another study on ultra-high performance fiber-reinforced concrete (porosity 506
about 5%) [63] shows that the Bm . is more than 12,000 years. One can assume 507
that this higher Bm . is not only due to the individual influence of action levers 508
but also to the non-negligible interactions between the action levers and other 509
parameters (revealed previously through the differences − ≥ 10%). 510
The simulation results of the recommended scenario reveal that a durable 511
RC structure can be obtained by setting the action levers at their most 512
favorable values. The durable RC structure is independent on the values of 513
the other technological parameters, which are simulated randomly within 514
their variability range given in Table 1. In short, if the RC structure is 515
designed using the recommended scenario, the risk for corrosion of 516
reinforcing steels due to carbonation is eliminated throughout the 100-year 517
service life design. In addition, concretes with 52.5MPa and with / 518
of about 0.4 are appropriate for the other cement types (Figure 5). On the 519
contrary, if the RC structure is designed by setting the action levers at their 520
limiting values as recommended by EN 206-1 [15], a maintenance system 521
could be established in order to ensure the intended 100-year service life. 522
30
3.5.
Advantages and limits of the design approach
523
In this particular case, the cement content ( ) does not individually 524
contribute to service life (with around 1%), i.e., the service life (Bm .) is 525
independent of cement content ( ) for a given water-to-cement ratio ( / ). 526
A previous study has revealed that the carbonation of concrete is independent 527
of cement content ( ) (from 221 to 450 kg/m3) for a given water-to-cement
528
ratio ( / ) [64]. The present finding, achieved in association with the 529
literature, raises the problem of attempting to impose a minimum cement 530
content ( ) of 300 kg/m3 for XC4 exposure class in EN 206-1 [15]. The model
531
developed does not consider that a high cement content ( ) may enhance the 532
risk of cracking because of the heat of hydration or the drying shrinkage in 533
the concrete cover. Both can result in a poor carbonation resistance of the 534
concrete cover. Furthermore, from the point of view of the environmental 535
impacts of the concrete, cement, among other constituents of concrete, is 536
mainly responsible for the release of a huge amount of CO2 during the
537
production [65]. Consequently, in the case of an XC4 exposure class, the 538
requirement for the minimum in EN 206-1 [15] should be re-examined 539
whereas a maximum limit of within the mix should also be specified. 540
Our approach is a helpful tool in the life cycle design for the durability of 541
RC structures. Our approach aims identifying action levers for increasing 542
service life. Engineering designers easily increase the service life by 543
focusing on effective action levers. 544
31
Results of our case study are related both to the carbonation model chosen 545
and to PDF of input parameters. If we use another range variability of input 546
parameters, our results would be changed [66]. However, our approach is 547
general and can be adapted to various service life models. 548
In this study, carbonation is the only alteration phenomenon of RC structure 549
that is considered. However, concrete carbonation can be coupled with other 550
severe deteriorations leading to accelerate its degradation, e.g., the presence 551
of a small amount of chlorides significantly increases the corrosion risk in 552
carbonated mortars [67]. In that situation, the combined effects of various 553
alteration mechanisms integrated in service life model. 554
Finally, this study focuses on individual input parameters that are action 555
levers on the improvement of service life of RC structures. However, 556
interactions between two or more input parameters were shown to be also 557
influential on service life prediction and merit further investigations. 558
4.
Summary and conclusion
559
The present study was conducted to develop a new design procedure for the 560
durability of RC structures through resistance to carbonation induced 561
corrosion. This innovative approach consists in combining the techniques of 562
the prescriptive and performance-based approaches and in integrating the 563
sensitivity analysis of service life in the design stage. The durability design 564
phase has focused on the most influential parameters with a view to setting 565
32
them at their most favorable value. With suitable calculation tools, this 566
proposed procedure will be easy to use by designers. 567
Through the case study presented here, we found that cement strength class 568
( ), water-to-cement ratio ( / ) and cement type ( ) are action levers. 569
Design engineers may take these action levers carefully into account during 570
the durability design step of concrete exposed to carbonation. When setting 571
the action levers at their most favorable values instead of their limiting 572
values as recommended by EN 206-1, the service life is significantly 573
improved. The requirement for minimum cement content ( ) in EN 206-1 for 574
XC4 exposure class should be re-examined in order to reduce concrete costs 575
and environmental impacts. The most influential parameters, including / , 576
, , ambient temperature (Y) and relative external humidity (WX), 577
should therefore be carefully considered in future research works conducted 578
to address the problem of carbonation-induced corrosion damage modeling 579
in RC structures. 580
More research work needs to be carried out to investigate the interaction 581
influences between the parameters. For instance, in the case study presented, 582
the identified action levers have strong interactions with the other 583
parameters. These interactions, however, have not been examined here. The 584
results of studies addressing the problem of interactions between parameters 585
could additionally enhance the durability of RC structures. We are confident 586
that this finding will serve as a basis for future theoretical and experimental 587
works. 588
33
Acknowledgements
589
Funds for the research and education chair of civil engineering and eco-590
construction were provided by the Chamber of Trade and Industry of Nantes 591
and Nazaire cities, the CARENE (urban agglomeration of Saint-592
Nazaire), Charier, Architectes Ingénieurs Associés, Vinci construction, the 593
Regional Federation of Buildings, and the Regional Federation of Public 594
Works. Donators have had no involvement in the research design, the writing 595
and the decision to submit this article. The authors would like to thank them 596
all for their financial support. 597
34
Reference
598
[1] P. F. Marques, C. Chastre, and Â. Nunes, “Carbonation service life 599
modelling of RC structures for concrete with Portland and blended 600
cements,” Cem. Concr. Compos., vol. 37, pp. 171–184, Mar. 2013. 601
[2] EN 1990, “Eurocode - Basis of structural design.” European committee 602
for standardization, 2002. 603
[3] A. Sarja, “Durability design of concrete structures—Committee report 604
130-CSL,” Mater. Struct., vol. 33, no. 1, pp. 14–20, 2000. 605
[4] fib CEB-FIP, Ed., Model code for service life design. Lausanne: fib, 606
2006. 607
[5] K. Y. Ann, S.-W. Pack, J.-P. Hwang, H.-W. Song, and S.-H. Kim, 608
“Service life prediction of a concrete bridge structure subjected to 609
carbonation,” Constr. Build. Mater., vol. 24, no. 8, pp. 1494–1501, Aug. 610
2010. 611
[6] A. Duan, J.-G. Dai, and W. Jin, “Probabilistic approach for durability 612
design of concrete structures in marine environments,” J. Mater. Civ. 613
Eng., vol. 27, no. 2, 2015.
614
[7] Q. Li, K. Li, X. Zhou, Q. Zhang, and Z. Fan, “Model-based durability 615
design of concrete structures in Hong Kong–Zhuhai–Macau sea link 616
project,” Struct. Saf., vol. 53, pp. 1–12, Mar. 2015. 617
[8] P. C. Ryan and A. J. O’Connor, “Probabilistic analysis of the time to 618
chloride induced corrosion for different Self-Compacting Concretes,” 619
Constr. Build. Mater., vol. 47, pp. 1106–1116, Oct. 2013.
620
[9] L. Bertolini, “Steel corrosion and service life of reinforced concrete 621
structures,” Struct. Infrastruct. Eng., vol. 4, no. 2, pp. 123–137, Apr. 622
2008. 623
[10] “Sensitivity Analysis - EU Science Hub - European Commission,” EU 624
Science Hub, 12-May-2015. [Online]. Available:
625
https://ec.europa.eu/jrc/en/samo. [Accessed: 16-Nov-2016]. 626
[11] J. Zhang and Z. Lounis, “Sensitivity analysis of simplified diffusion-627
based corrosion initiation model of concrete structures exposed to 628
chlorides,” Cem. Concr. Res., vol. 36, no. 7, pp. 1312–1323, Jul. 2006. 629
[12] A. Boddy, E. Bentz, M. D. A. Thomas, and R. D. Hooton, “An overview 630
and sensitivity study of a multimechanistic chloride transport model,” 631
Cem. Concr. Res., vol. 29, no. 6, pp. 827–837, 1999.
35
[13] K. Siamphukdee, F. Collins, and R. Zou, “Sensitivity Analysis of 633
Corrosion Rate Prediction Models Utilized for Reinforced Concrete 634
Affected by Chloride,” J. Mater. Eng. Perform., vol. 22, no. 6, pp. 1530– 635
1540, Jun. 2013. 636
[14] N. R. Ravahatra, T. De Larrard, F. Duprat, E. Bastidas-Arteaga, and F. 637
Schoefs, “Sensitivity analysis of simplified models of carbonation-638
extension in spatial variability-updating through Bayesian network,” in 639
Proceedings of the 2nd International Symposium on Uncertainty
640
Quantification and Stochastic Modeling, 2014.
641
[15] European Standard EN 206-1, “Concrete-Part 1: Specification, 642
performance, production and conformity.” 2007. 643
[16] I. M. Sobol, “Global sensitivity indices for nonlinear mathematical 644
models and their Monte Carlo estimates,” Math. Comput. Simul., vol. 645
55, no. 1, pp. 271–280, 2001. 646
[17] M. D. Morris, “Factorial Sampling Plans for Preliminary Computational 647
Experiments,” Technometrics, vol. 33, no. 2, pp. 161–174, May 1991. 648
[18] Andrianandraina, A. Ventura, T. Senga Kiessé, B. Cazacliu, R. Idir, and 649
H. M. G. van der Werf, “Sensitivity Analysis of Environmental Process 650
Modeling in a Life Cycle Context: A Case Study of Hemp Crop 651
Production: Environmental Process Modeling in a Life Cycle Context,” 652
J. Ind. Ecol., vol. 19, no. 6, pp. 978–993, Dec. 2015.
653
[19] T. Senga Kiessé, A. Ventura, H. M. G. van der Werf, B. Cazacliu, R. 654
Idir, and Andrianandraina, “Introducing economic actors and their 655
possibilities for action in LCA using sensitivity analysis: Application to 656
hemp-based insulation products for building applications,” J. Clean. 657
Prod., Oct. 2016.
658
[20] T. Homma and A. Saltelli, “Importance measures in global sensitivity 659
analysis of nonlinear models,” Reliab. Eng. Syst. Saf., vol. 52, pp. 1–17, 660
1996. 661
[21] F. Campolongo, J. Cariboni, and A. Saltelli, “An effective screening 662
design for sensitivity analysis of large models,” Environ. Model. Softw., 663
vol. 22, no. 10, pp. 1509–1518, Oct. 2007. 664
[22] A. Saltelli, S. Tarantola, and M. Ratto, Sensitivity analysis in pratice: A 665
guide to assessing scientific models, WILEY. 2004.
666
[23] L. De Ceukelaire and D. Van Nieuwenburg, “Accelerated carbonation of 667
a blast-furnace cement concrete,” Cem. Concr. Res., vol. 23, pp. 442– 668
452, 1993. 669
36
[24] B. G. Salvoldi, H. Beushausen, and M. G. Alexander, “Oxygen 670
permeability of concrete and its relation to carbonation,” Constr. Build. 671
Mater., vol. 85, pp. 30–37, Jun. 2015.
672
[25] “Fifth Assessment Report - Climate Change 2013.” [Online]. Available: 673
http://www.ipcc.ch/report/ar5/wg1/. [Accessed: 18-Jan-2017]. 674
[26] “Weather Data | EnergyPlus.” [Online]. Available: 675
https://energyplus.net/weather. [Accessed: 06-May-2016]. 676
[27] K. Tuutti, “Corrosion of steel in concrete,” Swedish Cement and 677
Concrete Research Institute, ISSN 0346-6906, Stockholm, Sweden, 678
1982. 679
[28] V.-L. Ta, S. Bonnet, T. Senga Kiesse, and A. Ventura, “A new meta-680
model to calculate carbonation front depth within concrete structures,” 681
Constr. Build. Mater., vol. 129, pp. 172–181, Dec. 2016.
682
[29] V. G. Papadakis, “A reaction engineering approach to the problem of 683
concrete carbonation,” AIChE J., vol. 35, no. 10, pp. 1639–1650, 1989. 684
[30] K.-H. Yang, E.-A. Seo, and S.-H. Tae, “Carbonation and CO2 uptake of 685
concrete,” Environ. Impact Assess. Rev., vol. 46, pp. 43–52, Apr. 2014. 686
[31] P. F. Marques and A. Costa, “Service life of RC structures: Carbonation 687
induced corrosion. Prescriptive vs. performance-based methodologies,” 688
Constr. Build. Mater., no. 24, pp. 258–265, 2010.
689
[32] British Standards Institution, Concrete--complementary British 690
Standard to BS EN 206-1. Part 1, Part 1,. London: BSI, 2006.
691
[33] LNEC E465, “Concrete. Methodology for estimating the concrete 692
performence properties allowing to comply with the design working life 693
of the reinforced or pre-stressed concrete structures under environmental 694
exposures XC and XS.” Lisbon: LNEC, 2007. 695
[34] Y. F. Houst and F. H. Wittmann, “Influence of porosity and water 696
content on the diffusivity of CO2 and O2 through hydrated cement 697
paste,” Cem. Concr. Res., vol. 24, no. 6, pp. 1165–1176, 1994. 698
[35] V. T. Ngala and C. L. Page, “Effects of carbonation on pore structure 699
and diffusional properties of hydrated cement pastes,” Cem. Concr. Res., 700
vol. 27, no. 7, pp. 995–1007, 1997. 701
[36] IS 456: 2000, “Plain and reinforced concrete-code of practice.” Bureau 702
of indian standards 2000, 2000. 703
37
[37] S.-J. Kwon, S.-S. Park, and S.-H. Nam, “A suggestion for carbonation 704
prediction using domestic field survey data of carbonation,” J. Korea 705
Inst. Struct. Maint. Insp., vol. 11, no. 5, pp. 81–88, 2007.
706
[38] E. Rozière, A. Loukili, and F. Cussigh, “A performance based approach 707
for durability of concrete exposed to carbonation,” Constr. Build. 708
Mater., vol. 23, no. 1, pp. 190–199, Jan. 2009.
709
[39] I. Galan, C. Andrade, P. Mora, and M. A. Sanjuan, “Sequestration of 710
CO2 by concrete carbonation,” Environ. Sci. Technol., vol. 44, no. 8, 711
pp. 3181–3186, 2010. 712
[40] B. Chatveera and P. Lertwattanaruk, “Durability of conventional 713
concretes containing black rice husk ash,” J. Environ. Manage., vol. 92, 714
no. 1, pp. 59–66, Jan. 2011. 715
[41] A. Durán-Herrera, J. M. Mendoza-Rangel, E. U. De-Los-Santos, F. 716
Vázquez, P. Valdez, and D. P. Bentz, “Accelerated and natural 717
carbonation of concretes with internal curing and shrinkage/viscosity 718
modifiers,” Mater. Struct., vol. 48, no. 4, pp. 1207–1214, Apr. 2015. 719
[42] J. B. Aguiar and C. Júnior, “Carbonation of surface protected concrete,” 720
Constr. Build. Mater., vol. 49, pp. 478–483, Dec. 2013.
721
[43] S. Talukdar, N. Banthia, and J. R. Grace, “Carbonation in concrete 722
infrastructure in the context of global climate change – Part 1: 723
Experimental results and model development,” Cem. Concr. Compos., 724
vol. 34, no. 8, pp. 924–930, Sep. 2012. 725
[44] P. Dinakar, K. G. Babu, and M. Santhanam, “Corrosion behaviour of 726
blended cements in low and medium strength concretes,” Cem. Concr. 727
Compos., vol. 29, no. 2, pp. 136–145, Feb. 2007.
728
[45] M. R. Jones, M. D. Newlands, A. M. O. Abbas, and R. K. Dhir, 729
“Comparison of 2 year carbonation depths of common cement concretes 730
using the modified draft CEN test,” Mater. Struct., vol. 34, no. 7, pp. 731
396–403, 2001. 732
[46] G. De Schutter and K. Audenaert, “Evaluation of water absorption of 733
concrete as a measure for resistance against carbonation and chloride 734
migration,” Mater. Struct., vol. 37, pp. 591–596, 2004. 735
[47] B. Bary and A. Sellier, “Coupled moisture—carbon dioxide–calcium 736
transfer model for carbonation of concrete,” Cem. Concr. Res., vol. 34, 737
no. 10, pp. 1859–1872, Oct. 2004. 738
[48] M. Thiery, G. Villain, P. Dangla, and G. Platret, “Investigation of the 739
carbonation front shape on cementitious materials: Effects of the 740
38
chemical kinetics,” Cem. Concr. Res., vol. 37, no. 7, pp. 1047–1058, Jul. 741
2007. 742
[49] H. Cui, W. Tang, W. Liu, Z. Dong, and F. Xing, “Experimental study on 743
effects of CO2 concentrations on concrete carbonation and diffusion 744
mechanisms,” Constr. Build. Mater., vol. 93, pp. 522–527, Sep. 2015. 745
[50] A. Leemann, P. Nygaard, J. Kaufmann, and R. Loser, “Relation between 746
carbonation resistance, mix design and exposure of mortar and 747
concrete,” Cem. Concr. Compos., vol. 62, pp. 33–43, Sep. 2015. 748
[51] EN 197-1, “Cement-Part 1: Composition, specifications and conformity 749
criteria for common cements.” 2002. 750
[52] NF EN 1992-1-1/NA, “Eurocode 2: Calcul des structures en béton - 751
Partie 1-1: Règles générales et règles pour les bâtiments,” 2007. 752
[53] S. E. Chidiac, F. Moutassem, and F. Mahmoodzadeh, “Compressive 753
strength model for concrete,” Mag. Concr. Res., vol. 65, no. 9, pp. 557– 754
572, May 2013. 755
[54] M. I. Khan and C. J. Lynsdale, “Strength, permeability, and carbonation 756
of high-performance concrete,” Cem. Concr. Res., vol. 32, no. 1, pp. 757
123–131, 2002. 758
[55] M. Valcuende and C. Parra, “Natural carbonation of self-compacting 759
concretes,” Constr. Build. Mater., vol. 24, no. 5, pp. 848–853, May 760
2010. 761
[56] Y. Jia, B. Aruhan, and P. Yan, “Natural and accelerated carbonation of 762
concrete containing fly ash and GGBS after different initial curing 763
period,” Mag. Concr. Res., vol. 64, no. 2, pp. 143–150, février 2012. 764
[57] N. Hyvert, A. Sellier, F. Duprat, P. Rougeau, and P. Francisco, 765
“Dependency of C–S–H carbonation rate on CO2 pressure to explain 766
transition from accelerated tests to natural carbonation,” Cem. Concr. 767
Res., vol. 40, no. 11, pp. 1582–1589, Nov. 2010.
768
[58] V. G. Papadakis, “Effect of supplementary cementing materials on 769
concrete resistance against carbonation and chloride ingress,” Cem. 770
Concr. Res., vol. 30, no. 2, pp. 291–299, 2000.
771
[59] L. Basheer, P. A. M. Basheer, and A. E. Long, “Influence of coarse 772
aggregate on the permeation, durability and the microstructure 773
characteristics of ordinary Portland cement concrete,” Constr. Build. 774
Mater., vol. 19, no. 9, pp. 682–690, Nov. 2005.
![Figure 2. Tuuti’s service life prediction model [27] . 250](https://thumb-eu.123doks.com/thumbv2/123doknet/8074629.270768/14.892.86.740.203.964/figure-tuuti-s-service-life-prediction-model.webp)
![Figure 3. Carbonation model presented in [28] (input parameters are 271](https://thumb-eu.123doks.com/thumbv2/123doknet/8074629.270768/16.892.142.757.102.892/figure-carbonation-model-presented-in-input-parameters-are.webp)