CIRPÉE
Centre interuniversitaire sur le risque, les politiques économiques et l’emploi
Cahier de recherche/Working Paper 06-08
Perception of the Risks Associated with Impaired Driving and
Effects on Driving Behavior
Georges Dionne Claude Fluet Denise Desjardins
Mars/March 2006
_______________________
Dionne: Corresponding author. HEC Montréal, CIRPÉE and CRT. 3000, Chemin de la Cote-Ste-Catherine, Montreal (Qc), Canada, H3T 2A7. Telephone: (514) 340-6596; Fax: (514) 340-5019
georges.dionne@hec.ca
Fluet: UQAM, CIRPÉE and CRT
Desjardins: CRT (Université de Montréal)
This research was financed by Société de l’assurance automobile du Québec, the Quebec Department of Transport, and the Fonds pour la formation et l’aide à la recherche in the FCAR-MTQ-SAAQ program on road safety. We would like to thank Jean Boudreault, Andrée Brassard, and Lyne Vézina for their collaboration at
Abstract:
This research studies the perception of the risks associated with impaired driving – probability of being apprehended or of having an accident – and the relation between the perception of risks and driving behavior. The most important determinants of perceptual biases are age, an accumulation of violations in the year preceding the survey, being a non-drinker, knowledge of the legal alcohol limit for driving, opinion about zero tolerance for impaired driving, and family income. Perceptual biases are shown to influence driving behavior, as captured by drivers’ accumulated violations, demerit points and bodily injury accidents, in the years preceding and in the year following the survey. In conclusion, we analyze the results in terms of public policy for road safety.
Keywords: Risk perception, impaired driving, driving behavior, traffic violation, road
Accident, regulation, public policy
Résumé:
Le principal objectif de cette recherche est d'analyser la perception du risque d'être arrêté pour conduite avec facultés affaiblies. Nous avons aussi étudié la perception d'être impliqué dans un accident routier en conduisant avec facultés affaiblies et même la perception de la probabilité d'être impliqué dans un accident avec dommages corporels sous les mêmes conditions. Le deuxième objectif était d'identifier les déterminants expliquant les perceptions individuelles et, en particulier, les biais de perception que peuvent démontrer certains détenteurs de permis de conduire.
D'une façon générale, plusieurs facteurs affectent la perception des risques des individus. Les plus importants sont l'âge, le fait d'avoir accumulé des infractions durant l'année précédant l'enquête, le fait de ne pas consommer d'alcool, la connaissance de la limite d'alcool permise pour conduire, l’opinion sur la tolérance zéro pour conduite d’un véhicule et le revenu familial.
Les analyses des effets des perceptions sur les comportements des individus au volant de leur véhicule donnent des résultats intéressants en termes de sécurité routière. De façon générale, les biais de perception n’affectent pas les risques d’accident totaux mais affectant ceux d’accidents avec dommages corporels. Ce sont surtout les risques d’accumuler des infractions ou des points d’inaptitude qui sont affectés par les différentes perceptions.
Mots Clés: Perception du risque, conduite avec facultés affaiblies, comportement de
conduite automobile, infraction au Code de la route, accident routier, réglementation, intervention publique
Introduction
Impaired driving is the leading cause of death on highways. Police patrols can reduce road accidents, provided they are effective, which requires that surveillance create real incentives for complying with safety rules. In this respect, it is standard to emphasize that deterrence rests on three factors: (1) probability of arrest or frequency of patrols, (2) harshness of sanctions or fines; and (3) prompt application of sanctions. A crucial element, however, has to do with drivers’ perception of the probability of being arrested if they drink and drive. Presumably, this requires frequent and well publicized patrols. Impaired driving can also be deterred by the greater risks of accident that it entails. Information campaigns regularly seek to influence the perception of these risks, under the assumption that they tend to be underestimated by some drivers. Thus, in addition to actual surveillance measures and actual harshness of sanctions, policies to reduce impaired driving must consider drivers’ perceptions of the risks involved.
The discussion above allowed for the possibility that perceptions could be biased. Whether biases tend upward or downward will depend on several factors, including the spread of objective information and the driver’s past experience. According to some empirical studies, the extent of perceptual bias concerning the likelihood of detection or accident depends on the level of this probability itself: people tend to overestimate low probabilities and to underestimate high probabilities. But the same studies confirm that biases can be corrected by a good policy of spreading information about true probabilities, provided this information is accurate and credible. These studies also show that perceptions influence behavior. For example, it has been shown that, in comparison to non-smokers, smokers tend to underestimate the risks of lung cancer, which in part explains why they smoke (Viscusi, 1990).
A direct transposition of these findings to road safety implies that those who underestimate the probability of arrest (or the harshness or prompt application of sanctions) are less cautious, are more likely to be arrested for a violation, and have more accidents. If these results proved true, it would suggest that stepped-up campaigns about objective probabilities would in itself be dissuasive and thus a remedy. A corollary with respect to the deterrence effect of police surveillance would be that, if there were no perceptual biases, only a real increase in police patrols would have any effect on the frequency of accidents.
The present research provides estimates of how license holders perceive the risk associated with impaired driving, depending on their drinking and driving habits, and of how these perceptions affect actual driving behavior. The first objective of the research is therefore to identify the determinants of the perception of risks, so as to explain their potential biases. The second objective is to analyze the effects of perceptual biases on actual individual behavior. Note that it is not evident, a priori, that the high frequency of impaired driving can be mainly explained by poor perception of the risks involved.
We survey a sample of 2,850 class-5 license holders to evaluate their perception of the risk of impaired driving. Half of the respondents are drivers with a past conviction for impaired driving. The other half – or control group – is a similarly stratified sample of drivers without a conviction. The sample is drawn from the data bases of the Société d’Assurance Automobile du
able to assess the determinants of the perception of risks. In particular, we can evaluate whether the perceptions of drivers with a history of impaired driving differ from the general population of drivers. We can also quantify the direction and size of perception biases. Though this poses obvious difficulties of comparability, estimates of the objective probabilities are constructed on the basis of independent sources together with the survey data and the files of license holders. The second step is to estimate the effect of perceptions on driving behavior, controlling for the influence of other factors such as age, gender, income, region, etc. The working hypothesis is that drivers who underestimate the risks associated with impaired driving would tend to engage more in imprudent driving. We use the license-holders’ SAAQ file to capture this effect. Individual records include the frequency of violations, the rate of accident and the severity of accidents. We present two series of estimates of the effects of a license-holder’s perception of risks. In the first series, driving behavior is captured by the driver’s past record of accidents and violations in the years preceding and the year following the survey. In the second series, it is captured only by the driver’s record in the year following the survey. We want to emphasize that we used the conditional predicted perception of risk instead of the observed one obtained from the survey in the second step of the analysis.
The paper develops as follows. Section 2 briefly reviews the literature on the link between perceptual biases and behavior. Section 3 presents the SAAQ data base, the sampling procedure, the explanatory variables chosen for the survey, and the statistical models. Section 4 sums up the principal findings on the explanations of perceptual biases. Section 5 analyzes the effect of perceptions on driving behavior. Section 7 concludes.
1. Review of the literature
The policies to reduce impaired driving introduced in many countries over recent years rely on a number of educative, dissuasive, and punitive measures. These policies have undeniably had a certain effect, at least as concerns the average driver. The proportion of accidents involving a driver under the influence (of alcohol in this paper) has declined almost everywhere. And spot checks of blood-alcohol levels give evidence of significant decreases in many countries. Obviously, these observations are subject to many reservations or nuances. For example, data from the U.S. National Road Survey do show appreciable decreases in the percentage of drivers with a positive blood-alcohol level on week-end evenings; this percentage dropped from 36.1% in 1973 to 25.9% in 1986 and to 16.9% in 1996. However, between 1986 and 1996, the improvement hinges solely on a drop in the proportion of drivers with low blood-alcohol levels (teetotallers) and not those with high levels, whether such levels are defined at the 0.05 or 0.10 threshold. In either case, the survey shows that, between 1986 and 1996, there have been no significant changes (see Voas et al., 1998).
Pondering the effectiveness of the strategies aimed at fighting against impaired driving raises questions about the channels chosen to deliver measures designed to influence driving habits. The classical repressive measures—harsher sanctions and increased police surveillance—use direct means to discourage undesirable behavior (Boyer and Dionne, 1987; Bourgeon and Picard, 2006). Measures based on education or information do so indirectly by attempting to influence how the risks of alcohol-related accidents, detection, and sanctions are perceived. Educative
measures also usually rely on persuasion in their attempt to modify attitudes and standards concerning socially acceptable behavior. When successful, these measures manage to shape individual behaviors by bringing to bear the reference group’s influence. There are probably strong interactions between these different channels. For example, drivers who most strongly disapprove of drinking and driving (and thus those who adhere most closely to the social norm conveyed by educational measures) are perhaps also those who most clearly perceive the risks of accidents or sanctions associated with impaired driving.
Our study has to do with the determinants of the perception of the risk of arrest for impaired driving and with the relation between the perception of risks and behavior. By extension, it also examines the perception of the harshness of sanctions and of the risk of accident itself. The “perception” factor is fundamental, since it conditions the dissuasive impact of repressive measures. Obviously, the true goal of police surveillance and of sanctions for violations is not to “punish” offenders. They are rather means of applying a general policy of dissuasion to undesirable behaviors. These measures may on their own prevent high-risk individuals from doing harm (by withdrawing their licenses or confiscating their vehicle), but this aspect is secondary to the general effect of dissuasion.
1.1. Detection of offenders and policies of dissuasion
Dissuasion refers to all actions aimed at influencing behavior through the threat of sanctions: measures individuals will perceive as increasing the cost of undesirable behavior. Dissuasion is built on the detection of violations and on the application of sanctions when a violation is detected. The dissuasive effect will be all the stronger when the probability of detection is high and the sanctions are harsh (the certainty of sanctions when caught and the speed of their application are also factors).1
The probability of detection plays a decisive role for a great many reasons (see Zaal, 1999). Many studies show that, if the perceived probability of detection is weak, harsher sanctions will have only a negligible effect. The effect of dissuasions depends on the probability of detection as perceived by motorists. Educative measures (or the spread of information) can do their best to shape perceptions, but it is reasonable to think that the personal experiences of drivers and the actual level of police surveillance will be the principal determinants. However, the relation between the perceived risk and the real risk is complex, as shown in the discussion below.
There are no solid data available on the probability of apprehending impaired drivers, but, in all likelihood, this probability would be very low. Kenkel (1993) suggests a probability similar to the estimations already advanced by Beitel et al. (1975) and Borkensetin (1975): a probability averaging 0.003 per event of impaired driving. According to Borkensetin (1975), probabilities ranging between 0.001 and 0.005 constitute a reasonable bracket. For his part, Beitel proposed 0.005 for a blood-alcohol level above the legal limit and 0.02 for drunkenness (blood-alcohol
1 Polinsky and Shavell (2000) present a general review of policies of dissuasion; Zaal (1999) gives a
above 0.20). The objective probabilities of arrest per event would thus be very low, even when the most serious (and thus most easily detectable) cases are taken into account.
1.2. Subjective perception of risks
Over the past thirty years, many studies in psychology and economics have looked at the perception of risks, at learning processes (i.e. revision of perceptions based on new information), and at their relation to decision-making.2 For the purposes of this study, a few useful conclusions can be suggested.
1. Individuals would tend to overestimate the probability of relatively infrequent events and to underestimate that of more frequent events. Initially put forward by Lichtenstein et al. (1978) this finding was at first explained solely as a characteristic of general psychology.
2. In the case of risks for which individuals have little direct information from their own personal experience, Combs and Slovic (1979) and Slovic et al. (1982) have shown that over-evaluated risks also tend to be those which have been largely publicized. In other words, information received from various sources plays a big role in the perception of risks. 3. In the wake of the preceding works, several studies have examined the process by which new
information modifies the perceptions of risk. Particular attention has been paid to specific actions (information campaigns, labeling, etc.). For example, Smith and Johnson (1988) have analyzed information campaigns on the dangers of exposure to radon and their effects on the perception of the risk of lung cancer caused by this gas (which, after tobacco, is the leading cause of lung cancer). The findings confirm the effectiveness of communication policies in modifying the perception of risks (see also Smith et al., 1990; Magat et al., 1987).
4. However, these studies also reveal that in order to influence the perception of risks, communication measures also had to be credible (simple exhortations do not suffice) and compatible with the direct information that individuals could obtain from their own experience. The works of Viscusi and Connor (1984) and Viscusi (1985) thus suggest that learning processes are almost Bayesian; individuals assimilate in a relatively coherent manner most of the information that comes their way.
It is possible to conciliate the rationality (or quasi rationality) with which individuals handle information with the existence of perceptual biases. Perceived risks would be identical to objective risks if the individuals were perfectly informed. In a situation where they would be poorly informed, their a priori perceptions would however be very diffuse as concerns the level of different risks. High risks are therefore greatly underestimated and low risks strongly overestimated. The acquisition of new knowledge corrects these perceptions. Perceptions thus revised gain in objectivity, but more or less so, depending on the quantity and quality of the new information acquired. The upshot is that low risks are still overestimated and high risks underestimated, but perceptual biases have nonetheless been partially corrected.
The study by Magat et al. (1987) cited above is not only concerned with the processing of information but also with the behaviors it generates. This study shows that information on the risks in using potentially dangerous domestic products will lead consumers to make what can be called rational adjustments. Information indicating a high risk induces the precautions desired in the use and storage of this kind of product.
The most widely studied case of the relation between perception of risks and behavior has to do with the decision to smoke. In Viscusi (1990, 1992) the link between cigarettes and the risk of developing lung cancer is considered. The question initially raised is whether smokers in the United States underestimate the risk of developing cancer. The study’s conclusions are congruent with the hypothesis positing a relation between behavior and perception of risks as well as with the above-mentioned finding which shows that the risks of unlikely but highly publicized events tend to be overestimated. All the respondents overestimated the risk of developing lung cancer from cigarettes. However, there is a significant difference between the perceptions of smokers and non-smokers: Smokers’ perception of this risk is, on average, relatively lower than that of non-smokers, which in part explains why they smoke. In other words, all the respondents show some perceptual bias, but this bias is higher (greater overestimation) among non-smokers.
Liu and Hsieh (1995) reproduce the main aspects of Viscusi’s approach in their Taiwan study. Their findings are also analogous: (i) the risk of lung cancer linked to cigarettes is generally overestimated; (ii) non-smokers tend to have a stronger perception of risks than do smokers; (iii) young people overestimate this risk more than the average for the population. But as concerns the thesis that highly publicized risks will tend to be overestimated, there are differences between the two studies. Though overestimation is observed in the Taiwan study, the perceptions of the risk of lung cancer from smoking are weaker in Taiwan than in the United States, and this could be due to differences between these two countries with regard to the intensity of their public awareness campaigns focusing on the risks in question.
In the case of Spain, Antonanzas et al. (2000) study the perceived relation between cigarettes and risks related to lung cancer, pulmonary diseases in general, and heart diseases. Their conclusions are qualitatively the same as those reached in the preceding studies: (i) the risks of lung cancer, pulmonary and heart diseases associated with cigarettes are overestimated; (ii) non-smokers have stronger perceptions of these risks than do smokers; (iii) young people overestimate these risks more than the average for the population as a whole, in response to the information environment to which they are exposed. Moreover, more highly educated respondents overestimate risks less than the average individual. This finding may be explained by the fact that the risks perceived by the well educated are better documented, but it contradicts current opinion which holds that the decision to smoke is a consequence of poor information. Unfortunately, it seems there are no studies of this nature on the risk of road accidents.
1.3. Implications for the current study
The foregoing observations suggest a certain number of predictions as to how the risk of arrest for impaired driving is perceived. First, it seems to be an established fact that the objective risks of arrest for impaired driving are, on average, very low. We would thus expect these risks to be overestimated by the average driver. Second, the average overestimation should be all the higher when the risks in question are highly publicized. Third, drivers with greater direct experience on the road should in all likelihood have a more accurate perception of the true risk of detection. Fourth, imprudent or delinquent drivers should also downplay the risk of arrest more than the average driver. As to the perceived harshness of sanctions, the foregoing observations do not perhaps warrant the same predictions. As this information is more easily available, we can expect this perceptual bias to be weaker than for probabilities of detection.
2. Methodology
We proceeded in two steps. In the first, we estimated the individuals’ perceptual biases; in the second step, we looked to see whether the conditional estimated bias had a significant effect on driving behavior as measured by the frequencies of violations and accidents. In order to calculate perceptual biases, we used a survey asking drivers about their perceptions of different risks. The survey results were then compared with benchmark probabilities.
2.1. Sample
An initial sample composed of 24,382 individuals was selected from among all holders of class-5 licenses (for sedans) valid on 1 January 2001 and 15 October 2001 and present in SAAQ files. It was composed in equal shares of two cohorts: the cases and the control group.
The cohort of cases represents all the license holders having been sanctioned for an alcohol-related violation during the period running from 5 January 1998 to 29 December 1999. Alcohol-related violations include: (1) impaired driving; (2) refusing an alcohol test/blood sample; (3) driving with an alcohol blood level over 0.08; (4) impaired driving causing bodily injuries; (5) impaired driving causing death.
This cohort of cases initially contained 28,985 drivers. The next step was to draw from this number only those drivers with a regular or probationary class-5 license valid on 1 January 2001 and on 15 October 2001 and with no sanction exceeding 15 days in 2001. This step reduced the number of drivers to 12,223. Finally, after weeding out the cases of death, emigration, non-residency, identity theft, fraud and the like, we were left with 12,191 cases.
The second cohort, also numbering 12,191 drivers, is the comparison or control group. These were selected randomly according to the stratification observed for the cohort of cases, in terms of age on 1 October 2001, gender, and administrative region. Members of the control group were to have a license valid on 15 October 2001 and to have no record of any alcohol-related suspension, arrest or conviction since 1996 (convictions for other types of offences excluded)
including administrative suspensions (automatic: 15 or 30 days) for a blood-alcohol level over 0.08.
2.1.1. Sample targeted
From past experience (see SOM, 1997), we estimated at about 60% those drivers sanctioned for an alcohol-related violation whose telephone numbers we would be able to retrieve for the telephone survey, amounting to about 9,000 drivers. We checked that there was no bias linked to obtaining more telephone numbers in one stratum rather than another. Given the budget for the survey, we foresaw obtaining responses from 1,425 persons with a conviction for an alcohol-related violation and 1,425 without a conviction, for a total of 2,850 respondents. We anticipated a 50% response rate to our telephone survey. Since the sample is drawn from SAAQ data, the survey questions could be limited to the variables linked to perception and behavior stated. In order to increase the survey’s accuracy, we stratified the sample targeted according to age, gender, and administrative region, in the same proportions as the primary sample extracted from the SAAQ files.
2.2. Individuals’ perception of risks and perceptual bias
The three risks whose perception we analyze are (1) the risk of arrest by the police, (2) the risk of having an accident and (3) the risk of a bodily-injury accident— all during impaired driving. To discover their perceptual biases, licenses holders were asked questions allowing comparisons between their perceptions of risks and some benchmarks.
First, we needed to find out the probability of being arrested for impaired driving. We do not know the percentage of holders of class-5 licenses who drive under the influence. To estimate this percentage, we used the survey results. For this purpose, the relevant question is number 16 on the questionnaire, which reads as follows: “Over the past 3 months, have you ever had five drinks or more in the two hours before driving?” We thus consider impaired driving to be cases where respondents say that they have more than once driven after having 5 drinks or more. Taking the control cohort as a point of reference, we estimate that the percentage of license holders who drive under the influence ranges between 1.41% and 2.88%. Given the number of class-5 license holders in Quebec, there would be between 56,953 and 116,754 class-5 license holders who would engage in impaired driving. Based on SAAQ data, there are, on average, 69 tickets for violations of the Criminal Code issued on Fridays in Quebec. We thus estimate that the risk of being arrested by the police on a Friday ranges between 0.6/1,000 (69/116,754) and 1.2/1,000 (69/56,953).
To find how the risk of being arrested by the police is perceived in such a case, we asked the following question: “Suppose that there are about 20,000 drivers in Quebec who engage in impaired driving. In your opinion, how many will be arrested by a police officer?” (Question 24b) So, out of 20,000 motorists who engage in impaired driving on a Friday, the number of those arrested by the police should range between 12 (0.6/1,000 × 20,000) and 24 (1.2/1,000 × 20,000).
We define the perception of the risk of being arrested for impaired driving by the police as follows:
Y = 1 Overestimating the risk (above 24) 2 Underestimating the risk (under 12) 3 Accurate perception ([12, 24])
A similar approach was used for the perception of the two other types of risk, based on the following questions:
Question 25: How many of these 20,000 drivers will have an accident, regardless of their liability or the seriousness of the accident?
Question 26: Of these 20,000 drivers, how many will have an accident causing at least one injury or a death, regardless of their liability or the seriousness of the accident? Based on the SAAQ’s statistical records, the average number of drivers involved in accidents involving at least one automobile or one light truck per year is shown below, according to the seriousness of the accident:
854 drivers involved in a fatal accident
5,933 drivers involved in an accident with serious injuries 44,322 drivers involved in an accident with minor injuries
180,087 drivers involved in an accident with material damage only (MDO)
The SAAQ data come from police reports; reports jointly agreed by motorists were not used. According to a study by Laberge-Nadeau et al. (2001), jointly agreed reports are filled out for 3 out of 5 reported accidents with material damage. Thus the number of drivers involved in accidents with MDO involving at least one automobile or one light truck is about 288,139 (180, 087 × 1.60).
According to SAAQ records once again, the percentages of fatal, serious or minor accidents or those with MDO on a Friday are respectively 0.338%, 0.329%, 0.335%, and 0.342%. The number of drivers involved in accidents involving at least one automobile or one light truck on a Friday, according to the seriousness of the accident is:
2.9 drivers involved in a fatal accident
19.5 drivers involved in an accident with serious injuries 148.5 drivers involved in an accident with minor injuries
985.4 drivers involved in an accident with material damage only (MDO)
Moreover, according to the SAAQ, alcohol is a factor in 30% of fatal accidents, 18% of accidents causing serious injuries, and 5% of accidents causing minor injuries. Since we have no data on accidents with material damage only, we give this category the same percentage as for accidents causing minor injuries.
The average number of impaired drivers involved in accidents involving at least one automobile and one light truck can therefore be computed as follows, according to the seriousness of the accident:
0.8 drivers involved in a fatal accident
3.5 drivers involved in an accident with serious injuries 7.4 drivers involved in an accident with minor injuries
49.3 drivers involved in an accident with material damage only (MDO)
So on Friday in Quebec, an average of 12 impaired drivers will be involved in a bodily accident involving at least one automobile or one light truck and 61 impaired drivers will be involved in an accident, independently of its seriousness. Now, out of 20,000 impaired drivers, the number of those involved in an accident will therefore range from 10 to 22 and the number of those involved in a bodily accident will range from 2 to 4.
We define the perception of the risk of accident while driving with impaired faculties as follows: Y = 1 Overestimate risk (above 22)
2 Underestimate risk (below 10) 3 Accurate perception ([10,22])
We define perception of the risk of bodily-injury accident while driving with impaired faculties as follows:
Y = 1 Overestimate risk (above 4) 2 Underestimate risk (below 2) 3 Accurate perception ([2,4]) 2.3. Generalized Logit Model
This model is used to determine the variables which explain perceptual biases. The explanatory variables originate either from the survey or the SAAQ files. They include gender, age, cohort (i.e., cases or control group), number of violations, family income, stated behavior (relative to speeding, driving after drinking, preventive alcohol test), knowledge of the legal alcohol limit and of the number of drinks to reach that limit, knowledge of sanctions for impaired driving (fines, suspension), and attitude with respect to zero tolerance.
The three categories of the dependent variable (Y) are treated qualitatively (overestimate, underestimate, accurate perception) and a generalized logit model is adjusted by producing two parametric vectors. The model takes the form:
(
)
(
)
(
(
)
)
Pr Y 1| X Pr Y 2 | X ln X, ln X Pr Y 3 | X Pr Y 3 | X = = ′ ′ = α + β = δ + λ = = where α and δ are the constants, β and λ are the parameters vectors, X is the control variables vector, and where 1 corresponds to overestimate, 2 to underestimate, and 3 stands for accurate perception. So a positive β means that the variable i X has a positive effect on overestimation i while a positive λ means that the variable j X has a positive effect on underestimation. Note that j the same individual cannot obtain both 1 and 2 and thus cannot be included in both regressions. 2.4. Predicted perceptions
We used conditional predicted perceptions to estimate the effect of risk perception on driving behavior. We had the choice between two methodologies: using the perceptions stated by individuals or using the conditional perceptions predicted by the models in 2.3 above. The conditional predicted perception makes it possible to control several factors from which biases may arise, factors such as past driving experience, presence or absence of past convictions, and exposure to risk. We thus opted for this approach, even though the number of observations obtained from the survey is rather low (making it more difficult to construct a stable model). Based on the model above, the predicted perception for license holder i is as follows.
Probability of overestimating the risk:
(
)
(
)
(
)
i(
)
i i i i ˆ ˆ exp X P Y 1| X ˆ ˆ ˆ ˆ 1 exp X exp X ′ α + β = = ′ ′ + α + β + δ + λ ; Probability of underestimating the risk:(
)
(
)
(
)
i(
)
i i i i ˆ ˆ exp X P Y 2 | X ˆ ˆ ˆ ˆ 1 exp X exp X ′ δ + λ = = ′ ′ + α + β + δ + λ ; Probability of having an accurate perception of the risk:(
)
(
)
(
)
i i i i 1 P Y 3 | X ˆ ˆ ˆ ˆ 1 exp X exp X = = ′ ′ + α + β + δ + λ .The coefficients are the maximum likelihood estimators of the constant and parameters of the overestimation and underestimation regressions respectively.
2.5. Perception of risks and behavior of drivers
We performed two types of analysis: (1) analysis of behavior in the year following the survey, (2) analysis using all the data available before and after the survey. This second procedure using longitudinal data (repeated measurement over time) improves the statistical reliability of the results by providing more information, but the interpretation is perhaps not as straightforward. Driving behavior is captured by the number of accidents in which the driver is involved, the frequency of violations leading to demerit points and the number of demerit points accumulated. We also did separate analyzes for total accidents and for accidents causing injuries and deaths. We therefore performed four regressions, one for each of the possible dependent variables reflecting driving behavior.
The methodology for the impact on behavior is as follows. The unit of observation is one class-5 license holder whose license is valid for at least one day during the year following the survey. The number of demerit points is the total number accumulated during the year following the survey. The linear regression model was used in this case. The number of accidents during the year following the survey is a dichotomous variable equal to unity if there is one accident or more and equal to zero otherwise. The Logit model was used for the estimations. For the number of violations occasioning demerit points during the year following the survey, the negative binomial regression model was estimated.
3. Results for perception of risks
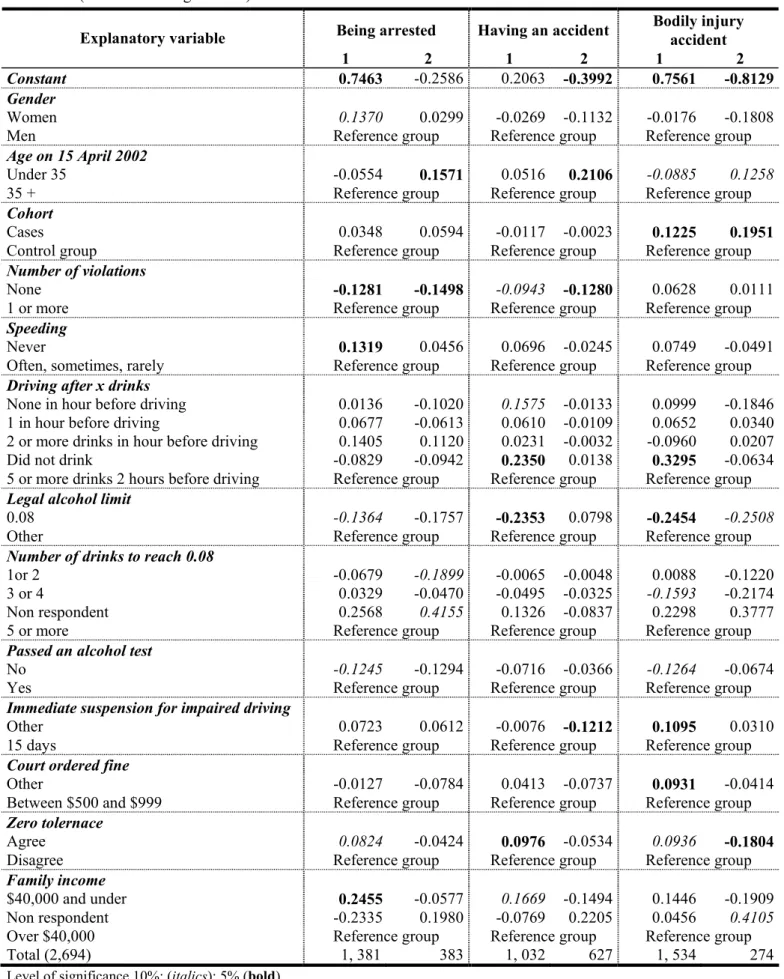
Table 1 sum up the main econometric findings on the perception of risks. It presents estimations of the factors which affect the perception of risks among the individuals interviewed during the telephone survey. Three types of estimation were used to analyze three types of perception: (1) perceived risk of arrest for impaired driving, (2) perceived risk of having an accident occasioning a police report while driving under the influence, (3) perceived risk of having an accident causing bodily injuries or death while driving under the influence. For each perception, an individual can either overestimate the risk, underestimate the risk or perceive it accurately.
An individual cannot have all three types of perception at the same time (i.e. overestimate, underestimate, and perceive a risk accurately in responding to the same question), but this individual may change stance from one question to the next and from one risk to the next. This is why the same factors do not always explain variations in perception from one question to the next. For example, the same individual may overestimate the risk of being arrested for impaired driving, but underestimate the risk of having an accident under the same conditions. For each risk in Table 1, column 1 represents overestimation of the risk and column 2 its underestimation. The distribution of individuals between the two columns will depend on their answers to the questionnaire. The figures in the last line of the table (Total) indicate the number of persons who overestimate or underestimate in each column. Those with an accurate perception correspond to the difference (not indicated) between 2,694 and the sum of the two numbers indicated for each question at the bottom of columns 1 and 2.
The classes of explanatory variables selected are based on the fact that at least one factor is significant at least at the 10% level for one of the six possible perceptions or columns: overestimation or underestimation for at least one type of risk. For example, the variable “legal alcohol limit” has two factors or categories which are significant at the 5% level (in bold) and does have two categories which are significant at the 10% level (in italics). In the following discussion, we shall highlight the factors which are significant at the 5% level.
We take as benchmark the risk of being arrested for impaired driving (in the table, “being arrested”). Comparisons with the two other risks will be made whenever warranted by interesting results. We see that one factor has a simultaneous effect on both overestimation and underestimation: the number of violations occasioning demerit points during the year preceding the survey. Those who did not accumulate violations have a more accurate perception of the risk of being arrested than those who accumulated violations other than alcohol-related ones
(underestimating less and overestimating less). This perhaps explains why they do not accumulate violations. Moreover, those who did not accumulate violations also underestimate and overestimate (10%) the risk of being involved in an accident less, but do not behave differently from those who do accumulate violations for accidents causing bodily injury.
Gender has no effect (significant at 5%) on biased perceptions of the different risks. Age does, in contrast, have a positive effect on the underestimation of the three risks, even though the level of significance is only 10% for bodily injuries. This means that those under 35 underestimate the risks of being arrested and of having an accident more than those who are 35 and over. This finding can measure the effect of experience on the perception of risks. On the other hand, age does not really affect the probability of overestimating.
The cohort variable measures the status of those selected for the analysis. The cases represent those who have been convicted for impaired driving, while the control group is composed of individuals selected randomly according to criteria chosen to make them comparable to subjects in the case cohort. The fact of being in one group rather than the other affects only perception of the risk of bodily injury. Individuals having accumulated one or more license suspensions (cases) underestimate and overestimate the risk of bodily injury more than those who had no alcohol-related suspensions during the period studied in this research. This means that they have a less accurate perception of this risk. This finding is surprising, especially since more individuals overestimate rather than underestimate this risk.
Individuals who say they never speed overestimate the risk of being arrested more, but their perception does not differ from those who say they have often, sometimes or rarely speeded with regard to the other two risks. This finding shows once again that overestimating a risk can reign in the behavior of delinquents. Furthermore, it is not evident that individuals make a sharp distinction between the risk of being arrested for speeding and that of being arrested for some other violations such as those related to alcohol. We now turn to the factors related to drinking habits.
Respondents declaring they have not had a drink in the three months preceding the telephone survey overestimate the risk of accident and of bodily accident from an accident while driving with impaired faculties more than those who say they have driven after having five drinks or more in the two hours preceding the use of their vehicle. In contrast, those who have fewer than five drinks before driving do not perceive risks differently from those who have five or more drinks two hours before getting behind the wheel. The sole exception is those who do not drink at all before driving, which is explained by an overestimation (10%) of the risk of accident.
(Insert Table 1 here)
Knowing the 8% legal alcohol limit for driving a vehicle seems to be associated with a clearer perception of the three risks (less overestimation, but at only 10% for the probability of being arrested for impaired driving) than not knowing this information. This finding indicates that individuals who know more about the Highway Safety Code (at least as concerns drinking and driving) have a better perception of the different risks—at least they do not overestimate them.
However, knowing the number of drinks it takes to reach the 8% limit has a less significant effect on perception of the different risks. Indeed, among respondents, only two coefficients are significant at 10%, but they still indicate that individuals who mention fewer than five drinks have a better perception of risks, in the sense that they overestimate the risk of a bodily-injury accident less (3 or 4 drinks) and underestimate the risk of being arrested less (1 to 2 drinks). Respondents who declared having already passed an alcohol test to prevent impaired driving overestimated both the risk of being arrested and the risk of bodily injury less (both at 10%) than those stating they have never taken that preventative measure. It seems that those who said they passed an alcohol test as a preventative measure have a more accurate perception of both risks. Those with less knowledge of the length of an immediate suspension underestimate the risk of accident less but overestimate the risk of a bodily-injury accident more. Similarly, those who do not know the court fine overestimate the risk of bodily injury more. In other terms, respondents with correct answers to these questions have a clearer perception of risks.
Subjects who agree with zero tolerance overestimate the three risks more than those who do not agree (at 10% for being arrested and having a bodily-injury accident) but underestimate the risk of a bodily-injury accident less. As a rule, they have a less accurate perception of these three risks than those who do not agree.
Finally, those with family incomes below $40,000 overestimate the risk of being arrested and having an accident more (10%) that those with an income above $40,000.
To summarize, several factors affect individuals’ perception of risks. The major factors are age; the fact of having accumulated violations in the year preceding the survey; being a non-drinker; knowledge of the legal alcohol limit for driving; opinion of zero tolerance; and family income. The second step is now to see how perceptual biases affect individual driving habits.
4. Analysis of the effects of risk perceptions on driving habits
In this section, we present analyzes linking individuals’ perceptions of risk to their driving habits. Driving habits are captured by the actual occurrence of accidents and violations. For each violation and accident model, we used one of the predicted risk perception variable as explanatory variable, together with several control variables. Although we analyzed the effect of the predicted value on the occurrence of accidents with bodily injuries, on the occurrence of other types of accidents, on violations, and on demerit points accumulated, the effect of risk perception was significant only for the last two types of occurrences when cases and control groups are not separated. Accordingly, only the latter results are shown in a first step. We then separated predicted values for the two groups. The estimates of the effects were obtained based on several control variables, but we present only the coefficients of the perception variables. We start with the risk of being arrested for impaired driving.
4.1. Perception of the risk of being arrested for impaired driving
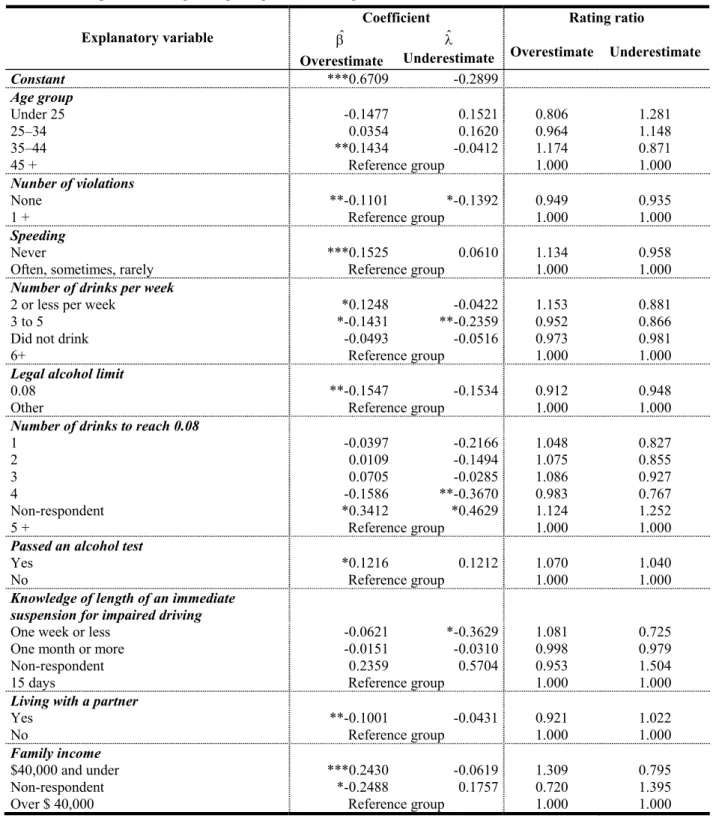
To compute the predicted perception, we reestimated the first column of table 1 keeping only the categories that were significant in explaining the perception of the risk of being arrested for impaired driving. For each of the 2,689 respondents, we calculated predicted probabilities (overestimate, underestimate, accurate perception). The first column of table A1 in the appendix presents the coefficients explaining the probability of overestimating the risk, while the second column presents those explaining the probability of underestimating this risk.
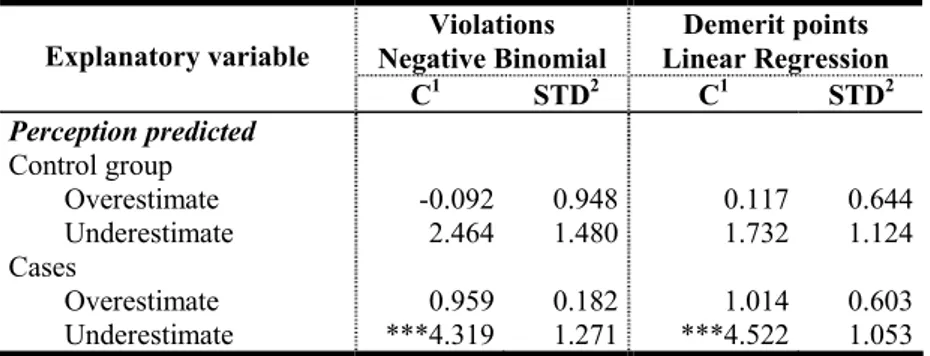
The results in table 2 indicate that individuals who underestimate the probability of being arrested for impaired driving commit more violations of the Highway Safety Code, no matter which model is used. The results are however more significant with regressions for the 1995-2003 period, for we had access to more observations for that period.
(Insert Table 2 here)
4.2. Perception of the risk of accident while driving with impaired faculties
The procedure is the same as above. For each of the 2,689 respondents, we calculated the predicted probabilities of overestimating or underestimating the risk of accident while driving with impaired faculties, using the estimations presented in table A2 in the appendix. The effects on violations and demerit points accumulated are presented in table 3.
(Insert Table 3 here)
It is interesting to note that, while underestimation of the risk is indeed associated with more violations, the same is true to some extent with overestimation of the risk, although the effect is less marked. Indeed, additional estimations (not presented) show that the probability of correctly perceiving the risk (i.e., using as explanatory variable the probability that an individual has an accurate perception) is associated with less violations and less demerit points.
4.3. Perception of the risk of having an accident causing bodily injury while driving with impaired faculties
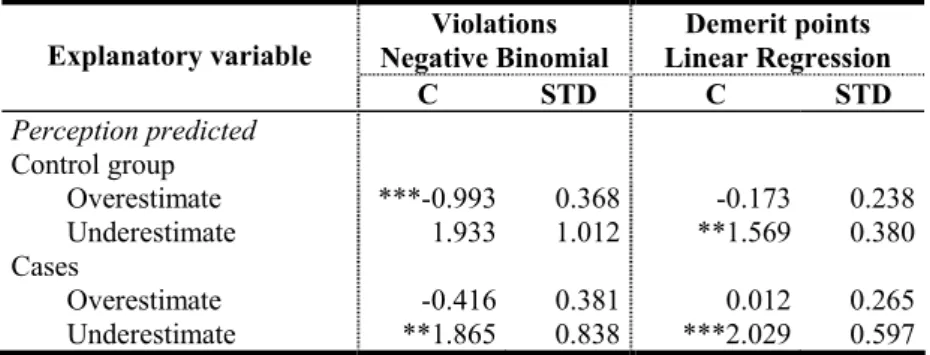
We now turn to perception of the risk of having an accident causing bodily injury while driving with impaired faculties. The predicted perceptions are presented in table A3, the effects on driving habits in table 4. Again, risk perception affects driving behavior.
(Insert Table 4 here) 4.4. Separating predicted values between cases and control group
Table 1 showed that risk perceptions differed between cases and control group only with respect to the risk of accidents with bodily injuries. Accordingly, we also estimated different predicted values for this perception, depending on whether or not an individual has been convicted for an alcohol-related violation. These estimates are presented in Tables A4 and A5. We note that the
variables explaining the probabilities of overestimating or underestimating the risk of having an accident causing bodily injury differ in the two tables. In fact, the overestimation of this risk by the control group includes many significant variables drawn from the telephone survey. The modeling for the perception of this risk thus differs depending on whether there has been a conviction linked to alcohol (cases) or not (control group).
We then used the predicted perceptions of each group to explain occurrences of accidents, violations or accumulated demerit points (table 5). By contrast with the previous results, there are now cases where risk perception is a significant explanatory variable for all four types of occurrences linked to driving habits. Another difference is that, generally speaking, the effect of overestimation of the risk now has the predictable effect of being associated with less risky behavior.
(Insert Table 5 here)
5. Discussion and conclusion
A first objective of this research was to analyze the perception of the risk associated with impaired driving. This includes the risks of being apprehended or of being involved in a road accident, with or without bodily injury, while driving after drinking. A second objective consisted in assessing the extent to which individual perceptions affect driving habits.
Our main conclusions can be summed up as follows. As a rule, several factors affect the way individuals perceive risks. The most important are age, the accumulation of violations during the year preceding the survey, being a non-drinker, knowing the legal alcohol limit for driving, agreeing with a possible amendment introducing zero tolerance for drinking-driving into the Highway Safety Code, and family income. Generally, no variable directly measuring drinking habits had much effect on perceptions, not even the fact of being a case (having been convicted) rather than a member of the control group.
These conclusions agree with some or our working hypotheses at the beginning of the study. We did in fact expect that biases would be stronger in young people and in the less well informed. We also expected that the accumulation of violations of the Highway Safety Code could be linked to perceptual biases. Our greatest surprise was to observe that belonging to the case group or the control group did not have much impact on perceptual biases, except that cases do differ from the control group in their perception of the probability of being involved in an accident causing bodily injury. However, it was not easy to determine the net effect, as some individuals in the group of cases overestimate and others underestimate this probability. In most of our analysis, we were thus led to use the predicted perceptions of the two groups indiscriminately in order to explain driving habits, although we did separate the two groups’ perceptions of the risk of having an accident causing bodily injury.
Analyzes of the effects of perceptions on individuals’ driving habits produce interesting results in terms of road safety. Perceptual biases do not as a rule affect the risks of total accidents, or at least we did not capture such an effect. By contrast, the risks of accumulating violations or demerit points are affected by differences in perception. Since these two risks give similar
results, we shall limit our discussion to the risk of accumulating violations to the Highway Safety Code. All violations are lumped together, no matter what their nature. For lack of an adequate number of observations, we were not able to analyze the risk of a suspended license.
The results indicate that individuals who underestimate the probability of being arrested for impaired driving commit more violations against the Highway Safety Code. Some results also indicate that those who overestimates also tend to commit more violations, although the effect is less pronounced. The interpretation is that those with an accurate perception of risks commit fewer violations. Thus, as expected, underestimation of risk seems to lead to less prudent driving, but misperception (whether over or underestimation) also seems to be associated with less prudent driving. However, in the cases where we were able to separate the predicted perceptions between cases and control group, overestimation was associated with less risky behavior.
There is of course a caveat in that we have no precise knowledge of the risk of being arrested and have estimated it in a very indirect manner. There are no statistics on this subject. We do not truly know how many drivers are on the road at any given time nor even at different times during the week. A fortiori, we are unable to tell how many motorists are driving under the influence in these different time slots. Do even the police have any precise knowledge on this score? Based on traffic violation reports, several observers suppose that a great many people drink and drive on Friday and Saturday evenings. There are perhaps more police patrols on the road at these times. Moreover, statistics on traffic tickets indicate the day but not the hour.
Nevertheless, assuming our definition of what constitutes misperception is not too far of, the results suggest that, with an improved perception of this risk, drivers tend to be more cautious. Improving perception does not necessarily imply putting more patrols on the road. But giving due regard to the preceding discussion, it does imply calling attention to the different risks, provided that they are accurately portrayed. These risks must also seem credible: actual police actions must back up the risk portrayed. Analyzing the determinants of perceptual biases makes it possible to aim measures at categories of drivers who tend either to underestimate or overestimate risks. Several kinds of measures can be contemplated: education, public awareness campaigns, modification of the behavior of those who apply the regulations, harsher sanctions, etc. Our statistical results show that those who underestimate tend to be more at risk. Measures designed to correct perceptual biases are thus to be considered.
References
Antoñanzas, Fernando, et al. (2000). “Smoking Risks in Spain: Part I - Perception of Risks to the Smoker,” Journal of Risk and Uncertainty 21, (2/3), 161-186.
Arrow, Kenneth J. (1982). “Risk Perception in Psychology and Economics,” Economic Inquiry 20, 1-9.
Beitel, George A., Michael Sharp and William D. Glauz (1975). “Probability of Arrest While Driving under the Influence of Alcohol,” Journal of Studies on Alcohol 36(1), 109-116.
Borkenstein, Robert F. (1975). “Problems of Enforcement, Adjudication and Sanctioning,” in Alcohol, Drugs and Traffic Safety, S. Israelstam and S. Lambert (Eds.), Proceedings of the Sixth International Conference on Alcohol, Drugs and Traffic Safety, Toronto.
Bourgeon, Jean-Marc and Pierre Picard (2006). “Point-Record Driving Licence and Road Safety: An Economic Approach,” Mimeo, Ecole Polytechnique, France.
Boyer, Marcel and Georges Dionne (1987). “The Economics of Road Safety,” Transportation Research 21B (5), 413-431.
Combs, Barbara and Paul Slovic (1979). “Causes of Death: Biased Newspaper Coverage and Biased Judgements,” Journalism Quarterly 56, 837-843.
Kenkel, Donald S. (1993). “Do Drunk Drivers Pay their Way? A Note on Optimal Penalties for Drunk Driving,” Journal of Health Economics 12, 137-149.
Klepper, Steven and Daniel Nagin (1989). “The Deterrent Effect of Perceived Certainty and Severity of Punishment Revisited,” Criminology 27, 721-747.
Laberge-Nadeau, Claire, et al. (2001). “Wireless Telephones and the Risk of Road Accidents (Final report),” Centre for Research on Transportation, Laboratory on Transportation Safety, CRT-2001-16, 134 p.
Lichtenstein, Sarah, et al. (1978). “Judged Frequency of Lethal Events,” Journal of Experimental Psychology: Human learning and Memory 4, 551-578.
Liu, Jin-Tan and Chee-Ruey Hsieh (1995). “Risk Perception and Smoking Behavior: Empirical Evidence from Taiwan,” Journal of Risk and Uncertainty 11, 139-157.
Magat, Wesley A, W. Kip Viscusi and Joel Huber (1987). “Risk-Dollar Tradeoffs, Risk Perceptions, and Consumer Behavior,” dans Learning about Risk, W. Kip Viscusi and Magat, W.A, (Eds.), Harvard University Press.
Paternoster, Raymond (1987). “The Deterrent Effect of the Perceived Certainty and Severity of Punishment: A Review of the Evidence and Issues,” Justice Quarterly 4, 173-217.
Polinsky, A. Mitchell and Steven Shavell (2000). “The Economic Theory of Public Enforcement of Law,” Journal of Economic Literature XXXVIII, 45-76.
Slovic, Paul, Baruch Fischoff and Sarah Lichtenstein (1982). “Facts versus Fears: Understanding Perceived Risk,” in Judgement under Uncertainty: Heuristics and Biases Cambridge Press, Kahneman, D., Slovic, P. and Tversky, A. (Eds), 462-492.
Smith, V. Kerry, et al. (1990). “Can Public Information Programs Affect Risk Perceptions?” Journal of Policy Analysis and Management 9(1); 41-59.
Smith, V. Kerry and F. Reed Johnson (1988). “How Do Risk Perceptions Respond to Information? The Case of Radon,” The Review of Economics and Statistics 70, 1-8.
SOM inc. (1997). A survey of Quebec license holders presented to the Communications Department of the Société de l’assurance automobile du Québec for the study of its “Alcohol 97” campaign.
Viscusi, W. Kip (1990). “Do Smokers Underestimate Risks?” Journal of Political Economy, 98(6), 1253-1269.
Viscusi, W. Kip (1992). “Smoking, Making the Risky Decision,” New York, Oxford: Oxford University Press, 170 p.
Viscusi, W. Kip (1985). “A Bayesian Perspective on Biases in Risk Perception,” Economic Letters 17, 59-62.
Viscusi, W. Kip and Charles J. O’Connor (1984). “Adaptive Responses to Chemical Labelling: Are Workers Bayesian Decision Makers?” American Economic Review 74, 942-956.
Voas, Robert B., et al. (1998). “Drinking and Driving in the United States: the 1996 National Roadside Survey,” Accident Analysis and Prevention 30(2), 267-275.
Zaal, Dominic (1999). “Traffic Law Enforcement: A Review of the Literature,” Monash University, Institute for Road Safety Measure, Report no 53, 202 p.
Table 1: Estimations of the probability of overestimating or underestimating the risk of impaired driving (Generalized Logit Model)
Being arrested Having an accident Bodily injury accident Explanatory variable
1 2 1 2 1 2
Constant 0.7463 -0.2586 0.2063 -0.3992 0.7561 -0.8129
Gender
Women 0.1370 0.0299 -0.0269 -0.1132 -0.0176 -0.1808
Men Reference group Reference group Reference group
Age on 15 April 2002
Under 35 -0.0554 0.1571 0.0516 0.2106 -0.0885 0.1258
35 + Reference group Reference group Reference group
Cohort
Cases 0.0348 0.0594 -0.0117 -0.0023 0.1225 0.1951
Control group Reference group Reference group Reference group
Number of violations
None -0.1281 -0.1498 -0.0943 -0.1280 0.0628 0.0111
1 or more Reference group Reference group Reference group
Speeding
Never 0.1319 0.0456 0.0696 -0.0245 0.0749 -0.0491
Often, sometimes, rarely Reference group Reference group Reference group
Driving after x drinks
None in hour before driving 0.0136 -0.1020 0.1575 -0.0133 0.0999 -0.1846 1 in hour before driving 0.0677 -0.0613 0.0610 -0.0109 0.0652 0.0340 2 or more drinks in hour before driving 0.1405 0.1120 0.0231 -0.0032 -0.0960 0.0207
Did not drink -0.0829 -0.0942 0.2350 0.0138 0.3295 -0.0634
5 or more drinks 2 hours before driving Reference group Reference group Reference group
Legal alcohol limit
0.08 -0.1364 -0.1757 -0.2353 0.0798 -0.2454 -0.2508
Other Reference group Reference group Reference group
Number of drinks to reach 0.08
1or 2 -0.0679 -0.1899 -0.0065 -0.0048 0.0088 -0.1220
3 or 4 0.0329 -0.0470 -0.0495 -0.0325 -0.1593 -0.2174
Non respondent 0.2568 0.4155 0.1326 -0.0837 0.2298 0.3777
5 or more Reference group Reference group Reference group
Passed an alcohol test
No -0.1245 -0.1294 -0.0716 -0.0366 -0.1264 -0.0674
Yes Reference group Reference group Reference group
Immediate suspension for impaired driving
Other 0.0723 0.0612 -0.0076 -0.1212 0.1095 0.0310
15 days Reference group Reference group Reference group
Court ordered fine
Other -0.0127 -0.0784 0.0413 -0.0737 0.0931 -0.0414
Between $500 and $999 Reference group Reference group Reference group
Zero tolernace
Agree 0.0824 -0.0424 0.0976 -0.0534 0.0936 -0.1804
Disagree Reference group Reference group Reference group
Family income
$40,000 and under 0.2455 -0.0577 0.1669 -0.1494 0.1446 -0.1909
Non respondent -0.2335 0.1980 -0.0769 0.2205 0.0456 0.4105
Table 2: Analysis of the effect of perception of the risk of being arrested for impaired driving on the frequency of violations and accumulated demerit points
2a Year after the survey
Violations Negative Binomial Demerit points Linear Regression Explanatory variable C1 STD2 C1 STD2 Perception predicted Control group Overestimate -0.092 0.948 0.117 0.644 Underestimate 2.464 1.480 1.732 1.124 Cases Overestimate 0.959 0.182 1.014 0.603 Underestimate ***4.319 1.271 ***4.522 1.053
1: Coefficient; 2: Standard deviation; Level of significance: ***1%.
2b Annually for the period from 1 June 1995 to 31 May 2003
Violations Negative Binomial Demerit points Linear Regression Explanatory variable C STD C STD Perception predicted Control group Overestimate -0.116 0.475 0.171 0.301 Underestimate ***4.807 0.755 ***3.012 0.521 Cases Overestimate 0.505 0.399 **0.668 0.277 Underestimate ***3.837 0.671 ***3.770 0.484
Table 3: Analysis of the effect of perception of the risk of having an accident while drinking-driving on the frequency of violations and accumulated demerit points
3a Year after survey
Violations Negative Binomial Demerit points Linear Regression Explanatory variable C1 STD2 C1 STD2 Perception predicted Control group Overestimate 0.268 0.795 0.529 0.539 Underestimate **2.276 1.058 **1.632 0.796 Cases Overestimate 0.427 0.882 0.777 0.650 Underestimate ***2.781 1.029 ***2.444 0.815
1: Coefficient; 2: Standard deviation; Level of significance: **5%; ***1%.
3b Annually for the period from 1 June 1995 to 31 May 2003
Violations Negative Binomial Demerit points Linear Regression Explanatory variable C1 STD2 C1 STD2 Perception predicted Control group Overestimate 0.687 0.386 **0.571 0.247 Underestimate ***4.263 0.523 ***2.567 0.358 Cases Overestimate ***1.389 0.422 ***1.369 0.296 Underestimate ***3.928 0.501 ***3.435 0.361
Table 4: Analysis of the effect of perception of the risk of having a bodily injury accident while drinking-driving on the frequency of violations and accumulated demerit points 4a Year after the survey
Violations Negative Binomial Demerit points Linear Regression Explanatory variable C1 STD2 C1 STD2 Perception predicted Control group Overestimate -0.746 0.745 0.107 0.513 Underestimate 0.480 2.050 1.040 1.502 Cases Overestimate 0.172 0.767 0.548 0.582 Underestimate **3.895 1.666 ***3.719 1.358
1: Coefficient; 2: Standard deviation; Level of significance: **5%; ***1%.
4b Annually for the period from 1 June 1995 to 31 May 2003
Violations Negative Binomial Demerit points Linear Regression Explanatory variable C STD C STD Perception predicted Control group Overestimate ***-0.993 0.368 -0.173 0.238 Underestimate 1.933 1.012 **1.569 0.380 Cases Overestimate -0.416 0.381 0.012 0.265 Underestimate **1.865 0.838 ***2.029 0.597
Table 5: Analysis of the effect of perception of the risk of having a bodily injury accident while
drinking-driving on total accidents, bodily injury accidents, violations, and demerit points. The predicted perceptions of the Control Group differ from those of the Cases
5a Year after the survey
Total accidents Logit Bodily injury accidents Logit Violations Negative Binomial Demerit points Linear Regression Explanatory variable C1 STD2 C STD C STD C STD Perception predicted Control group Overestimate 1.393 1.606 -1.794 3.477 0.146 -1.419 0.368 0.562 Underestimate 4.341 4.990 1.800 10.564 4.490 2.450 2.568 1.809 Cases Overestimate -2.286 1.349 ***-7,669 2.804 **-1.602 0.680 -0.854 0.501 Underestimate -1.856 2.506 -4.366 4.851 0.166 1.348 0.308 0.976
1: Coefficient; 2: Standard deviation; Level of significance: *10%; **5%; ***1%.
5b Annually for the period from 1 June 1995 to 31 May 2003
Total accidents Logit Bodily injury accidents Logit Violations Negative Binomial Demerit points Linear Regression Explanatory variable C1 STD2 C STD C STD C STD Perception predicted Control group Overestimate **1.441 0.605 0.817 1.339 0.105 0.399 0.307 0.263 Underestimate ***5,974 1.858 5,210 4.160 ***5,592 1.362 ***3.580 0.849 Cases Overestimate 0.431 0.441 -0.974 1.017 ***-2.097 0.329 ***-1.386 0.229 Underestimate 0.087 0.820 -2.416 1.935 -0.809 0.611 -0.256 0.435
Appendix
Table A1: Estimations of the probability of overestimating or underestimating the risk of arrest for impaired driving, using the generalized logit model
Coefficient Rating ratio
Explanatory variable βˆ
Overestimate
λˆ
Underestimate Overestimate Underestimate
Constant ***0.6709 -0.2899 Age group Under 25 -0.1477 0.1521 0.806 1.281 25–34 0.0354 0.1620 0.964 1.148 35–44 **0.1434 -0.0412 1.174 0.871 45 + Reference group 1.000 1.000 Nunber of violations None **-0.1101 *-0.1392 0.949 0.935 1 + Reference group 1.000 1.000 Speeding Never ***0.1525 0.0610 1.134 0.958
Often, sometimes, rarely Reference group 1.000 1.000
Number of drinks per week
2 or less per week *0.1248 -0.0422 1.153 0.881
3 to 5 *-0.1431 **-0.2359 0.952 0.866
Did not drink -0.0493 -0.0516 0.973 0.981
6+ Reference group 1.000 1.000
Legal alcohol limit
0.08 **-0.1547 -0.1534 0.912 0.948
Other Reference group 1.000 1.000
Number of drinks to reach 0.08
1 -0.0397 -0.2166 1.048 0.827 2 0.0109 -0.1494 1.075 0.855 3 0.0705 -0.0285 1.086 0.927 4 -0.1586 **-0.3670 0.983 0.767 Non-respondent *0.3412 *0.4629 1.124 1.252 5 + Reference group 1.000 1.000
Passed an alcohol test
Yes *0.1216 0.1212 1.070 1.040
No Reference group 1.000 1.000
Knowledge of length of an immediate suspension for impaired driving
One week or less -0.0621 *-0.3629 1.081 0.725
One month or more -0.0151 -0.0310 0.998 0.979
Non-respondent 0.2359 0.5704 0.953 1.504
15 days Reference group 1.000 1.000
Living with a partner
Yes **-0.1001 -0.0431 0.921 1.022
No Reference group 1.000 1.000
Family income
$40,000 and under ***0.2430 -0.0619 1.309 0.795
Non-respondent *-0.2488 0.1757 0.720 1.395
Over $ 40,000 Reference group 1.000 1.000
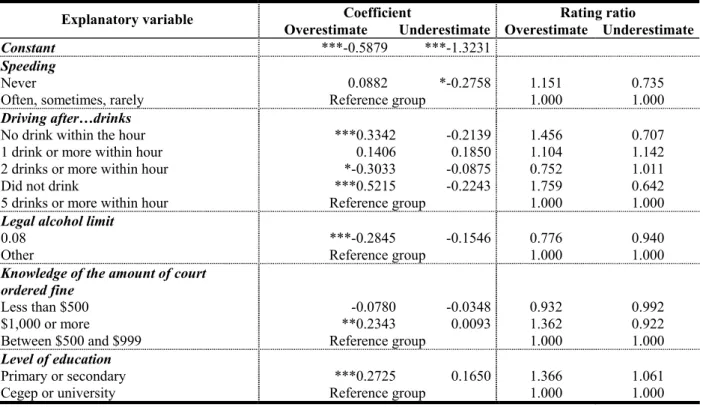
Table A2: Estimations of the probability of overestimating or underestimating the risk of having an accident while drinking-driving (Generalized Logit Model)
Coefficient Rating ratio
Explanatory variable βˆ
Overestimate
λˆ
Underestimate Overestimate Underestimate
Constant **0.3686 *-0.4154
Age group on 15 April 2002
Under 25 -0.0324 0.0861 0.935 1.111 25–34 0.0496 ***0.2446 0.947 1.340 35–44 -0.0640 **-0.1949 1.009 0.854 45 + Reference group 1.000 1.000 Number of violations None *-0.1014 **-0.1483 0.956 0.914 1 + Reference group 1.000 1.000
Weaving in and out of traffic
Rarely, never *0.0998 0.0159 1.098 0.957
Often, sometimes Reference group 1.000 1.000
Number of drinks on same occasion
1 **0.3086 0.2149 1.343 1.021
2 -0.0525 -0.1279 0.996 0.907
3 -0.0260 -0.1917 1.047 0.838
4 0.0393 **0.3506 0.891 1.387
Non respondent -0.4262 -0.3079 0.730 0.925
Did not drink 0.1753 0.0227 1.181 0.919
5 + Reference group 1.000 1.000
Legal alcohol limit
0.08 ***-0.2314 0.1138 0.757 1.376
Other Reference group 1.000 1.000
Knowledge of length of court ordered driving suspension
Under one year -0.0604 -0.1370 0.992 0.903
Over one year 0.1226 **0.3325 0.977 1.395
One year Reference group 1.000 1.000
Knowledge of length of immediate driving suspension for impaired driving
One week or less **-0.3191 -0.0567 0.743 1.127
One month or more -0.1594 0.0677 0.830 1.172
Non-respondent *0.5744 -0.3652 2.022 0.476
15 days Reference group 1.000 1.000
Knowledge of amount of court ordered fine
Less than $500 -0.1649 -0.2252 0.922 0.877
$1,000+ ***0.4160 0.1609 1.417 0.900
Non respondent -0.1602 0.0093 0.849 1.106
Between $500and $999 Reference group 1.000 1.000
Zero tolerance
Agree **0.1041 -0.0867 1.148 0.861
Disagree Reference group 1.000 1.000
Family income
$40,000 or less **0.1816 -0.1554 1.372 0.766
Non-respondent -0.0711 0.2033 0.855 1.377
More than $40,000 Reference group 1.000 1.000
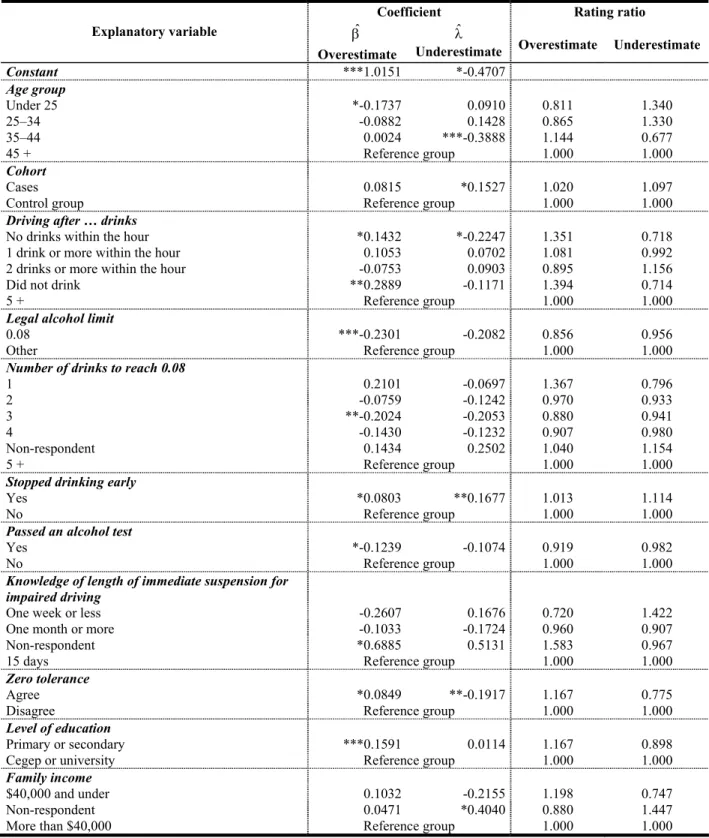
Table A3: Estimations of the probability of overestimating or underestimating the risk of having an bodily injury accident while drinking-driving (Generalized Logit Model)
Coefficient Rating ratio
Explanatory variable βˆ
Overestimate
λˆ
Underestimate Overestimate Underestimate
Constant ***1.0151 *-0.4707 Age group Under 25 *-0.1737 0.0910 0.811 1.340 25–34 -0.0882 0.1428 0.865 1.330 35–44 0.0024 ***-0.3888 1.144 0.677 45 + Reference group 1.000 1.000 Cohort Cases 0.0815 *0.1527 1.020 1.097
Control group Reference group 1.000 1.000
Driving after … drinks
No drinks within the hour *0.1432 *-0.2247 1.351 0.718 1 drink or more within the hour 0.1053 0.0702 1.081 0.992 2 drinks or more within the hour -0.0753 0.0903 0.895 1.156 Did not drink **0.2889 -0.1171 1.394 0.714 5 + Reference group 1.000 1.000
Legal alcohol limit
0.08 ***-0.2301 -0.2082 0.856 0.956
Other Reference group 1.000 1.000
Number of drinks to reach 0.08
1 0.2101 -0.0697 1.367 0.796 2 -0.0759 -0.1242 0.970 0.933 3 **-0.2024 -0.2053 0.880 0.941 4 -0.1430 -0.1232 0.907 0.980 Non-respondent 0.1434 0.2502 1.040 1.154 5 + Reference group 1.000 1.000
Stopped drinking early
Yes *0.0803 **0.1677 1.013 1.114
No Reference group 1.000 1.000
Passed an alcohol test
Yes *-0.1239 -0.1074 0.919 0.982
No Reference group 1.000 1.000
Knowledge of length of immediate suspension for impaired driving
One week or less -0.2607 0.1676 0.720 1.422 One month or more -0.1033 -0.1724 0.960 0.907
Non-respondent *0.6885 0.5131 1.583 0.967 15 days Reference group 1.000 1.000
Zero tolerance
Agree *0.0849 **-0.1917 1.167 0.775
Disagree Reference group 1.000 1.000
Level of education
Primary or secondary ***0.1591 0.0114 1.167 0.898 Cegep or university Reference group 1.000 1.000
Family income
$40,000 and under 0.1032 -0.2155 1.198 0.747
Non-respondent 0.0471 *0.4040 0.880 1.447 More than $40,000 Reference group 1.000 1.000