AVIS
Ce document a été numérisé par la Division de la gestion des documents et des archives de l’Université de Montréal.
L’auteur a autorisé l’Université de Montréal à reproduire et diffuser, en totalité ou en partie, par quelque moyen que ce soit et sur quelque support que ce soit, et exclusivement à des fins non lucratives d’enseignement et de recherche, des copies de ce mémoire ou de cette thèse.
L’auteur et les coauteurs le cas échéant conservent la propriété du droit d’auteur et des droits moraux qui protègent ce document. Ni la thèse ou le mémoire, ni des extraits substantiels de ce document, ne doivent être imprimés ou autrement reproduits sans l’autorisation de l’auteur.
Afin de se conformer à la Loi canadienne sur la protection des renseignements personnels, quelques formulaires secondaires, coordonnées ou signatures intégrées au texte ont pu être enlevés de ce document. Bien que cela ait pu affecter la pagination, il n’y a aucun contenu manquant.
NOTICE
This document was digitized by the Records Management & Archives Division of Université de Montréal.
The author of this thesis or dissertation has granted a nonexclusive license allowing Université de Montréal to reproduce and publish the document, in part or in whole, and in any format, solely for noncommercial educational and research purposes.
The author and co-authors if applicable retain copyright ownership and moral rights in this document. Neither the whole thesis or dissertation, nor substantial extracts from it, may be printed or otherwise reproduced without the author’s permission.
In compliance with the Canadian Privacy Act some supporting forms, contact information or signatures may have been removed from the document. While this may affect the document page count, it does not represent any loss of content from the document.
Effeet of modeling methods on the body and head-neek-trunk moments of inertia ealculations in individuals of different morpliology
by
Mohsen Damavandi Département de Kinésiologie
Thesis submitted to the Faculté des études supérieures in partial fulfillment ofthe requirements for the degree of Philosophiae Doctor (Ph.D.)
en sciences de l'activité physique
February 2008
© Mohsen Damavandi, 2008
This thesis entitled:
Effeet of modeling methods on the body and head-neek-trunk moments of inertia calculations in individuals of different morphoJogy
presented by
Mohsen Damavandi
Was evaluated by the following examining committee:
Committee President: Thesis Supervisor: InternaI Examiner: Externai Examiner:
Representative ofthe Dean:
Yvan Girardin, Ph.D. Paul Allard, Ph.D., P.Eng. François Prince, Ph.D. David Pearsall, Ph.D. Jacques Bélair, Ph.D.
RÉSUMÉ
Le moment d'inertie segmentaire (MOI) peut être estimé d'après des données obtenues de cadavres ou de sujets vivants en utilisant différentes méthodes. Les études sur les cadavres ne peuvent être appliquées sur des populations spéciales, tandis que les études sur des sujets vivants sont onéreuses, invasives, ou dépendent de suppositions limitatives. La présente étude a été menée pour développer deux nouvelles méthodes in-vivo personnalisées, basées sur la dynamique inverse et l'approche du moment angulaire, pour estimer les valeurs de MOI du corps moins les segments des pieds et du complexe tête-cou-tronc. La méthode du moment angulaire fut préférée à la dynamique inverse pour estimer les valeurs de MOI du complexe tête-cou-tronc à cause de sa plus faible variabilité. Pour calculer les valeurs de MOI du complexe. tête-cou-tronc sa masse et la localisation du centre de masse (COM) furent requis. Une nouvelle technique de plate-forme a d'abord été développée pour éviter l'utilisation des tables anthropométriques. Pour identifier la précision des méthodes proposées, leurs valeurs de MOI furent comparées à celle de de Leva, Hanavan et Jensen, chez des sujets ayant' des morphologies normales, minces et obèses, pour vérifier si les méthodes se comportent de façon similaire à la méthode de de Leva.
Pour les valeurs de MOI du corps moins les pieds, aucune différence significative ne fut observée (p<O.05) entre les méthodes dans le groupe normal. Les valeurs de MOI des approches de dynamique inverse et de moment angulaire étaient en moyenne 17.3% plus élevées pour les participants obèses, et 13.3% plus faibles pour les participants minces (p<O.05) que les valeurs de MOI de la méthode de de Leva en référence aux trois axes principaux. Des coefficients de corrélation de Pearson ont montré que toutes les méthodes se sont comportées de façon similaire à la méthode de de Leva pour estimer les valeurs de MOI du corps moins les pieds dans les trois groupes morphologiques', à l'exception de la méthode de Jensen. Les méthodes de dynamique inverse et de moment angulaire se sont
avérées sensibles aux valeurs de MOI pour diverses populations, spécialement pour les populations mines et obèses.
Des variations considérables ont été notées entre les méthodes pour estimer la masse et la position du COM du complexe tête-cou-tronc. Bien que des différences significatives aient été notées (p<0.05), la nouvelle technique de plate-forme a procuré des valeurs à l'intérieur de l'étendue des autres méthodes. Cette technique possédait en moyenne une corrélation plus faible (0.57) avec la méthode de de Leva pour la position du COM en comparaison aux autres méthodes. Ceci pourrait représenter une plus grande sensibilité de la nouvelle technique de plate-forme de force pour calculer la position du COM segmentaire dans différents groupes morphologiques.
Pour les valeurs de MOI du complexe tête-cou-tronc du groupe normal, les résultats étaient comparables bien que des différences (p<0.05) furent notées entre les méthodes de Hanavan et de de Leva. Pour les sujets minces et obèses, la méthode du moment angulaire a donné des valeurs MOI dans l'étendue des autres méthodes pour les trois axes principaux et s'est montrée sensible aux valeurs MOI pour différents types de morphologies. Cette méthode implique des calculs directs des valeurs du MOI des segments tout en évitant les limitations des autres méthodes.
En général, cette étude souligne l'importance de méthodes in-vivo personnalisées pour estimer les valeurs de MOI du corps et de ses segments dans une population comprenant différentes morphologies. II est attendu que ce travail peut procurer plus de précision sur les paramètres d'inertie segmentaire, spécialement dans des populations minces et obèses.
Mots clés: Moment d'inertie, modèle de pendule inversé, dynamique inverse, moment angulaire, technique de plate-forme de force, morphologie corporelle, corps entier moins les pieds, complexe tête-cou-tronc
ABSTRACT
Segment moment of inertia (MOI) can be estimated from data obtained . from cadavers or living individuals using different methods. Thecadaver studies cannot be applied for special populations while living subject studies are expensive, invasive, or rely on sorne limiting assumptions. The present study was conducted to develop two novel in-vivo personalized methods based on inverse dynamics and angular momentum approaches to estimate MOI values of the body less the feet and head-neck-trunk segments. The angular momentum method was preferred over the inverse dynamics to estimate the head-neck-trunk's MOI values because of its less variability. To calculate ~he head-neck-trunk MOI values its mass and center of mass (COM) location are required. A new force-plate technique was first developed to avoid the use of anthropometric tables. To identify the accuracy of the proposed methods, their MOI values were compared to those of de Leva, Hanavan, and Jensen in subjects having a normal, lean, and obese morphology, and verified if the methods behaved similarly to the de Leva method.
For the body less the feet MOI values, no significant difference (p<O.05)
was observed between the methods in normal group. The MOI values of the inverse dynamics and angular momentum approaches were in average 17.3% higher for obese, and 13.3% lower for leanparticipants (p<O.05) than those of the de Leva method about the three principal axes. Pearson coefficients of correlation showed aIl the methods behaved similarly with de Leva method to estimate the MOI values of the body less the feet in the three morphological groups except for Jensen's metho<;l. The inverse dynamics and angular momentum methods appeared to be sensitive to estimate the MOI values in various populations especially lean and obese.
Considerable variations were noted between the methods to estÎmate the head-neck-trunk's mass and COM position. Though significant differences were
noted (p<0.05), the new force-plate technique provided values within the range of the other methods. This technique had in average a lower correlation (0.57) with the de Leva method for COM position compared to the other methods. This might represent more sensitivity of the new fotce-plate technique to calculate the segment's COM position in different morphological groups.
For the head-neck-trunk's MOI values in normal group, the results were comparatively similar though differences (p<0.05) were noted between the Hanavan and de Leva methods. For the lean and obese subjects, the angular momentum method gave the MOI values at the range of theother methods for the three principal axes and was noted to be sensitive to estimate the MOI values in different body morphologies. This method invcilves direct calculations of the segment's MOI values while avoiding the limitations of the other methods.
In General, this study underlines the importance of in-vivo personalized methods to. estimate the MOI values of the body and its segments in population with different morphology. It is anticipated that this work can provide greater accuracy of segment inertial parameters especially in lean and obese populations.
Key words: Moment of inertia, mverse pendulum model, inverse dynamics, angular momentum, force-plate technique, body morphology, whole body less the feet, head-neck-trunk
T ABLE CONTENTES
RÉSlJMÉ ... ',' ... iii
ABSTRACT ... v
LIST OF TABLES ... xii
LIST OF FIGURES ... xviii
LIST OF APPENDICES ... xxi
LIST OF ABBREVIATIONS ... xxii
DEDICATION ... : ... xxiii
AC~O~LEDGEMENT ... xxiv
Chapter 1 1. INTRODUCTION ... 1
1.1 Relationship between MOI values and body morphology ... 3
1.2 Current methods to estimate body segment moments of inertia ... .4
1.3 General objectives of the study ... 9
Chapter 2 2. REVIE~ OF LITERA TURE ... 11
2.1 Review of body and its segments' MOI estimation methods ... 11
.2.1.1 Cadaver studies ... : ... I l 2.1.2 Geometrical modeling ... 15
2.1.3 Imaging techniques ... : ... 18
2.1.5 Oscillation techniques ... 28
2.2 MOI values of the whole body less the feet and head-neck-trunk in individuals of different morphology ... 34
2.3 Methods to estimate MOI values of thewhole body less the feet and . head-neck-trunk ... , .36
2.4 Specifie objectives of this thesis ... 39
Chapter 3 3. METHODS ... 41
3.1 Subjects ... 41
3.2 Moment of inertia of the whole body less the feet ... .43
3.2.1 Anthropometric, geometric, and photogrammetric methods ... .43
3.2.2 Inverse dynamics and angular momentum methods ... 50
3.2.2.1 Data collection to calculate MOI ofthe whole body less the feet by the inverse dynamics and angular momentum methods ... 54
3.3 Moment of inertia of the head-neck-trunk segment ... 59
3.3.1 Anthropometric, geometric, and photogrammetric methods ... 59
3.3.2 Angular momentum method ... 60
3.3.2.1 Calculations to estimate the segments' mass and COM position using a new force-plate technique ... 60
3.3.2.2 Data collection for the new force-plate technique to calculate segments' mass and COM position ... 64 3.3.2.3 Data collection for the angular momentum method to c~lculate
head-neck-trunk segment's MOI values ... 67
3.4 Data analysis ... ... 71
Chapter 4 4. RESULTS ... : ... 73
4.1 Whole body less the feet moment ofinertia results ... 73
4.1.1 Whole body less the feet MOI of the normal BMI range ... 74
4.1.2 Whole body less the feet MOI of the lean group ... 76
4.1.3 Whole body less the feet MOI of the obese group ... 78
4.1.4 Pearson coefficients of correlation of the whole body less the feet MOL ... 80
4.2 Head-neck-trunk segment's mass and COM position ... ... 81
4.2.1 Head-neck-trunk segment mass ... 82
4.2.2 Head-neck-trunk segment COM position ... 84
4.2.3 Pearson coefficients of correlation of the head-neck-trunk mass and COM position ... 86
4.3 Head-neck-trunk moment of inertia ... .. 87
4.3.1 Head-neck-trunk moment ofinertia of the normal BMI range ... 88
4.3.2 Head-neck-trunk moment ofinertia of the lean group ... 89
. 4.3.3 Head-neck-trunk moment ofinertia of the obese group ... 91
4.3.4 Pearson coefficients of correlation of the head-neck-trunk MOI values ... 92
Chapter 5
5. DISCUSSION ... 94 5.1 Effeet of the modeling methods to estimate the MOI values of the
whole body less the feet in individuals. of different body morphology ... 95 5.2 Comparison of the modeling methods to estimate the MOI values of
the wliole body less the feet in individuals of different body
/
morphology ... '" ... 102 5.3 Effect of the modeling methods to estimate the mass, COM, and MOI
values of head-neck-trunk in individuals of different body morphology ... : ... 104 5.3.1 Effeet of methods to estimate head-neek-trunk mass and COM
position in individuals of different body morphology ... 104 5.3.2 Effeet of the modeling methods on the MOI values of
head-neek-trunk in individuals of different body morphology ... 111 5.4 Similarity of the modeling methods to estimate the MOI values of
head-neck-trunk in individuals of different body morphology ... 118 5.5 Limitations of the study ... ; ... 119 "5.6 Future studies ... 122
Chapter 6
LIST OF TABLES
Table 3.1. Means and (standard deviations) of age, mass, height and body mass index (BMI) of normal, lean and obese morphological groups along with the number of subjects (n) in each morphological group ... .42
Table 4.1. Means, standard deviations, and ranges of the moment of inertia (kg.m2) for the whole body less the feet calculated at the center of mass of subjects
with a normal BMI along with the % difference between de Leva (1996) method and the other methods. Data are presented for antero-posterior (AP), medio-Iateral (ML), and longitudinal (LG) axes ... 75
Table 4.2. Means, standard deviations, and ranges of the moment of inertia (kg.m2) for the whole body less the feet calculated at the center of mass of subjects
with a lean BMI along with the % difference between de Leva (1996) method and the other methods. Data are presented for antero-posterior (AP), medio-Iateral (ML), and longitudinal (LG) axes ... 77
Table 4.3. Means, standard deviations, and ranges of the moment of inertia (kg.m2) for the whole body less the feet calculated at the center of mass of subjects
with an obese BMI along with the % difference-between de Leva (1996) method and the other methods. Data are presented for antero-posterior (AP), medio-Iateral (ML), and longitudinal (LG) axes ... 79
Table 4.4. Pearson coefficients of correlation (p values) of th~ moment of inertia estimations between de Leva method and the other approaches for the normal, lean, and obese morphological groups about the antero-posterior (AP), medio-lateral (ML), and longitudinal (LG) axes ... 81
Table 4.5. Means, standarddeviations (S.D.), and the ratios (S.D.) of head-neck-trunk mass (kg) as a percent of wholebody mass (WBM) along with the % difference between the de Leva (1996) method and the other method. Data are presented for lean (L), normal (N), and obese (0) morphological groups ... 83
Table 4.6. Means and standard deviations (S.D.) of trunk-head-neck center of mass location to the hip joint center (cm), along with the ratios (S.D.) as a % of segment length (SL) and the % difference between the de Leva (1996) method and the other methods. Data are presented for lean (L), normal (N), and obese (0) morphological groups ... 85
Table 4.7. Pearson coefficients of correlation (p values) of the head-neck-trunk segment' s mass and center of mass'location between de. Leva method and the other approaches. Data are presented for the lean (L), normal (N), and obese (0) morphological groups ... , ... 87
Table 4.8. Means and standard deviations of head-neck-trunk moments of inertia (kg/m2) of subjects with a normal BMI, along with radii of gyration (S.D.) as a %
of the segment length (SL) and the % difference between the de Leva (1996) method and the other methods. Data· are presented for antero-posterior (AP), medio-Iateral (ML), and longitudinal (LG) axes ... 89
Table 4.9. Means and standard deviations ofhead-neck-trunk moments of inertia (kg/m2) of subjects with a lean BMI, along with radii of gyration (S.D.) as a % of
the segment length (SL) and th~ % difference between the de Leva (1996) method and the other methods. Data are presented for antero-posterior (AP), medio-Iateral (ML), and longitudinal (LG) axes ... 90
Table 4.10. Means and standard deviations ofhead-neck-trunk moments ofinertia (kg/m2) of subjects with an obese BMI, along with radii of gyration (S.D.) as a %
of the segment length (SL) and the % difference between the de Leva (1996) method and the other methods. Data are presented for antero-posterior (AP), medio-lateral(ML), and longitudinal (LG) axes ... 92
Table 4.11. Pearson coefficients of correlation (p values) of the head-neck-trunk moment of inertia estimations between de Levathethod and the other approaches for the normal, lean, and obese morphological groups about the antero-posterior (AP), medio-lateral (ML), and longitudinal (LG) axes ... 93
Table B.1. Means, standard deviations (S.D.), and the ratios (S.D.) of upper arm mass (kg) as a percent of whole body mass (WBM) along with the % difference
between the de Leva (1996) method and the other method. Data are presented for lean (L), normal weight (N), and obese (0) subjects ... 148
. Table B.2. Means and standard deviations (S.D.) of upper arm center of mass location to the shoulder joint center (cm), along with the rations (S.D.) as a % of segment length (SL) and the % difference between the de Leva (1996) method and the other methods. Data are presented for lean (L), normal weight (N), and obese (0) subjects ... 149
Table B.3. Means, standard deviations (S.D.), and the ratios (S.D.) offorearm and hand mass (kg) as a percent of whole body mass (WBM) along with the % difference between the de Leva (1996) method and the other method. Data are presented for lean (L), normal weight (N), and obese (0) subjects ... 150
Table B.4. Means and standard deviations (S.D.) of forearm and hand center of mass location to the elbow joint center (cm), along with the.rations (S.D.) as a %
of segment length (SL) and the % difference between the de Leva (1996) method and the other methods. Data are presented for lean (L), normal weight (N), and obese (0) subjects ... 151
Table B.5. Means, standard deviations (S.D.), and the ratios (S.D.) of total arm mass (kg) as a percent of whole body mass (WBM) along with the % difference
between the de Leva (1996) method and the other method. Data are presented for lean (L), normal weight (N), and obese (0) subjects ... . 152
Table B.6. Means and standard deviations (S.D.) of total arm center of mass location to the shoulder joint center (cm), along with the rations (S.D.) as a % of segment length (SL) and the % difference between the de Leva (1996) method and the other methods. Data are presented for lean (L), normal weight (N), and obese (0) subjects ... 153
Table B.7. Means, standard deviations (S.D.), and the ratios (S.D.) ofthigh mass (kg) as a percent ofwhole body mass (WBM) along with the % difference between the de Leva (1996) method and the other method. Data are presented for lean (L), normal weight (N), and obese (0) subjects ... 154
Table B.S. Means and standard deviations (S.D.) of thigh center of mass location to the hip joint center (cm), along with the rations (S.D.) as a % of segment length (SL) and the % différence between the de Leva (1996) method and the other methods. Data are presented for lean (L), normal weight (N), and obese (0) subjects ... , ... 155
Table B.9. Means, standard deviations (S.D.), and the ratios (S.D.) of leg and foot mass (kg) as a percent of whole body mass (WBM) along with the % difference
between the de Leva (1996) method and the other method. Data are presented for lean (L), normal weight (N), and obese (0) subjects ... . 156
Table B.IO. Means and standard deviations (S.D.) of leg and foot center of mass location to the knee joint center (cm), a10ng with the rations (S.D.) as a % of segment length (SL) and the % difference between the de Leva (1996) method and
the other methods. Data are presented for lean (L), normal weight (N), and obese (0) subjects ... 157
Table B.U. Means, standard deviations (S.D.), and the ratios (S.D.) of total leg mass (kg) as a percent of whole body mass (WBM) along with the % difference
between the de Leva (1996) method and the other method. Data are presented for lean(L), normal weight (N), and obese (0) subjects ... 158
Table B.12.Means and standard deviations (S.D.) of total leg center of mass location to the hip joint center (cm), along with the rations (S.D.) as a % of segment length (SL) and the % difference between the de Leva (1996) method and the other methods. Data are presented for lean (L), normal weight (N), and obese (0) subjects ... 159
LIST OF FIGURES
Figure 2.1. Lateral and frontal views of 17-segment of geometrical model (Adapted from Hatze, 1980). The shapes of the segments and local (segment fixed) coordinate systems are also shown ... : ... 17
Figure 2.2. Lateral and frontal views of 16-segmentphotogrammetry model (Adapted from Jensen, 1978). X, Y, and Z indicate antero-posterior, medio-lateral, and longitudinal directions of the body ... 19
Figure 2.3. Recording positions, A) anterior view, B) ~ateral view (left side), C) coronal view. (Adapted from Baca, 1996) ... 22
Figure 2.4. Example of a whole body scan of human using a dual energy x-ray absorptibmeter. Attenuation coefficients based on x-ray absorption values are recorded in elements of x-ray detector, resulting in samples of mass per whble body scan. (Adapted from Durkin et al. 2002) ... 26
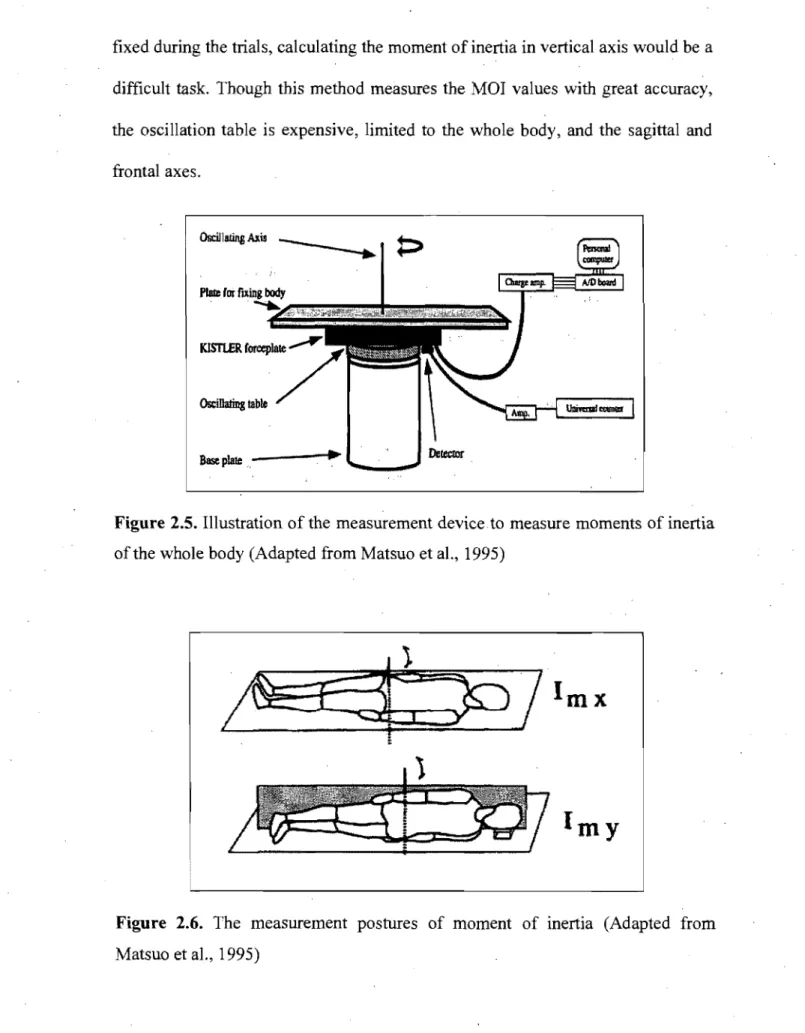
Figure 2.5. Illustration of the measurement device to measure moments of inertia of the whole body (Adapted from Matsuo et al., 1995) ... ~ ... 30
Figure 2.6. The measurement postures of moment of inertia (Adapted from Matsuo et al., 1995) ... 30
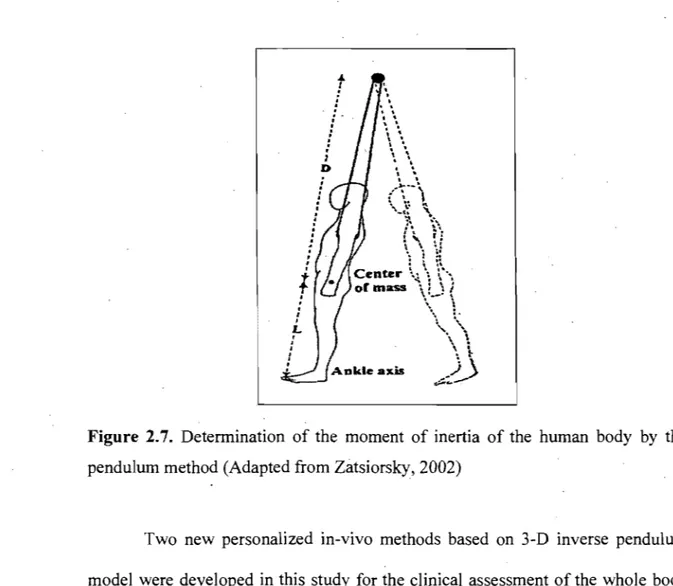
Figure 2.7. Detennination of the moment of inertia of the human body by the pendulum method (Adapted from Zatsiorsky, 2002) ... 32
Figure 3.1. Hanavan's (1964) geometrical model of the body. (Adapted from Robertson et al., 2004). The body segments are considered as geometric shapes and numbered as defined by Hanavan (1964) ... .46
Figure 3.2. A) Frontal, B) Lateral views of a subject for the photographs. The pictures were taken simultaneously by two digital cameras. The cameras-subject distance was 4.5 meters ... 48
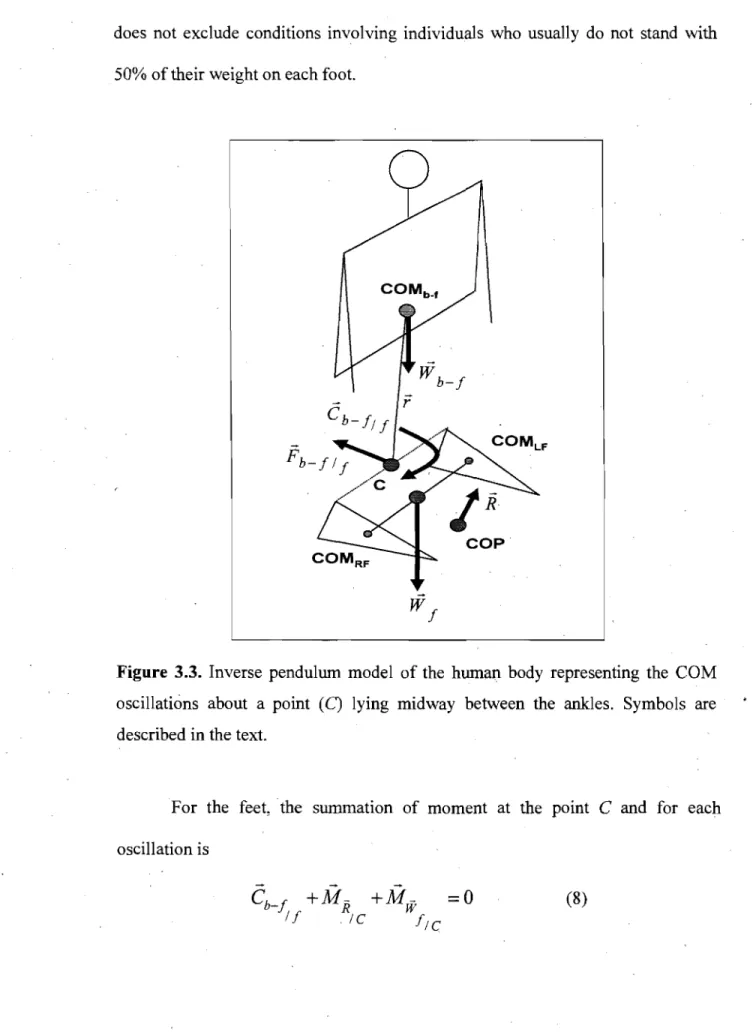
Figure 3.3. Inverse pendulum model of the human body representing the COM oscillations about a point (C) lying midway between the ankles. Symbols are described in the text ... 51
Figure 3.4. Illustration of the three self-imposed oscillations of the whole body less the feet on: A) antero-posterior, B) medio-Iateral, and C) longitudinal axes through a mid-point between the ankles ... 57
Figure 3.5. Illustration of the change in center of pressure as related to the change in segmental center of mass location during quite standing on the force-plate ... 62
Figure 3.6. Illustration of the change in moments as related to the change in segmental center ofmass location during lying on the reaction board .... , ... 64
Figure 3.7. Illustration of the markers put over the right upper and lower limbs calculated COM positions, malleoli, right humerai head, and greater trochanters to determine the horizontal positions of the upper and lower limbs ... 68
Figure 3.8. Illustration of the three self-imposed oscillations of the upper and lower extremities about: A and D) antero-posterior, B and E) medio-Iateral, and C and F) longitudinal axes through the related proximal joint centers ... ~ ... 70'
LIST OF APPENDICES
Appendix A: Research approval by Sainte-Justine Hospital Ethics Committee ... . ... " ... 147
Appendix B: Mass and COM positions of the upper and lower limbs and their sub-segments ... : ... ... 148
LIST OF ABREVIATIONS
2-D Two-dimensional
3-D Three-dimension
ANOVA Analysis of variance AP Anterior-posterior axis
BMI Body mass index
cm Centimeter
COM Center of mass
COP Centers of pressure
CT Computerized tomography
DEXA Dual energy x-ray absorptiometry
Hz Hertz
LG Longitudinal axis
ML Medio-Iateral axis
mm Mil1imeter
MOI Moments of inertia
MRI Magnetic resonance imaging
s
SecondACKNOWLEDGEMENTS
This thesis would not have been possible without the support and generosity of sorne very special people who devoted their time and energy to provide me with their valuable contributions.
1 wish to extend my sincere thanks to my supervisor, Dr. Paul Allard for giving me the opportunity to study in his laboratory. His belief in me always has been an inspiration, and his wisdom, patience and challenging supervision of this thesis, have been extremely indispensable. 1 am thankful to have had the chance to be his student; his encouragement has prepared me for my future endeavors.
l would like to acknowledge the Ministry of Sçience, Research and Technology of the Islamic Republic ofIran for financial support during my studies to do my degree in Canada.
Many thanks also to my co-workers and friends, especially Dr. Nader Farahpour, Dr. Franck Barbier, and Dr. Julien Leboucher for their technical assistance.
Finally, 1 would like to acknowledge my debt to my dear wife for her tolerance, take care of our daughter, Nahid, and her understanding during my studies.
1. INTRODUCTION
Biomechanical ana1ysis of the human body requires accurate segment inertial parameters that include mass, center of mass (COM) location, and moments of inertia (MOI). MOI values are necessary to calculate joint muscle moments during gait, sport activities, etc. Most often these values are estimated from anthropometric tables obtained from a limited number of elderly male cadavers (Dempster, 1955; Chandler et al., 1975). Though these values can be applied to most able-bodied adults, they do not represent accurately the adolescent population (Reid and Jensen, 1990) or individuals with distinct morphologies like children (Jensen, 1986), the obese (Pearsall et al., 1994), and scoliotic populations to name a few. In these special populations body segment proportions are differènt from those found in the anthropometric tables (Zatsiorsky, 2002). Improving the specificity of
the
MOI estimation techniques for individual body type, gender, and age groups could reduce errors in biomechanical ca1culations (Jensen, 1993).The limitations in using cadaver-based methods to estimate MOI values led to alternative techniques where measures were taken from living subjects. These techniques include among others geometrical modeling (Hanavan, 1964), photpgrammetry (Herron et al., 1974; Jensen, 1 ~78; McConville et al., 1980), gamma mass scanning (Zatsiorsky and Seluyanov, 1983, 1985), computerized tomography (CT) imaging (Ackland et al., 1988), magnetic resonance imaging
(MRI) (Cheng et al., 2000), and dual energy x-ray absorptiometry (DEXA) (Durkin and Dowling, 2003). However, the se methods have also sorne limitations. For instance, in the photogrammetrie method a uniformed density of the mass distribution in each body segment is assumed. This assumption could lead to an overestimation of the mass and MOI valùes of sorne of the body segments such as the trunk (Jensen and Fletcher, 1994; Plagenhoef et al., 1983). Gamma mass scanning technique (Zatsiorsky and Seluyanov, 1983,1985) has the ability to measure mass distribution within each body segment. However, Reid and Jensen (1990) reported that a wide range of differences in segment inertial parameters were noted between various populations. Though the radiation techniques provide accurate MOI measurements (Pearsall et al., 1996) the se are expensive and rely on the use of well-trained operators. In addition, sorne radiation techniques like DEXA are able to provide MOI values only in the frontal plane (Durkin and Dowling, 2003). Personalized in-vivo methods where no assumption is made on segments' shape and density could be more appropriate to estimate the MOI values in a clinical or biomechanicallaboratory setting.
In this chapter, the relationship between the MOI values and the body morphology will be addressed. This will be followed by a description of the cUITent methods to estimate the MOI values for the whole body and particularly for the trunk in relation to body morphology. The need for new personalized
in-.
.
kind of population will be outlined as weIl. Finally, the general objectives of this thesis will be presented.
1.1 Relationship beiWeen MOI values and body morphology
The moment of inertia of a body segment depends on its mass and on the distribution of mass within the body with respect to the axis of rotation. The distribution of mass about the given axis is represented by the radius of gyration. Pearsall et al. (1996) and Durkin and Dowling (2003) reported that segments' mass expressed as a percentage of the total body mass, and radii of gyration of body segments are different in people of various body morphologies. With respect to the wholebody, MOI values strongly depend on body size. Body mass and MOI values are approximately proportional to the subject's height to the third and fifth power, respectively (Zatsiorsky, 2002). Consequently small changes in body size could result· in large changes in the MOI values. This can be appreciated in growing children and subjects of different morphologies.
MOI values vary within and between different populations, such as males and females, different races, and sports groups (Reid and Jensen, 1990). Considerable changes in the inertial parameters occur across the life span as individuals grow (Jensen, 1986), develop, and age (Jensen, 1994; Pavol et al., 2002). CUITent MOI methods have been developed mostly based on a specific sample (e.g., old· male cadavers, young adults Caucasian). Therefore, these methods produce inaccuracies when applied to people with different morphologies than those of the original studies (Ganley and Powers, 2004). Body mass index
(BMI) is often used to classify individuals into lean, normal and obese types. To our knowledge, the effect of the MOI methods (e.g., de Leva, 1996; Hanavan, 1964) in individuals classified according to their BMI has not been investigated. These effects could provide insight into the sensitivity of the MOI models applied to population of different morphology.
1.2 Current methods to estimate body segment moments of inertia
The common methods to estimate the MOI values of the body and its segments and their effect on the accuracy of the results in population with different morphology will be briefly described to highlight their capabilities and limitations. These methods are well-known and have been applied frequently in biomechanical evaluations such as gait studies (Pearsall and Costigan, 1999; Rao et al., 2006).
Attempts to provide data on body segments' MOI values began with the onset of cadaver studies. These studies consisted of sectioning cadavers into segments and measuring the inertial parameters directly (Dempster, 1955,Clauser et al., 1969; Chandler et al., 1979). The moment of inertia of each body segment was ca1culated using a pendulum technique. Then, regression equations were developed to estimate MOI values of individual body segments. Since the radii of gyration are derived from a small sample of elderly (e.g., eight cadavers), male, and Caucasians,' the findings should be restricted to a similar population. The assumption that inertial parameters derived from cadavers vary little from the living subjects has been questioned by Clarys et al. (1984), Martin et al. (1989), and Reid (1984). Achard et al. (2006) underlined that MOI estimates based on
cadaver studies can be a source of error on kinetics analysis of huinan performance of people with distinct morphology particularly in the obèse subjects.
The shortcomings in the MOI estimations using cadaver-based methods led to alternative techniques for measuring inertial properties more directly from living subjects. The use of living subjects offers the possibility of sampling populations more adequately by increasing the size of the sample. These methods were divided into geometric, photogrammetry, scanning and imaging techniques, and oscillation techniques.
The geometrical modeling technique is based on the representation of a segment or its components by standard geometric shapes of known density. It is assumed that each segment is a single homogeneous solid such as a right elliptical cylinder or a frustum of right circular cone (Whitsett, 1963; Hanavan, 1964). Dimensions for the body segment shapes are based onanthropometric measures taken on the subject while the segments' mass is estimated from regresslOn equations based on cadaver studies (Barter, 1957). By taking additional anthropometric measures, such as mid-thigh circumferenée and knee diameter, Hanavan (1964) determined the principal moments of inertia. The accuracy of the se methods has been questioned because of the simple geometric shapes and uniform mass distribution assumptions. The single homogeneous solid assumption fails to take into consideration the shape fluctuations throughout the length of each segment, a problem recognized by Hanavan in rus report (1964, p. 39). Thus, this
model can affect segment inertial parameters especially for segments with complex contours (Rao et al., 2006).
Given the inaccuracies associated with the identification of segments as simple geometric shapes (e.g., right elliptical cylinders), photogrammetric methods were developed. To individualize body segment moment of inertia values, Jensen (1978) developed a photogrammetric method in which segments are sectioned into elliptical discs of 20 mm width. This method takes into account the differences of body segments' volume and shape in individuals with different body morphology (e.g., lean, obese) but still makes the assumption that the segment densities are known. Furthermore, the photogrammetric method was found to overestimate body segments' volume (Kaleps et al., 1984) and the principal MOI values (Hatze, 1980). Consequently, the inertialparameters obtained from photogrammetric method should be applied with caution.
Another approach to determine the segments' MOI values involves scanning the living body with various radiation techniques. For instance, Zatsiorsky and Seluyanov (1983, 1985) presented data from an extensive study on the body segment parameters of both college-aged Caucasian males and females. They used gamma mass scanning to quantify the density of incremental slices of each segment. These results were then applied to compute segmental mass distribution. This method enabled estimations of the mass, COM, and principal MOI values in three-dimension (3-D) of the body segments. Since the inertial
parameters were obtained from a young adult Caucasians population they could be misleading to individuals with different body morphology.
Other radiation techniques were developed to quantify segments' MOI values. These include CT imaging (Huang and Suarez, 1983; Reid, 1984), MRI (Mungiole and Martin, 1990; Cheng et al., 2000), and DEXA (Durkin et al., 2002). Though thesé latter approaches have the advantage of measuring the tissue distribution within in-vivo, they were not used widely owing to the health risks of radiation exposure and expenSlve instrumentation. Dual energy x-ray absorptiometry (Durkin and Dowling, 2003) was also limited to calculate the MOI values of the segments in frontal plane. Thus, they have limited application in routine clinical assessments of segment inertial parameters.
Personalized methods were mostly developed to measure MOI values of the extremities. These techniques involve an oscillation technique (Hatze, 1975) and quick-release method (Drillis et al., 1964). Both techniques require that the body part be set into oscillation while the muscles are relaxed sothat they donot influence the damped oscillations and acceleration of the oscillated limb. In the oscillation technique a segment oscillates by means of an instrumented spring, while quick-re1ease method assumes the acceleration of a rapidly accelerated segment is affected only by the segment's rotational inertia. Euler's equation of . motion is then used to estimate the oscillated limb' s moment of inertia. While these techniques can be applied to calculate the MOI values of any kind of population,
their application is limited only to the upper and lower limbs. Therefore, these techniques cannot be used to calculate the MOI values ofthe trunk segment.
Personalized in-vivo methods where no assumption is made on segments' shape and mass density could provide greater accuracy to estimate the MOI values in subjects having differentbody morphologies. Two new methods based on 3-D inverse pendulum model are proposed in this thesis to estimate the whole body less the feet MOI values. The first method is based on Barbier et al. (2003) where the huinan body is modeled as a 3-D inverse pendulum representing a point mass oscillating about the ankles (Morasso et al., 1999; Brenière, 1996). In Barbier et al. (2003) the 3-D excursion of the COM is estimated from external forces, ankle muscle moments, and inertial properties. Conversely, if the COM angular accelerations are determined from videography, then the inertial properties of the oscillating whole body can be estimated for each individual. The second method applies the angular momentum equation. It consists of tracking the body during self-imposed oscillations about the ankles by means of a video-based system and force-plate. Then, the angular momentum of the body is calculated from video data and the integration of the moments obtained by the force-plate. Since the feet are fixed to the ground during the oscillations about the three principal axes of rotation, these two methods can be applied to estimate the whole body MOI values but the feet.
Since the moments of inertia of the individual body segments may do not represent the effect of the used methods on the estimated values, these new
methods were tirst tested for the whole body less the feet. This could serve as a means of gaining insight into the sensitivity of the de Leva (1996), Hanavan (1964), and Jensen (1978) methods in subjects with different body morphologies.
Trunk represents a segment with the greatest variation of reported inertial parameters (Pearsall et al., 1994; Zatsiorsky, 2002). For instance, trunk masslbody mass ratio varies from 42.2% (Pearsall et al., 1994) to 52.4% (Chandler et al., 1975). Even when the sample is homogenous Ce.g., adult men), the range can be as large as 12.2%, from 35.8% to 48.0% (Pearsall et al., 1994). This discrepancy is due to the use of various measurement techniques, subject samples'(cadaver versus living), and segment detinitions. Employing inertial parameters ratios derived from a sample population to estimate inertial properties of distinctly different populations would lead to substantial errors. In selecting a method to estimate segments' MOI values, the age, sex, and body morphology of the sample should be considered.
1.3 General objectives of the study
The general objective of this thesis was to test the ability of two new personalized in-vivo methods (inverse dynamics and angular momentum) to estimate MOI values compared to those obtained by de Leva (1996), Hanavan (1964), and Jensen (1978) methods. Furthermore, this thesis aimed to test the effect of these methods on population with different body morphology using BMI: A new technique was developed to estimate the MOI values of the
head-neck-trunk segment and compared to the de Leva (1996), Hanavan (1964), and Jensen (1978) methods in subjects of different morphology.
2. REVIEW OF LITERATURE
This chapter reviews the most commonly used methods for the estimation of the moments of inertia of body and its segments with the objective of presenting their advantages and disadvantages. Next, the need to estimate the MOI values of the whole body less the feet and head-neck-trunk in individuals of different morphology are argued. This is followed by reviewing the methods used in this study to estimate MOI values of the whole body less the feet and head-neck-trunk segments. Finally, the chapter ends with the thesis' specific objectives.
2.1 Review of body and its segments' MOI estimation methods
The evaluation of segment inertial parameters (e.g., moment of inertia) can be classified into those conducted on cadavers and those in which living subjects were participated. This section focuses mainly on the most common methods that are clinically applied for measuring or estimating of the whole body and its segments' MOI values. The advantage and disadvantages of these methods are also discussed.
2.1.1 Cadaver studies
Attempts to provide data on segments' MOI values began in the 19th century with the onset of cadaver studies (Reid and Jensen, 1990). These studies
consisted of sectioning cadavers into segments and measurmg the inertial parameters directly. The earliest efforts at this procedure date to the works of Harless (1860), Braune and Fischer (1889), and Fischer (1906), but the most significant development was the work done by Dempster (1955). Dempster (1955) using eight male cadavers ,conducted the most extensive study on segment inertial parameters to that date. First, he used the method of Reuleaux (1876) to determine the average center of rotation at each joint by fixing two points on a segment and trac king them in two different positions of that segment. Body segments were defined by estimations of the joint centers of rotation. The lengths, masses, and volumes of cadavers' segments were measured. Dempster then calculated the location of the center of mass of the segments using a balance-plate, and the moment of inertia using the compound pendulum technique. FinaUy, Dempster (1955) created tables reporting the segmental masses as proportions of the total body mass and the locations of the centers of mass and lengths of the radii of gyration as proportions of the segment's lengths. Later, Barter (1957) working with Dèmpster's data, performed stepwise regression analysis to derive regression equations that more accurately compute segment masses.
Dempster' s study is regarded as one of the most comprehensive of the cadaver studies and the proportions reported for the segments inertial parameters have been used extensively in biomechanics research. However, these data were obtained from a smaU number of old male individuals, aU of whom were thin to sorne extent. Therefore, these proportions might provide substantial errorswhile applied for populations of distinct morphology from the thin old male cadavers.
Dempster's (1955) method glves mass, COM location, and MOI of the body segments only about a transverse axis. Its application is limited to two-dimensional (2-D) analysis of human movement and cannC?t be used in this thesis where three principal MOI values are required. However, this method could be applied to provide information in the body segments' mass and COM location.
Many other cadaver studies were conducted since Dempster' s work in order to compensate its limitations. The investigations done by Clauser et al. (1969) and Chandler et al. (1979) are noteworthy because they defined body . segments using palpable bony landmarks instead of estimated joint centers of
rotation. Clauser et al. (1969) dissected a sample of thirteen preserved male cadavers, which permitted sampling over an extended time period and thus a larger sample. The density of the preservation solution was 1.061 g.cm·3, which was
close to the average density of healthy young men (1.063 g.cm-3) as reported by
Behnke (1961). Thus, the effect of the preservation solution on total body density was considered to be negligible. However, this assumption may not hold for an obese population. Clauser et al. (1969) measured the mass and COM of each segment using techniques similar to those of the previous studies. Unfortunately, Clauser et al. (1969) did not measure the segment MOI values. Therefore, this method could not be employed for 3-D analysis ofhuman performance, as weIl.
Chandler et al. (1975) dissected six male embalmed cadavers using segmentation planes similar to those reported by Clauser et al. (1969). They produced the most comprehensive cadaver study of segment MOI values. Segment mass, CO M, and anthropometric parameters were also measured. Although
Chandler et al. (1975) cautioned that the data did not reflect the general population due to the limited number of specimens. Vaughan et al. (1992) enhanced the methods used by Chandler et al. (1975) for 3-D kinematic and kinetic investigation of the lower extremity during gait. They developed regression equations to estimate the masses of the lower extremities that inc1uded various anthropometric measures (e.g., calf and mid-thigh circumference) in addition to segment length and body mass. Therefore, these regression equations seem to take into account the segment shapes which lead to more personalized inertial properties in subjects with different morphologies (e.g., obese). Hinrichs (1985) used the anthropometric measures from Chandler et al. (1975) as predictor variables for extending. the transverse and longitudinal principal MOI values. The computed multiple linear regressions, however, were restricted to two predictor variables because of the small number of specimens. Thus, these regression equations could lead to significant errors while applied for subjects with different body types from the old male cadavers and were not employed in this study.
In general, cadaver studies have the advantage of direct measurements of segment inertial parameters. These measurements can then be used to check the accuracy of the parameters estimates determined from the other techniques while applied to subjects with similar morphology to the cadavers (e.g., old male individuals). The primary disadvantages of the cadaver studies are due to the sample size and the adequacy of the measurements. Samples are small and not representative of the population under investigation. This is particularly so for
females, children, adolescents, younger adults, subjects with abnonnalities like scoliosis, and population other than Caucasian. For instance, Dempster (1955) dissected eight males cadavers' aged 52-83 years, all of whom were emaciated to sorne extent. The body dimensions and mass distribution varybetween different races (Reid and Jensen, 1990), males and females, and period of growth in children (Jensen, 1986). In addition, Pearsall et al. (1996) reported the tissue composition and morphology after death change. Therefore, the regression equations based on cadaver studies would lead to substantial errors while applied to estimate MOI values of living subjects (Yeadon and Morlock, 1989). Their application should be restricted to a similar population from whom the data were obtained. The shortcomings in using cadaver-based methods to estimate MOI values led to alternative techniques where measures were taken from living subjects.
2.1.2 Geometrical modeling ,
Geometrical modeling techniques are based on the representation of a segment or its 'components by standard geometric shapes of known density. It is assumed that each segment is a single homogeneous solid. Geometrical modeling of the inertial properties of human body segments was pioneered by the work of Whitsett (1963). He refined an earlier model by Simmons and Gardner (1960) into a 14-segment collection of frustums of right circular cones, elliptical cylinders, spheres, and ellipsoids with inertiaparameters calculated for each geometric shape. Segment densities were taken from Dempster (1955). This method appeared to
provide more accurate inertial properties compared to cadaver-studies due to accounting for the segments geometry and dimensions.
Later, Hanavan (1964) developed a personalized geometrical model which consisted of 15 geometric shapes dependent on the anthropometry of an individual with segments' mass predicted using Barter's regression equations (1957). Hanavan's mod,el is the most popular geometrical technique (Robertson et aL,· 2004). By taking additional anthropometric measures, such as malleolus height, knee diameter, mid-thigh circumference, and biacromial breadth, Hanavan (1964) developed equations to compute the three principal moments of inertia. This method is non-invasive, easy, and fast, and appeared to provide reasonable inertial properties' of the body and its segments. Mass, COM, and MOI values of the segments about the three principal axes are calculated based on only 25 anthropometric measurements obtained from simple and inexpensive tools. However, the single homogeneous solid assumption fails to take into consideration the shape fluctuations throughout the length of sorne segments like in thin or obese subjects. Nonetheless, this model can affect MOI estimations of segments with complex shapes because of extending the segment dimensions at its end points to the whole segment's length (Rao et al., 2006).
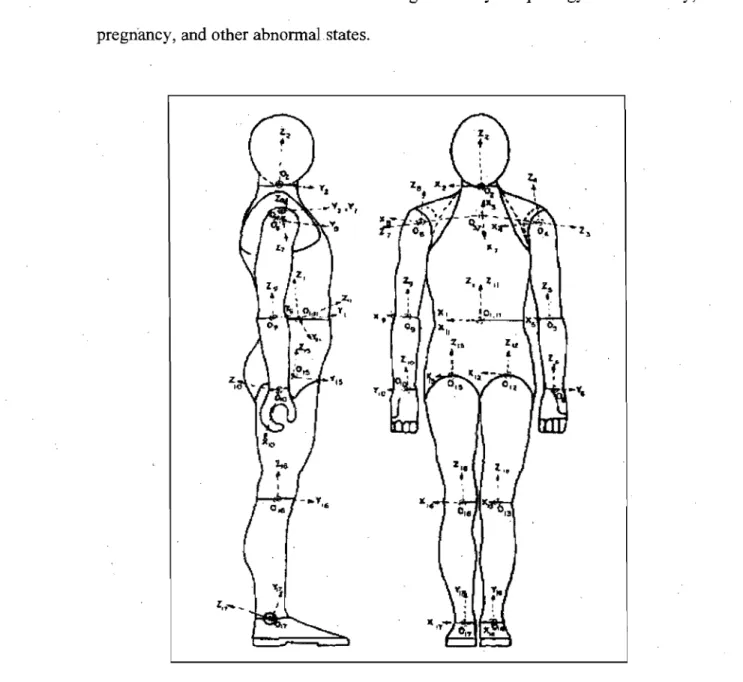
Hanavan's model (1964) has been enhanced to inc1ude more segments and their shape fluctuations. For example, Hatze(1980) developed a 17-segment model based on 242 direct anthropometric measurements and reported its use on a 12-year-old boy and three adults inc1uding a female as illustrated in Figure 2.1. The shoulders were treated as separate segments to account for their asymmetry
and density fluctuations, and variations in tissue density within segments were considered based on profiles reported by Dempster (1955) and skinfold measures. These permitted Hatze (1980) to make a more accurate asséssment of the principal moments of inertia and to account for changes in body morphology due to obesity, pregriancy, and other abnormal.states.
Figure 2.1. Lateral and frontal Vlews of 17 -segment of geometrical model (Adapted from Hatze, 1980). The shapes of the segments and local (segment fixed) coordinate systems are also shown.
Hatze (1980) reported an overall accuracy of about 3% and a maximum error of about 5%, only occasionally reaching Il %, for each of the 17 segments' mass, COM position, and MOI values. However, this method is time consuming due to complex data collection and cannot be applied as a clinical approach to estimate the MOI values of the body and its segments.
In summary, geometrical modeling of human segments has the advantage that they can be used for any population and accounts for body segments' shapes. The only assumption to be made is the segment uniform density distribution (Hanavan, 1964). However, errors can be introduced by oversimplification of segment shapes. Hatze, (1980) method requires complex data collection, additional equipment, and extensive anthropometric measurement. Thus, these methods can be applied as a validation technique rather than a clinical method to assess the body and its segments' MOI values.
2.1.3 Imaging techniques
Imaging techniques could be divided into photogrammetry and video-based approaches (radiography and magnetic resonance techniques are discussed under section 2.1.4). The photogrammetric model is based on the assumptions that the body is composed of elliptical zones and ,the segment densities are known. The elliptical zone approach was used originally by Weinbach (1938) who constructed body profiles, suchas for volume and MOI values. Jensen (1978) developed a photogrammetric method in which the human body was composed of 16 segments.
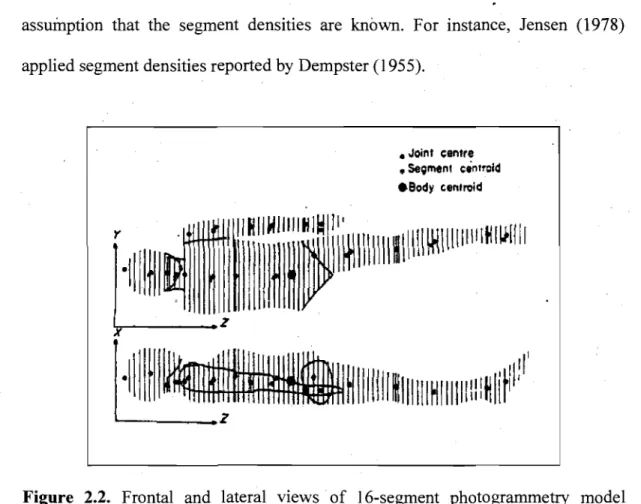
Segments were sectioned into elliptical dises of 20 mm width as showed in Figure 2.2. He used the major and miner axes Ïneasured from projected orthogonal photographie images of the body to calculate the inertial properties of the zone. Through the summation of zones and segments, the mass, COM . location, and principal MOI values of the segments and body can be estimated. This method takes into account the differences of body segments' volume and shape in individuals with different body morphology (e.g., lean, obese) but still makes the assumption that the segment densities are known. For instance, Jensen (1978) applied segment densities reported by Dempster (1955) .
• Joinf centre
• Se;menl cintrcld
.Body cenlroid
r
Il
i
Il
l
il
~
i
~
III
111111
1
[111
~IU IIIIII~ I~IIII
'v-~--_Z
·11
f
~~IIIIIII~IIIIIIHlllilliitHlir:PI
----_ _ _ z
Figure 2.2. Frontal and lateral views of l6-segment photogrammetry model (Adapted from Jensen, 1978). X, Y, and Z indicate antero-posterior, medio-lateral, and longitudinal directions of the body.
Jensen (1988) compared segment masses and MOI values estimated from the photogrammetry to those obtained from regression equations of Morlock and Yeadon (1986) and anthropometric parameters reported by Hanavan (1964). With the exception of the head and feet, aIl parameters were similar to those, of the previous studies. These results suggest that extrapolation beyond the sample age range, 4-20 years, of Jensen's study (1978)' should be possible. Finch (1985) applied the photogrammetrie method to 15 females of endomorph, mesomorph, and ectomorph to estimate their inertial properties; The predicted values were compared to the results for the adult female trom Hatze's study (1980) and the values reported by Plagenhoef (1971) and Zatsiorsky and Seluyanov (1983) and found to be reasonable. Significant differences in inertial properties were found between the different body types by the photogrammetry. This may indicate the capability ofphotogrammertic method to'estimate segment inertial parameters.
The accuracy of the photogrammetric method has also been tested with cadaver and living subject studies. For instance, Tupling et al. (1984) reported similar results of mass estimations based on immersion technique and COM and MOI estimations based on geometrical modeling, compared to photogrammetry. Nonetheless, further investigation is needed to determine the effects of variations in segments' density. Furthermore, the photogrammetric methods were found to overestimate body segments' volume (Kaleps et al., 1984) and the principal MOI values (Hatze, 1980). Generally, this method accounts for the shape fluctuations and estimates the segment inertial parameters comparable with the previous studies. Since this method is time-consuming, it is preferred to be applied as a
validation technique instead of a routine method to assess the inertia properties of the segments.
A video-based system for the determination of inertial body segment parameters was presented by Hatze and Baca (1992). They obtained a specific set of anthropometric dimensions from video images and used them as input for the 17-segment model of Hatze (1980). This model accounts for exomorphic and tissue density differences that exist between male and female subjects, for aU segmental shape fluctuations and for asymmetries occurring in the geometries of the segments. However, human factors like segment boundaries identification and . color thresholds selection were reported as the large st errors in the estimation of
the anthropometric dimensions and of the inertial properties using video images (Sarfaty and Ladin, 1993).
Later, Baca (1996) reported that a substantial reduction of these errors could be achieved if appropriate algorithms are applied when processing the images. These algorithms reduce errors originating from optical distortions, inaccurate edge-detection procedures, and user-specific upper and lower segment boundaries or threshold levels for the edge-detection. Baca (1996) developed a video-based technique that can determine the anthropometric dimensions for estimating human body segment parameters precisely. High precision was achieved by finding the location of segment boundaries with sub-pixel accuracy, the implementation of his calibration algorithms, and by taking into account the varying distances of the body segments from the recording camera. Four different
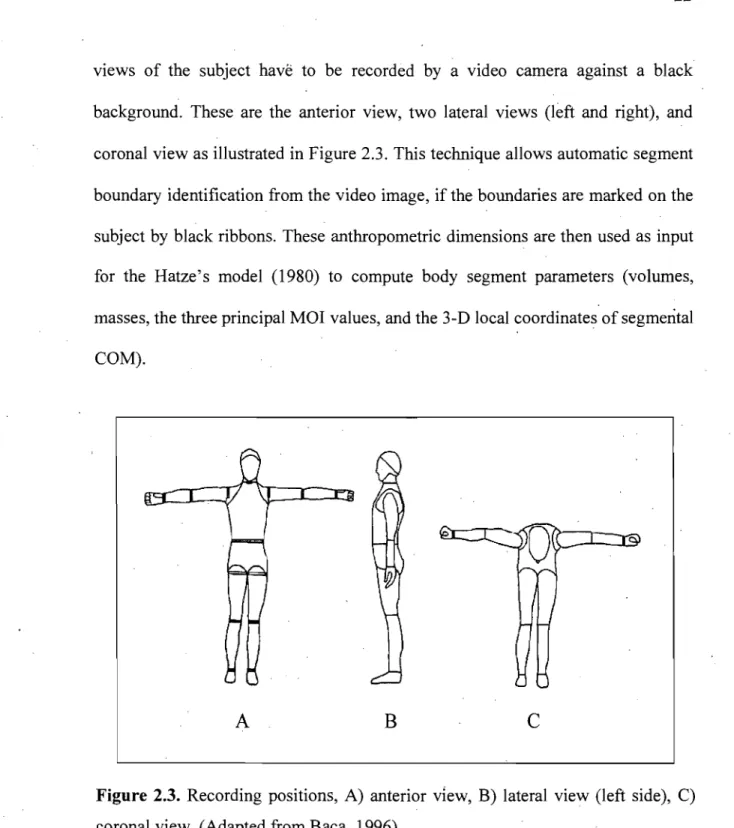
vlews of the subject havë to be recorded by a video camera against a black background. These are the anterior view, two lateral views (left and right), and coronal view as illustrated in Figure 2.3. This technique allows automatic segment boundary identification from the video image, if the boundaries are marked on the subject by black ribbons. These anthropometric dimensions are then used as input for the Hatze's model (1980) to compute body segment parameters (volumes, masses, the three principal MOI values, and the 3-D local coordinates of segmental CaM).
A
B
c
Figure 2.3. Recording positions, A) anterior view, B) lateral view (left side), C) coronal view. (Adapted from Baca, 1996)
The method reported by Baca (1996) was found to pro vide relatively accurate anthropometric dimensions from video images where these data can be
used to estimate individualized segment inertial properties. The anthropometric values computed by this method do not differ much from those based on direct anthropometric measurements. However, the segment inertial parameters errors obtained from video-based system were considerable compared to direct anthropometric measures. For instance, mass, COM position, and the MOI values had maximum errors of 7.9, 8.0, and 13.7%, respectively, compared to Hatze's model where direct anthropometric measurements were obtained. In addition, application of this method accompanied by Hatze's model (1980) stillneeds 220 anthropometric measures of subject. This is a very time-consuming technique that cannot be used as a clinical method to estimate segment inertial parameters. More practical techniques that need less acquisition time and have the ability to estimate segment inertial parameters accurately are required.
2.1.4 Scanning techniques
Though radiation techniques are mainly invasive, they can be used to estimate inertial properties of body segments~ Radiation techniques are divided ihto: gamma scanning method (Zatsiorsky and Seluyanov, 1983, 1985), dual energy x-ray absorptiometry (Durkin et al., 2002; Durkin and Dowling, 2003), biplanar radiography (Dumas et al., 2005), MRI (Martin et al., 1989; Mungiole and Martin, 1990), and CT imaging (Pearsall et al., 1996). In aIl these techniques sorne kinds of radiations (e.g., x-ray or gamma-ray) pass through the subject's body. These techniques are based on the assumption that the ability of an object to
absorb or attenuate high energy radiated rays is proportional to the density of the object and relatively independent of its composition.
Casper et al. (1971) were the first to estimate the mass, COMposition, and MOI values of an object by gamma ray imaging. Inertial parameters for wood, metal, and plastic objects were within ±1 % of criterion values. To determine the ability of gamma mass scanning in living tissue, Brooks and Jacobs (1975) applied this technique to calculate inertial properties of a leg of lamb. They compared scanner estimatès of mass, ÇOM position, and MOI values with direct measurements of the segment and found errors of 1, 2.1, and 4.8%, respectively. Later on, gamma mass scanning technique was applied by. Zatsiorsky and Seluyanov (1983) for tests on humans. They presented data from an extensive study on the 3-D body segment parameters of 100 males and 15 females coUege-aged Caucasian. The sample had a mean age of 23.8 years (SD = 6.2). To compute mass distribution, gamma mass scanning was used to quantifY the density of incremental slices of each segment. Zatsiorsky and Seluyanov (1983) used multiple linear regression models, with weight and stature as predictor variables, to estimate the mass, COM, and three principal MOI values for a total of 16 segments. These regressions equations were supplemented by a further set in which segment-specifie anthropometric measures were used as predictor variables (Zatsiorsky and Seluyanov, 1985). Comparisons of the inertial properties estimations of Zatsiorsky and Seluyanov (1983, 1985) with cadavers (e.g., Dempster, 1955; Clauser et al., 1969) and living subjects (Bernstein et al., 1931; Plagenhoef, 1971) studies
indicated that the results for most parameters were within the range of the other methods.
The inertial parameters reported by Zatsiorsky and Seluyanov (1983, 1985) were obtained from a large sample of young adult Caucasiails population. Thus, their application to a similar population would provide reasonable values. However, they could be misleading to individua1s with different body morpho10gy. This technique requires expensive instrumentation and specialized operators, and may involve high radiation 1eve1s. Thus, this method can be applied as a validation technique rather than a routine method to assess the segments inertia1 parameters.
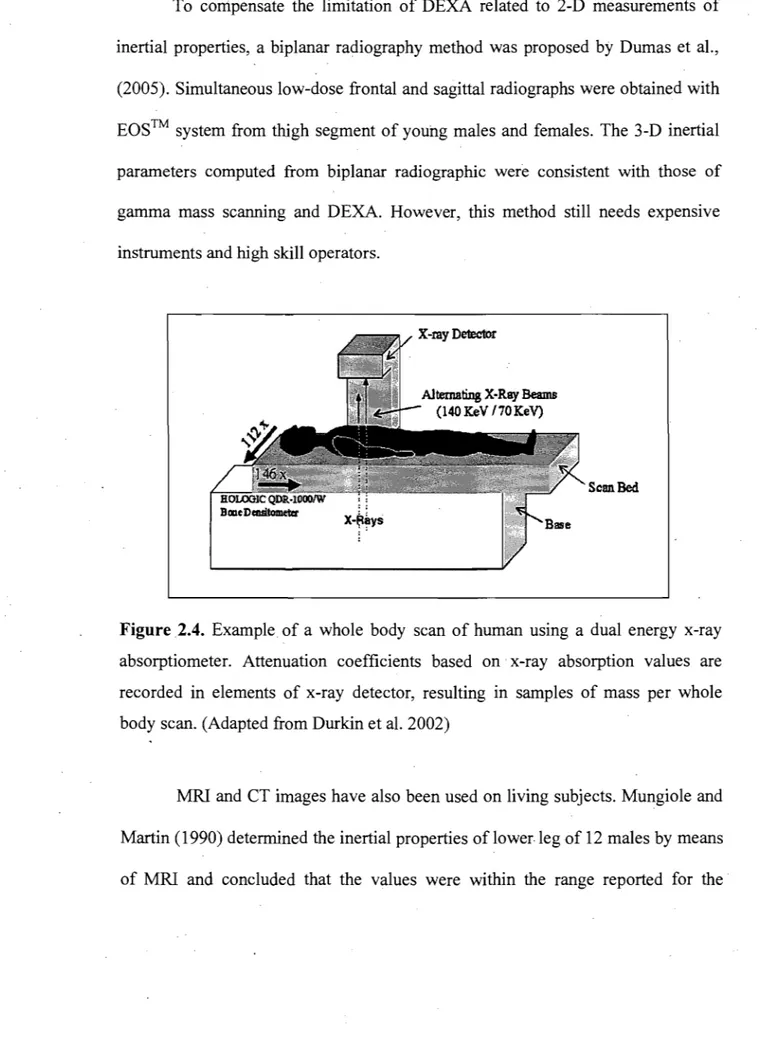
Dual energy x-ray absorptiometry (DEXA) was another radiation approach developed to ca1cu1ate inertia1 properties of the body segments (Durkin et al., 2002; Durkin and Dowling, 2003). The whole body DEXA scan is performed with the subject lying supine on the scanner table with palms facing the table as shown in Figure 2.4. Durkin and Dowling (2003) reported that this technique has the ability of measuring inertial properties with great accuracy, while the radiation exposure for a whole body scan is 1110 ofa chest x-ray. Though, regression equations were provided to estimate inertial properties of various populations, data were not taken on obese and subjects with structural abnormalities. This method needs expensive too1s and provides the MOI values of segments only in frontal plane. Therefore, this provides only 2-D measurements of the segment inertial parameters.
To corripensate the limitation of DEXA related to 2-D measurements of inertial properties, a biplanar radiography method was proposed by Dumas et al., (2005). Simultaneous low-dose frontal and sagittal radiographs were obtained with EOS™ system from thigh segment of young males and females. The 3-D inertial parameters eomputed from biplanar radiographie were consistent with those of gamma mass scanning and DEXA. However, this method still needs expensive instruments and high skiIl operators.
Scan.Bed
.
,X~~YS
Figure 2.4. Example of a whole body scan of human using a dual energy x-ray absorptiometer. Attenuation coefficients based on x-ray absorption values are recorded in elements of x-ray detector, resulting in samples of mass per whole body scan. (Adapted from Durkin et al. 2002)
MRI and CT images have also been used on living subjects. Mungiole and Martin (1990) determined the inertial properties of lower.leg of 12 males by means of MRI and concluded that the values were within the range reported for the
cadaver studies. Reid (1984) and Pearsall et al. (1994, 1996) also reported MRI and CT techniques as favorable approaches for estimation of inertial parameters of the trunk in males and females. Transverse CT images were collected at 1 cm intervals, while in MRI transverse slices of 10 mm were acquired. Cheng et al. (2000) developed a MRI technique, where magnetic resonance images were scanned at 20 mm intervals, for measuring segment inertial parameters of Chinese male subjects. They compared their calculations with those of previous studies (Dempster, 1955; Clauser et al., 1969; Martin et al., 1989; Peatsall et al., 1994) and found larger mass percentages for upper arm (4.0%) and thigh (13.6%), and smaller MOI values for the shank.
These approaches seem to be appropriate to measure segment inertial parameters in populations with different morphology. The accuracy and precision of CT and MRI were evaluated by Zhu et al. (1986). They reported smaller errors for CT and the scan time is less. However, CT has health risks of radiation exposure. The cost and availability of facilities for these techniques restrict their use in clinical situations. These methods could be applied to v(ilidate the other methods.
In summary, the radiation techniques have the ability to provide accurate 3-D measures of the inertial parameters with the exception of 3-DEXA. They can be applied in different populations. However, these methods require expensive tools and have health risks due to radiation exposure except for MRI. Though, these methods provide insight into the accuracy of the other estimation methods, their