HAL Id: hal-01558094
https://hal.univ-brest.fr/hal-01558094
Submitted on 7 Jul 2017
HAL is a multi-disciplinary open access
archive for the deposit and dissemination of
sci-entific research documents, whether they are
pub-lished or not. The documents may come from
teaching and research institutions in France or
abroad, or from public or private research centers.
L’archive ouverte pluridisciplinaire HAL, est
destinée au dépôt et à la diffusion de documents
scientifiques de niveau recherche, publiés ou non,
émanant des établissements d’enseignement et de
recherche français ou étrangers, des laboratoires
publics ou privés.
Effect of the interaural time difference on the loudness
of pure tones as a function of the frequency
Vincent Koehl, Mathieu Paquier, Etienne Hendrickx
To cite this version:
Vincent Koehl, Mathieu Paquier, Etienne Hendrickx. Effect of the interaural time difference on the
loudness of pure tones as a function of the frequency. Acta Acustica united with Acustica, Hirzel
Verlag, 2017, 103 (4), pp.705-708. �10.3813/AAA.919098�. �hal-01558094�
Effect of the interaural time difference on the loudness of pure tones
as a function of the frequency
Vincent Koehl
1), Mathieu Paquier
1), Etienne Hendrickx
1)1)
Lab-STICC (UMR CNRS 6285), University of Brest,
6 avenue Victor Le Gorgeu, 29200 Brest, France.
vincent.koehl@univ-brest.fr
Summary
1
Significant loudness variations with source azimuth
2
(i.e. directional loudness) are generally accounted for
3
by at-ear pressure modifications. An effect of the
in-4
teraural time difference (ITD) was also reported in
5
previous studies by the authors: the loudness of pure
6
tones (200 and 400 Hz) significantly increased when
7
the stimuli were presented with an ITD of 772 µs,
cor-8
responding to an azimuth of 90◦. The present study
9
aims at observing this effect for higher frequencies,
in-10
cluding frequencies at which ITD is no longer useful
11
as a localization cue. The effect of ITD on the
loud-12
ness of pure tones was thus studied at 500, 707, 1000,
13
1404 and 2000 Hz. Results show that the effect of
14
ITD on loudness is not significant above 500 Hz, even
15
for frequencies where ITD is still a localization cue.
16
The effect observed at 500 Hz is still in agreement
17
with the results reported by previous studies as the
18
loudness of a pure tone significantly increases when
19
its ITD is 772 µs.
20
1
Introduction
21
Directional loudness (i.e. loudness variations with the
22
direction of the sound source) has been highlighted
23
by presenting bands of noise through loudspeakers
lo-24
cated in various directions around a listener in an
ane-25
choic room [1, 2]. As an example, a third-octave noise
26
band centered at 5000 Hz presented by a loudspeaker
27
at an azimuth of 90◦ was perceived as being about
28
5 dB louder than when presented by a loudspeaker
29
at an azimuth of 0◦, in free field. The effect is
in-30
deed particularly salient in high frequencies when the
31
sources are located in the horizontal plane. Physical
32
modifications of the at-ear pressures caused by the
33
acoustic shadow of the head largely account for this
34
effect in this case. The directional loudness sensitivity
35
(DLS) was even reported to be significantly different
36
from zero at 400 Hz [2]. Below 500 Hz, shadowing
37
effects are usually considered rather small [3] as
vari-38
ations of ILD with the azimuth do not exceed 5 dB at
39
500 Hz and decrease for lower frequencies. Whether or
40
not these variations can be considered as small, it was
41
suspected that at-ear pressure modifications could not
42
be the only cause of directional loudness. 43
Recent studies have highlighted a significant effect 44
of interaural time differences (ITD) on the loudness of 45
low-frequency pure tones (200 and 400 Hz) at 40 phon 46
(but not at 70 phon) [4]. Loudness was significantly 47
increased by 1.25 dB when the ITD was increased 48
from 0 to 772 µs. This effect was similarly observed 49
when presenting the pure tones with an interaural 50
level difference (ILD ≤ 5 dB) [5]. This was observed 51
when ITD and ILD were congruent, but also when op- 52
posite (i.e. leading to opposite sides). As such oppo- 53
site interaural differences should compensate for the 54
lateralization induced by each other, it suggests that 55
the loudness increase with ITD is not related to the 56
perceived source lateralization but that ITD itself af- 57
fects the loudness process. 58
Above 500 Hz, it is still assumed that the varia- 59
tion of DLS with source position is mainly caused by 60
at-ear pressure modifications. However, at 5000 Hz, 61
model predictions reported that pressure modifica- 62
tions did not totally account for the loudness vari- 63
ations observed when varying the azimuth [6]. This 64
model was designed to predict binaural summation 65
for sounds differing in level at the two ears by taking 66
into account contralateral inhibitions, assuming that 67
a strong input to one ear can inhibit a weaker input 68
to the other one. A tendency for the predicted DLS 69
to be slightly below the measured values was found 70
and reached 1.7 dB for the largest deviation. Such a 71
deviation could be caused by a contribution of ITD 72
to directional loudness for frequencies above 500 Hz 73
as the binaural summation might also be affected by 74
time differences at the two ears. Therefore, the aim 75
of the present study is to observe further the effect of 76
ITD on loudness that was observed at 40 phon for 200 77
and 400 Hz, when considering frequency from 500 Hz 78
to 2000 Hz by half-octave steps. 79
2
Experimental setup
802.1
Stimuli
81Interaural time differences were applied to pure tones 82
whose frequencies were 500, 707, 1000, 1404 and 83
Koehlet al., p. 2 it was computed according to two different models;
85 Kuhn’s model [7]: 86 ITD = 3a c0 sin θinc (1)
and Woodworth’s model [8]:
87
ITD = a c0
(θinc+ sin θinc) (2)
where a = 8.75 cm is the standard head radius,
88
c0= 340 m · s−1 is the speed of sound in the air and
89
θinc is the incidence angle for a sound source in the
90
horizontal plane (i.e. azimuth). Eq. (1) provides a
91
better estimate of the ITD than Eq. (2) below 800 Hz,
92
whereas the opposite trend is observed above 1500 Hz
93
[9].
94
For θinc= 90◦, ITD = 772 µs according to Kuhn’s
95
model and ITD = 662 µs according to Woodworth’s
96
model. Smaller (607 µs), intermediate (717 µs) and
97
larger (827 µs) ITD values were also selected
accord-98
ing to a 55 µs step. Five non-zero ITD values were
99
then under study, as well as a zero ITD for
compar-100
ison. The six possible ITD values were introduced
101
between the left and right channels of initially diotic
102
pure tones by delaying one ear with respect to the
103
other one. Stimuli were presented to the subject via
104
headphones (Sennheiser HD 650, circumaural, open)
105
and the possible head movements were not
compen-106
sated. For low-frequency pure tones, ITD is an
un-107
ambiguous information as long as the period of the
108
sound is less than twice the maximum possible ITD,
109
which corresponds to a frequency of about 725 Hz.
110
The ambiguity can be resolved up to about 1500 Hz
111
if head or source movements are possible [3]. So in the
112
present study, ITD cannot provide localization
infor-113
mation for f = 2000 Hz and may be ambiguous for
114
f = 1000 Hz and f = 1404 Hz.
115
These stimuli were to be matched in loudness to
116
diotic references at a loudness level of 40 phon. The
117
reference level was set by placing the test headphones
118
on a dummy head (Neumann KU 100) whose
micro-119
phones are located at the entrance of the blocked ear
120
canal. Firstly, the sound pressure level was adjusted
121
to 94 dB SPL at 1000 Hz on each ear. Secondly,
start-122
ing from this point, the sound pressure level was
sub-123
sequently adjusted so as to produce 40 phon at the
124
entrance of the ear canal for each of the five
frequen-125
cies under test. The relationship between dB SPL
126
and phon is defined by ISO 226 standard at the
posi-127
tion where the center of the listener’s head would be,
128
but in the absence of the listener [10]. Corresponding
129
sound pressure levels at the entrance of the blocked
130
ear canal were derived using KU 100 HRTF
measure-131
ments that account for the pressure transformation
132
from free field to the entrance of the ear canal [11].
133
Sound pressure levels related to 40 phon at the
cen-134
ter of the head in its absence and at the entrance of
135
the blocked ear canal are indicated in Table 1. The
136
duration of each stimulus was 1.6 s. Its onset and off- 137
set were smoothed by 100-ms-long raised-cosine func- 138
tions. Similar stimuli proved to be well lateralized on 139
the basis of interaural time differences [12]. 140
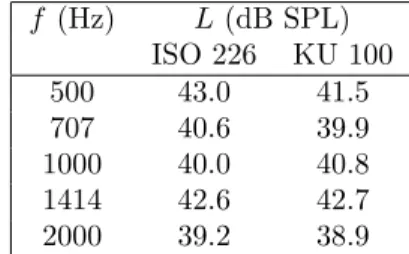
Table 1: Sound pressure levels at the center of the head in its absence according to ISO 226 and at the entrance of the blocked ear canal of the KU 100 dummy head, as a function of the frequency for 40 phon. f (Hz) L (dB SPL) ISO 226 KU 100 500 43.0 41.5 707 40.6 39.9 1000 40.0 40.8 1414 42.6 42.7 2000 39.2 38.9
2.2
Procedure
141Loudness matches were obtained by using a two- 142
interval two-alternative forced choice (2I2AFC) 143
paradigm following a 1-up-1-down rule converging on 144
the point of subjective equality (PSE). This proce- 145
dure is similar to that used in the previous studies 146
that revealed a significant effect of ITD on loudness 147
[4, 5]. In each trial, a test sound (stimulus includ- 148
ing interaural differences) and a reference sound (di- 149
otic stimulus at 40 phon) lasting 1.6 s each were con- 150
secutively presented in random order with a 500-ms 151
pause in between. The subject’s task was to indicate 152
whether the first or the second sound was perceived 153
as louder, regardless of any other perceived difference. 154
The instructions were given both orally and in writ- 155
ten form. The subject responded by clicking a button 156
on a MATLAB graphical user interface. 157
The starting level of each test sound was randomly 158
set 10 dB above or below the level of the reference 159
sound (defined at the entrance of the blocked ear canal 160
in Table 1) to provide a clearly noticeable loudness dif- 161
ference at the beginning of the matching process. The 162
sound pressure level of the test sound was stepwise 163
varied from trial to trial depending on the subject’s 164
response. It was lowered when the subject judged it 165
to be louder, whereas it was increased when the sub- 166
ject judged the reference to be louder. The step size 167
was initially set to 4 dB and was decreased to 1 dB 168
after two reversals (a reversal denotes a change in di- 169
rection in the matching process). For each test sound, 170
the adaptative sequence was ended at the eighth re- 171
versal. The arithmetic mean of the levels at the last 172
six reversals was used to derive the PSE of the test 173
sound with respect to its reference. 174
The 30 adaptive sequences related to the experi- 175
mental conditions (5 frequencies, 6 ITDs) were ran- 176
domly reordered. From the subject’s point of view, 177
paired comparisons of loudness. The subject sat in
179
an audiometric booth and was asked to place the test
180
headphones comfortably over his ears and to not
mod-181
ify this position once the test had started. The test
182
lasted approximately 1 h and was preceded by a 3-min
183
pretest to familiarize the listener with the task and
184
the answering interface. Twenty sound engineering
185
students (Bachelor’s and Master’s degree) from the
186
University of Brest took part in this experiment and
187
were remunerated for their participation. The
sub-188
jects (six women and fourteen men, with ages ranging
189
from 20 to 22 years) had normal hearing thresholds
190
(≤ 10 dB HL) based on an audiogram taken in the
191
month preceding this test. None of them had
partic-192
ular experience in laboratory listening tests.
193
2.3
Results and discussion
194
For each frequency, a repeated-measures analysis of
195
variance was carried out to assess the effect of ITD
196
on loudness matches (results are collected in Table 2).
197
The PSE is presented as the difference between the
198
matched level and the reference level (see Table 1 for
199
corresponding SPL values). The PSE is then expected
200
to be 0 dB when ITD = 0 µs as the test and reference
201
sounds are identical in this case.
202
Table 2: Results of repeated-measures analysis of vari-ance, as a function of the frequency.
f (Hz) F (5, 95) p-value 500 3.041 0.014 707 1.592 0.170 1000 0.656 0.657 1414 1.613 0.164 2000 0.435 0.823
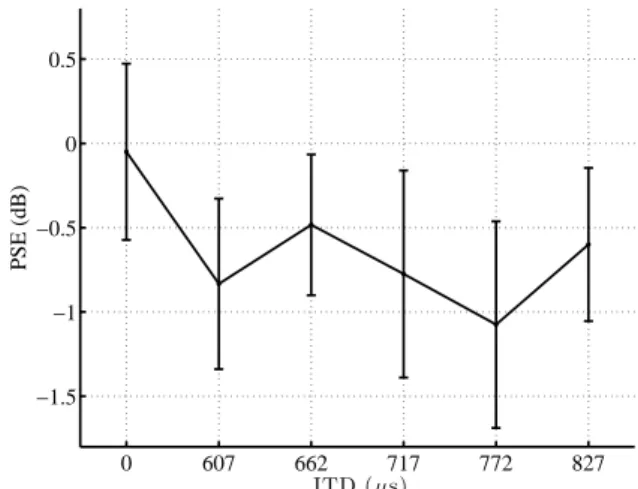
At 500 Hz, ITD had a significant effect on
loud-203
ness (F (5, 95) = 3.041; p = 0.014). As can be noted
204
from Fig. 1, the PSE appears negative when the ITD
205
is different from zero. It can be inferred that related
206
stimuli would have been perceived as louder than their
207
respective reference if presented at the same physical
208
level. The PSE obtained for 772 µs is significantly
dif-209
ferent from the one obtained for a zero ITD (p < 0.001
210
according to a two-tailed Fisher’s LSD test). It
de-211
creases here by around 1 dB which is in agreement
212
with the decrease of 1.25 dB that was observed at
213
200 and 400 Hz for the same ITD in previous
stud-214
ies [4, 5]. The effect is small but still superior to
215
the minimum perceptible change in sound pressure
216
level which is around 0.5 dB for a 500-Hz pure tone
217
at 40 phon [13]. Previous results [4] indicated that
218
the PSE tended to decrease with increasing ITD and
219
that it became significantly lower than the reference
220
(zero ITD) for 669 µs and 772 µs, corresponding
re-221
spectively to θinc = 60◦ and θinc = 90◦ according
222
to Eq. (1). This is partially confirmed here as the
223
PSEs obtained for 607 µs and 717 µs are significantly
224 0 607 662 717 772 827 −1.5 −1 −0.5 0 0.5 ITD (µs) PSE (dB)
Figure 1: Mean PSE as a function of ITD at 500 Hz, with 95% confidence intervals.
different from the one obtained for a zero ITD (with 225
p = 0.007 and p = 0.012 respectively), but this does 226
not hold for 662 µs (p = 0.132). No significant dif- 227
ference was either found between zero and 827 µs 228
(p = 0.057). The latter ITD value is notably higher 229
than the maximum possible value at this frequency 230
according to Eq. (1). It has been shown that when 231
the ITD is higher than a quarter period [14], or close 232
to a half period [15], a diffuse image or even two dis- 233
tinct images may be perceived. At 500 Hz, 827 µs is 234
higher than T /4 and close to T /2. As this could lead 235
to the perception of diffuse or multiple images de- 236
layed in time, other complex mechanisms related to 237
auditory organization processes (auditory scene anal- 238
ysis) might take place prior to loudness computation 239
[16]. 240
As indicated in Table 2, ITD had no significant 241
effect on loudness at any of the four other frequen- 242
cies under study. This was observed for frequen- 243
cies where ITD could respectively provide unambigu- 244
ous (f = 707 Hz), ambiguous (f = 1000 Hz and 245
f = 1404 Hz) or unusable localization information 246
(f = 2000 Hz). As can be noted from Fig. 2, where 247
PSEs are depicted in the same range as in Fig. 1, the 248
differences at these frequencies are much lower than 249
those reported at 500 Hz. The maximum difference 250
that can be observed between a PSE obtained for a 251
non-zero ITD and a PSE obtained for a zero ITD falls 252
between 0.4 and 0.6 dB. It was previously hypothe- 253
sized that ITD could help separate the signal from in- 254
ternal noise at low loudness levels [4, 5]. These results 255
seem to indicate that it would only hold up to 500 Hz 256
as the differences observed beyond this frequency are 257
not significant and not likely to improve the separa- 258
bility. Therefore, the contribution of ITD to direc- 259
tional loudness appears significant only up to 500 Hz 260
and significant loudness variations that would be ob- 261
served at higher frequencies would rather be caused 262
by at-ear pressure modifications, which significantly 263
Koehlet al., p. 4 0 607 662 717 772 827 −1.5 −1 −0.5 0 0.5 ITD (µs)
Means and Confidence Intervals for Each Group
2000 Hz PSE (dB) −1.5 −1 −0.5 0 0.5
Means and Confidence Intervals for Each Group
1404 Hz −1.5 −1 −0.5 0 0.5
Means and Confidence Intervals for Each Group
1000 Hz −1.5 −1 −0.5 0 0.5 off 707 Hz
Figure 2: Mean PSE as a function of ITD at 707 Hz, 1000 Hz, 1404 Hz and 2000 Hz, with 95% confidence intervals.
loudness sensitivity at higher frequencies is
underesti-265
mated by model predictions [6] may not be explained
266
by an effect of time differences on binaural loudness
267
summation (as hypothesized in section 1) but more
268
probably by a different binaural interaction (i.e.
con-269
tralateral inhibition) for stimuli exhibiting different
270
levels at the two ears. As a result, it should be
em-271
phasized that ITD has no significant effect on
loud-272
ness for frequencies above 500 Hz even if it may
pro-273
vide useful information about the source localization
274
(e.g. at 707 Hz). This finding goes in line with the
275
results establishing that the effect of ITD remained
276
the same when the lateralization was compensated by
277
an opposite ILD [5] and support the assumption that
278
the effect of ITD on loudness is not related to the
279
localization process.
280
3
Conclusion
281
The results of the present study confirm the effect
282
of ITD on pure-tone loudness previously observed at
283
200 and 400 Hz, at a low loudness level. This effect
284
proved to be significant at 500 Hz but not at higher
285
frequencies. At 40 phon, ITD may thus contribute
286
to the phenomenon of directional loudness only up to
287
this frequency and loudness variations with the source
288
azimuth that might be observed above would then
289
be due to modifications of at-ear pressures.
More-290
over, the fact that ITD has no effect on loudness at
291
707 Hz, where it is still an unambiguous localization
292
cue, confirms that the effect on loudness is caused by
293
the ITD itself rather than by the related localization.
294
These statements both indicate that directional
loud-295
ness is not likely to be caused by the direction itself
296
but rather by the modifications (pressure and time)
297
that affect a stimulus coming from a given direction.
298
Acknowledgement
299The authors wish to thank the staff and students from 300
the “Image & Son” department from the University 301
of Brest for participating in this experiment. 302
References
303[1] D. W. Robinson, L. S. Whittle: The loudness of 304
directional sound fields. Acta Acust united Ac 10 305
(1960) 74–80. 306
[2] V. P. Sivonen, W. Ellermeier: Directional loud- 307
ness in an anechoic sound field, head-related trans- 308
fer functions, and binaural summation. J Acoust 309
Soc Am 119 (2006) 2965–2980. 310
[3] B. C. J. Moore: Space perception. – In: An intro- 311
duction to the psychology of hearing. Sixth edi- 312
tion. Brill, Leiden, The Netherlands, 2012, 245- 313
250. 314
[4] V. Koehl, M. Paquier: Loudness of low-frequency 315
pure tones lateralized by interaural time differ- 316
ences. J Acoust Soc Am 137 (2015) 1040–1043. 317
[5] V. Koehl, M. Paquier, E. Hendrickx: Effects 318
of interaural differences on the loudness of low- 319
frequency pure tones. Acta Acust united Ac 101 320
(2016) 1168–1173. 321
[6] B. C. J. Moore, B. R. Glasberg: Modeling binaural 322
loudness. J Acoust Soc Am 121 (2007) 1604–1612. 323
[7] G. F. Kuhn: Model for the interaural time differ- 324
ences in the azimuthal plane. J Acoust Soc Am 62 325
(1977) 157–167. 326
[8] R. S. Woodworth: Hearing. – In: Experimental 327
psychology. Holt, New York City, NY, USA (1938) 328
501–539. 329
[9] N. L. Aaronson, W. M. Hartmann: Testing, cor- 330
recting, and extending the Woodworth model for 331
interaural time difference. J Acoust Soc Am 135 332
(2014) 817–823. 333
[10] ISO 226: Acoustics – Normal equal-loudness- 334
level contours. International Organization for 335
Standardization, Geneva, Switzerland, 2003. 336
[11] B. Bernsch¨utz: A spherical far field HRIR/HRTF 337
compilation of the Neumann KU 100. Proceedings 338
of AIA-DAGA joint Conference, Merano, Italy, 339
2013, 592–59. 340
[12] P. X. Zhang, W. M. Hartmann: Lateralization of 341
sine tones–interaural time vs phase. J Acoust Soc 342
Am 120 (2006) 3471–3474. 343
[13] H. Fletcher: Minimum perceptible changes in fre- 344
quency and sound pressure level. – In: Speech and 345
hearing in communication. Second edition. Van 346
[14] W. A. Yost: Lateral position of sinusoids
pre-348
sented with interaural intensive and temporal
dif-349
ferences. J Acoust Soc Am 70 (1981) 397–409.
350
[15] B. M. Sayers: Acoustic-image lateralization
judg-351
ments with binaural tones. J Acoust Soc Am 36
352
(1964) 923–926.
353
[16] S. McAdams, M. C. Botte, C. Drake: Auditory
354
continuity and loudness computation. J Acoust
355
Soc Am 103 (1998) 1580–1591.