HAL Id: hal-02397186
https://hal-mines-albi.archives-ouvertes.fr/hal-02397186
Submitted on 4 Feb 2020
HAL is a multi-disciplinary open access
archive for the deposit and dissemination of
sci-entific research documents, whether they are
pub-lished or not. The documents may come from
teaching and research institutions in France or
abroad, or from public or private research centers.
L’archive ouverte pluridisciplinaire HAL, est
destinée au dépôt et à la diffusion de documents
scientifiques de niveau recherche, publiés ou non,
émanant des établissements d’enseignement et de
recherche français ou étrangers, des laboratoires
publics ou privés.
Hydrogen spillover in the Fischer-Tropsch synthesis on
carbon-supported cobalt catalysts
Amel Ghogia, Simon Cayez, Bruno Machado, Ange Nzihou, Philippe Serp,
Aikaterini Soulantika, Doan Pham Minh
To cite this version:
Amel Ghogia, Simon Cayez, Bruno Machado, Ange Nzihou, Philippe Serp, et al.. Hydrogen spillover
in the Fischer-Tropsch synthesis on carbon-supported cobalt catalysts. ChemCatChem, Wiley, 2020,
12, pp.1117-1128. �10.1002/cctc.201901934�. �hal-02397186�
Hydrogen Spillover in the Fischer-Tropsch Synthesis on
Carbon-supported Cobalt Catalysts
Amel C. Ghogia,
[a, b, c]Simon Cayez,
[b]Bruno F. Machado,
[d]Ange Nzihou,
[a]Philippe Serp,*
[c]Katerina Soulantica,*
[b]and Doan Pham Minh*
[a]The Fischer-Tropsch reaction transforms syngas into high added value products, among which liquid fuels. Numerous parame-ters determine catalytic activity and selectivity towards the most desired hydrocarbons. The performances of cobalt-based catalysts used in the reaction are known to depend critically on Co particle size and crystallographic phase. Here, we present a comparative study of Co-based catalysts supported on three carbon supports: multi-wall carbon nanotubes, carbon nano-fibers and a fibrous material. Our results show that, while the
selectivity towards C5 + follows the expected tendency with respect to Co particle size, this is not the case for the TOF. These results can be rationalized considering that the amount of H2uptake on each catalyst increases with oxygen and defect
concentration on the support. The catalyst on the support presenting many edges and oxygen surface groups, necessary for H2spillover, presents the highest activity. Furthermore, the
hydrogen spillover contributes to the enhancement of olefin hydrogenation and methane production.
Introduction
Global energy consumption is increasing continuously.[1]
In this context, the fluctuation of the availability and prices of fossil fuels, the geopolitical concerns and global warming impose the development of alternative fuel production processes. Fischer-Tropsch synthesis (FTS) allows converting syngas into liquid fuel. FTS produces a mixture of short- and long-chain chemicals, and catalytic processes that produce low methane, low oxygen-ates, and high C5 + selectivity are actively pursued.[2]
Among the catalytically active metals, cobalt is the best compromise in low-temperature FTS in terms of price, activity, stability, and selectivity to long-chain hydrocarbons.[3]
In Co-based catalysts, the support material plays an important role, providing mechanical integrity and stabilizing the dispersed Co crystallites.[4]
The catalytically active Co0
phase is generally
supported on oxides such as SiO2, Al2O3, TiO2 or ZrO2.[5]
However, cobalt oxide species formed on such supports during catalyst preparation are hard to reduce into Co0
, due to strong metal-support interactions.[6]
The use of carbon materials is appealing since they offer the advantage of: i) having a high surface area, ii) being stable at high temperature, and iii) not interacting too strongly with Co, which significantly enhances catalytic activity.[7]
Co particle size and crystallographic structure are also key factors of Co-based catalyst performance in FTS. Bezemer et al. investigated the influence of cobalt particle size on catalytic performance and found no effect on Co particle size above 8 nm.[8]
However, both activity and selectivity were strongly affected for smaller particles size, and this tendency was discussed in several studies.[9]
Concerning the crystal structure of Co particles, recent DFT studies have shown that the Co-hcp phase is more active and selective to C5 + than the Co-fcc one,[10]
and this has been experimentally confirmed.[11]
In fact, the four types of exposed facets of Co-hcp allow a higher CO dissociation rate than Co-fcc.[10]
In addition, for CO activation in the presence of hydrogen, Co-hcp catalysts favor the direct dissociation route, while Co-fcc catalysts favor the H-assisted pathway.[10]In addition to the influence of Co particle size and
crystalline structure, many complex phenomena occurring on the catalyst surface affect the catalytic performance, one of them being the migration of H atoms from metallic particles to the support. This phenomenon, called hydrogen spillover,[12]has
been widely discussed in the literature for catalysts supported on oxides[13] or carbon materials.[14] In FTS, hydrogen spillover
has been only invoked to explain the role of noble metals (Pt, Ru, Au) as promoters for Co reduction in Co/Al2O3[15] or Co/C
catalysts.[16]During FTS on Co/Al
2O3catalysts, spillover results in
more CH4and higher TOF due to the cleansing effect of atomic
H.[15b]Many factors can promote hydrogen spillover on catalyst
surface. The capacity of a carbon support to reversibly store atomic H relies on a number of factors such as accessible surface area, geometric nanostructure, defects, dopants, surface [a] A. C. Ghogia, Prof. Dr. A. Nzihou, Dr. D. Pham Minh
Université de Toulouse, IMT Mines Albi, UMR CNRS 5302 Centre RAPSODEE
Campus Jarlard, 81013 Albi, cedex 09 (France) E-mail: doan.phamminh@mines-albi.fr [b] A. C. Ghogia, S. Cayez, Dr. K. Soulantica
LPCNO, Université de Toulouse, CNRS, INSA, UPS 135 avenue de Rangueil, 31077 Toulouse (France) E-mail: ksoulant@insa-toulouse.fr
[c] A. C. Ghogia, Prof. Dr. P. Serp LCC, CNRS-UPR 8241, ENSIACET Université de Toulouse (France)
E-mail: philippe.serp@ensiacet.fr [d] Dr. B. F. Machado
Laboratory of Separation and Reaction Engineering – Laboratory of Catalysis and Materials (LSRE-LCM)
Chemical Engineering Department, Faculty of Engineering University of Porto
1 2 3 4 5 6 7 8 9 10 11 12 13 14 15 16 17 18 19 20 21 22 23 24 25 26 27 28 29 30 31 32 33 34 35 36 37 38 39 40 41 42 43 44 45 46 47 48 49 50 51 52 53 54 55 56
chemistry, surface coverage and the interaction of metal nanoparticles and support.[17]
A high surface area, and a carbon surface functionalization (generally through the introduction of surface oxygen groups or defects) is required to increase spillover. To date, there are no studies showing the direct involvement of hydrogen spillover on FTS activity and selectiv-ity on unpromoted carbon-supported cobalt catalysts.
In the present work, three different carbon supports, presenting various concentration of surface oxygen groups and defects, were used to prepare 15 % wt Co/C catalysts. Hydrogen spillover and its influence on both activity and selectivity of carbon-supported cobalt catalysts in FTS have been inves-tigated.
Results and Discussion
Support characterization
Cobalt was supported on three carbon materials presenting different structures: carbon nanotubes (CNT), a fibrous material (FM), and carbon nanofibers (CNF). Support functionalization was performed by a HNO3 treatment to create surface
oxy-genated groups. These groups play the role of anchoring sites for Co particles and can also modify the catalyst acidity, polarity, hydrophobicity, and reactivity.[14,18]
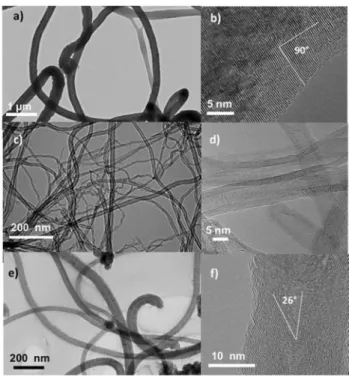
Figure 1 shows TEM images of the supports. The external diameter distribution of FM is between 150 and 500 nm with a mean diameter around 300 nm. CNT are composed of 5–10 graphene layers,[19]
and show a mean external and internal diameter of 15 and 7 nm, respectively. The mean external and internal diameter of CNF is 40 and 6 nm, respectively. These materials exhibit different arrangements of the graphene layers.[20]
The difference between them comes from the fact that the graphene layers are parallel to the filament axis in CNT, but not in FM and CNF.[19]
It has been reported by Contreras et al. that FM and CNF supports are mainly composed of edges with different average angles with respect to the long filament axis.[20]
It was also proposed that the chemical reactivity of these edges depends on the value of the angle: higher angles providing higher chemical reactivity.[20–21] Herein, the average angle was 90° for FM and
26° for CNF, as shown in Figure 1b,f. The textural properties,
thermal stability, surface composition, and structure of the supports obtained after nitric acid treatment, were evaluated respectively by N2 adsorption, TGA/DTG analysis, XPS, and
Raman spectroscopy (Table 1). The mean pore volume and specific surface area of the supports are in the range of 0.3–
1.2 cm3
g 1
, and 71–220 m2
g 1
, respectively, which corresponds to mesoporous materials.[22]
Acid treatment increased the specific surface area, pore volume, and removed the accessible catalyst residues.[23]
Another difference between CNT/CNF and FM consists in the lack of a hollow cavity in the latter.[24]
The results of TGA/DTG analyses provide the decomposition tem-perature of each carbon support and the amount of catalyst residue after the HNO3 treatment. The FM support presents a
higher decomposition temperature (680°C) under air flow,
compared to the other two supports. This reflects mainly the highest purity of this material, since it is known that remaining catalyst can catalyze carbon decomposition.[20]
Raman spectroscopy provides a wealth of information about the carbon material structure.[23b,24–25] The D-band at ca.
1360 cm 1
is related to graphene defects (sp3
carbon) caused by pentagons or heptagons, whereas the G-band at ca. 1580 cm 1
is associated to stretching vibrations of sp2 carbon atoms of
graphitic layers. For the three investigated supports, the ID/IG
ratio decreased as follows: CNT (1.54) ~ FM (1.48) > CNF (1.31) (see spectra on Figure S1 in Supporting Information). The high
Figure 1. TEM images of the HNO3treated supports. FM (a) low resolution
TEM, (b) HRTEM; CNT (c) low resolution TEM, (d) HRTEM; and CNF (e) low resolution TEM, (f) HRTEM.
Table 1. Chemical composition and textural properties of the functionalized carbon support.
Support XPS analysis Textural properties TGA/DTG TGA residue Raman
C O O/C[a] BET V
p D (ID/IG)[b]
[at.%] [at.%] [m2.g1] [cm3.g1] [nm] [°C] [%]
FM 81.8 18.2 0.22 173 0.4 8.9 680 0.0 1.48
CNT 87.9 12.1 0.13 220 1.2 22.2 562 5.6 1.54
CNF 91.8 8.1 0.08 71 0.3 17.1 520 3.8 1.31
1 2 3 4 5 6 7 8 9 10 11 12 13 14 15 16 17 18 19 20 21 22 23 24 25 26 27 28 29 30 31 32 33 34 35 36 37 38 39 40 41 42 43 44 45 46 47 48 49 50 51 52 53 54 55 56 57
value of ID/IG for CNT can be explained by the fact that the
treatment with HNO3 acid led to the opening or damage of
tubes walls. The FM support is mainly composed of 90°edges, which are very reactive during the functionalization step, resulting in a high level of defects. In contrast, the disorder is less present for the CNF support (ID/IG=1.31). This could be
related to lower reactivity of the 26°edges, which leads to the creation of lower amounts of oxygen functional groups during the HNO3 treatment. Additionally, a lower HNO3
functionaliza-tion temperature was used for the CNF support (80 instead of 140°C for CNT and FM). Contreras-Navarrete et al. have shown that the oxygen atomic percentage increases with increasing HNO3treatment temperature, and this is generally associated to
an increase of the disorder.[26]
The typical oxygen-containing surface groups created by nitric acid oxidation are carboxylic, phenolic, and ketonic.[18]
From XPS analysis, the O/C ratio for the functionalized carbon materials followed the order FM (0.22) > CNT (0.13) > CNF (0.08). The highest value of O/C ratio, obtained with the FM support, can be attributed to the presence of reactive edges. CNT has a higher O/C ratio than CNF, which could be related to the higher HNO3 treatment
temperature used for CNT.
Catalyst characterization
Each support was used to prepare a 15 %Co catalyst from cobalt acetate by incipient wetness impregnation. ICP analyses (Table 2) showed cobalt loadings of 14.9, 15.0, and 14.5 wt% for 15 %Co/FM, 15 %Co/CNT and 15 %Co/CNF, respectively. The characterization carried out aimed at obtaining information on the freshly reduced catalysts (350°C), before introduction of the
syngas for the FTS. First, we focused on the size of the cobalt particles, their composition (Co0
/Con +
) and their crystallographic phase (hcp/fcc). Then, we assessed the H2 spillover on these
different catalysts.
Cobalt particle size, crystallographic phase and composition
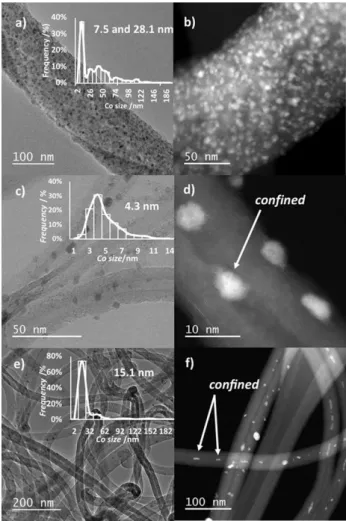
Figure 2 shows TEM and STEM-HAADF images of the reduced catalysts. The mean Co particle size was 7.5 and 28.1 nm (bimodal distribution) for 15 %Co/FM (Figure 2a), 4.3 nm for 15 %Co/CNT (Figure 2c), and 15.1 nm for 15 %Co/CNF (Fig-ure 2e). The bimodal distribution observed for the 15 %Co/FM
catalyst could be due to the high oxygen content of this support. Chen et al. showed, for silver on carbon, that increasing the amount of oxygen groups resulted in a bimodal distribution of Ag NP with sizes of 4 to 6 nm and greater than 22 nm.[27]
The high Co loading may have also contributed to this bimodal distribution.[24]
The 15 %Co/CNT catalyst exhibited a narrow Co particle size distribution centered at 4.3 nm. This could be explained by the high specific surface area of CNT. In addition, a significant amount of Co particles are confined in the inner cavity of the tubes (Figure 2d), which has already been observed for FTS with Co/CNT catalysts.[28]
The 15 %Co/
Table 2. Surface composition and Co species, H2uptake, textural, reduction degree, Cohcp/Cofccratio, and average Co particle size, of the cobalt catalysts.
Catalyst Co[a] XPS analysis Reduction degree Co
hcp/Cofcc[d] H2-chemisorption Co particle size
Co3 +/(Co2 + ,3 +) Co/C C O In-situ XRD[b] VSM[c] – H 2-uptake
(350–650°C)
dH2 dTEM dXRD
[%] – – [at.%] [at.%] [%] [%] – [μmol g1] [nm]
15 %Co/FM 14.9 1 0.02 83.9 14.4 75 78 2.04 348 3.3 7.5–28.1 27
15 %Co/CNT 15 1 0.03 88.9 8.3 88 81 2.14 309 4 4.3 5
15 %Co/CNF 14.5 0.92 0.01 90.7 7.6 95 90 2.27 276 4.2 15.1 27
[a] From ICP. [b] Reduction degree based on the in-situ XRD. [c] reduction degree based on the magnetic measurements at 27°C. [d] Cohcp/Cofccafter test
obtained by refinement of XRD diffractogram.
Figure 2. TEM and STEM-HAADF images of fresh catalysts: a) and b) 15 %Co/
1 2 3 4 5 6 7 8 9 10 11 12 13 14 15 16 17 18 19 20 21 22 23 24 25 26 27 28 29 30 31 32 33 34 35 36 37 38 39 40 41 42 43 44 45 46 47 48 49 50 51 52 53 54 55 56 57
CNF catalyst contains relatively large Co particles, which could be due to both low amount of surface oxygen groups and low specific surface area of this support.[29]
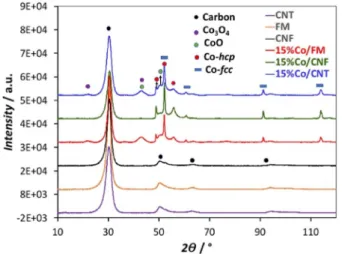
Some of these particles are confined in the inner cavity of CNF (Figure 2f). Figure 3 shows the X-ray diffraction patterns of the supports and the catalysts after reduction at 350°C for 2 hours and exposure to the air. Two peaks are observed at 30 and 51°that correspond to the graphite layers of the carbon structure.[30]
For the catalysts, peaks corresponding to Co-hcp, Co-fcc, CoO and Co3O4 were present. The calculation of the average size of
crystallites from the Scherrer equation and using the peak at 42° for 15 %Co/CNT, which corresponds to Co3O4 phase, was
carried out using the relation d(Co0
) = 0.75 × d(Co3O4).[31] This
yielded a value of 5 nm, similar to the one measured by TEM (Table 2). The absence of the characteristic peaks of Co3O4and
CoO phases (2θ = 23° and 42°) on the 15 %Co/CNF pattern could be attributed to the presence of larger Co particles that are more resistant to oxidation. The average crystal size of 15 % Co/FM and 15 %Co/CNF catalysts was estimated using the peak at 2θ = 52°, according to the work of Diaz et al.[32]
For both catalysts a similar average crystal size of 27 nm was obtained, larger than the value measured by TEM, due to the important contribution of large particles on the peak width value.[33]
Figure 4a shows the TPR profiles of the calcined under inert atmosphere catalysts.The low intensity first peak observed at 200–210°C could be assigned to the reduction of incompletely
decomposed cobalt precursor after calcination under inert atmosphere.[34]
Three additional peaks are observed. The peak at 380°C observed for 15 %Co/FM and 15 %Co/CNT is associated
to the reduction of Co3O4to CoO.[35]This peak is shifted towards
lower temperatures (360°C) for 15 %Co/CNF. The reduction of
CoO to Co0
occurs at � 530°C for 15 %Co/CNT and 15 %Co/FM
catalysts. For the 15 %Co/CNF catalyst, this peak is also shifted to lower temperatures (420°C). This indicates a weaker
inter-action between the Co particles and the CNF support, which favors reduction.[36]
The TPR profile of 15 %Co/FM was broader than that of 15 %Co/CNT. This behavior is due to the strong interaction of Co particles with the FM support, and to the
confinement effect in the CNT, which makes Co particles easier to reduce.[37]
From these results the degree of reducibility follows the order 15 %Co/CNF > 15 %Co/CNT > 15 %Co/FM. Pre-vious studies have shown that the last peak at � 600°C
corresponds to the gasification of carbon support leading to methane formation.[38]Carbon gasification takes place at 650°C
for the 15 %Co/CNT and the 15 %Co/FM catalysts, and at 580°C
for 15 %Co/CNF. Thus, CNT and FM supports are more resistant to the gasification than CNF. These results matched well to those obtained by TGA/DTG analyses (Table 1). The reduction degree of the reduced catalysts (not exposed to the air) was also determined by magnetic measurements. The sample magnetization versus intensity of the applied magnetic field was recorded at 27°C (Figure 4b, Table 2).[39]The magnetization
at saturation (Ms) of 15 %Co/FM, 15 %Co/CNT and 15 %Co/CNF
catalysts is 125, 135, and 148 emu gCo 1, respectively. Based on
these values, and using the magnetization of bulk Co (Ms=
160 emu gCo 1), the degree of reduction was evaluated, yielding
78 % for 15 %Co/FM, 81 % for 15 %Co/CNT and 90 % for 15 %Co/ CNF. The 15 %Co/CNF catalyst, with large Co particles, has the highest Msand degree of reduction. Although these results are
influenced by the presence of catalyst residues in CNT and CNF,
Figure 3. XRD diffraction patterns for the functionalized supports and
reduced catalysts after exposure to the air.
Figure 4. TPR profiles (conditions: 100 mg of sample, H2/N2flow rate of
25 mL min 1, temperature ramp of 5°C min 1); and b) magnetization versus
1 2 3 4 5 6 7 8 9 10 11 12 13 14 15 16 17 18 19 20 21 22 23 24 25 26 27 28 29 30 31 32 33 34 35 36 37 38 39 40 41 42 43 44 45 46 47 48 49 50 51 52 53 54 55 56 57
they corroborate the order of catalyst reduction obtained by TPR.
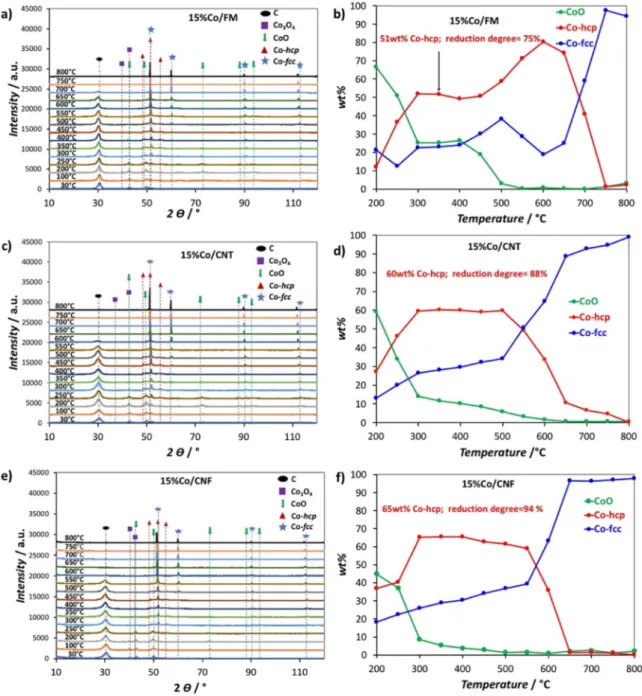
The Co phase transition during reduction was monitored by in-situ XRD on the catalyst calcined under Ar (Figure 5). At 30°C, all catalysts show the presence of the CoO and Co3O4 phases.
The presence of CoO could be attributed to the auto-reduction of Co3O4assisted by CO evolved from the decomposition of the
support functional groups.[40]
Co3O4 is completely reduced to
CoO at 200°C. Then, CoO reduction progressively takes place from 200 to 600°C to form Co-hcp and Co-fcc. The carbon peak at 2θ = 30° disappears at 600–750°C due to carbon hydrogasification.[38a]
Figure 5b, d, f show the quantitative evolution of the crystalline phases as a function of temperature.
The reduction degree and the Cohcp/Cofcc ratio (Figure 6) were
determined at 350°C, which corresponds to the in-situ reduc-tion temperature before the FTS tests. The degree of reducreduc-tion is 75 %, 88 % and 95 % for 15 % Co/FM, 15 %Co/CNT and 15 % Co/CNF respectively. These values are in good agreement with those obtained by the magnetic measurements. The Cohcp/Cofcc
ratio is 2.04 for 15 %Co/FM, 2.14 for 15 %Co/CNT, and 2.27 for 15 %Co/CNF.
The 15 %Co/CNF catalyst shows the highest Cohcp/Cofccratio
and reduction degree. This is explained by the fact that the reducibility and the crystalline phase depend on two parame-ters: i) the weak metal-support interaction, which contributes to
Figure 5. XRD patterns and evolution of crystalline Co species during the in-situ reduction under 5 % H2/N2flow from 30°C to 800°C of all catalysts
1 2 3 4 5 6 7 8 9 10 11 12 13 14 15 16 17 18 19 20 21 22 23 24 25 26 27 28 29 30 31 32 33 34 35 36 37 38 39 40 41 42 43 44 45 46 47 48 49 50 51 52 53 54 55 56 57
an increase of the reduction degree;[36]
and ii) the surface topology, which controls the exposed Co particles facets.[41]
Finally, we also performed XPS analyses to probe a possible charge transfer between the support and Co in the calcined catalysts. The XPS results, presented in Figure S2, and Table 2 and 3, were obtained by deconvolution of the XPS spectra of Co 2p, O 1s, and C 1s. The Co surface species are oxides (Co3 +
and Co2 +
). The Co 2p3/2 peaks are at 779.7-781.3 eV, and the
peaks at 794.7–796.5 eV are attributed to Co 2p1/2spin-orbital
peaks.[42]
These binding energies are close to those found for Co/C catalysts and attributed to Co3O4, whose Co 2p spin orbital
splitting value is 15.0 � 0.1 eV.[42]
The energy separation between Co 2p1/2and Co 2p3/2was around 15 eV for all samples.
Based on these results, it appears that there is no significant difference from one catalyst to another in terms of charge transfer. The Co3O4/CoO ratio was almost 1 for all catalysts. The
surface concentration of atomic Co, described by the Co/C ratio, follows the order: 15 %Co/CNT > 15 %Co/FM > 15 %Co/CNF in accordance with the Co particle size. The oxygen content was 14.4 at.% on 15 %Co/FM, 8.3 at.% on 15 %Co/CNT and 7.6 at.% on 15 %Co/CNF. The amount of surface oxygen decreases upon metal deposition on the support. This decrease is due to the
significant loss of oxygen groups during catalyst preparation and calcination under Ar.[43]
The high-resolution O 1s and C 1s spectra give information on the nature of oxygen groups present after calcination (Figure S3 and Table 4). The 15 %Co/ FM, which presents the highest oxygen content, shows a high surface density of carbonyl/quinone groups (peak I in Fig-ure S3a; peak II in FigFig-ure S3d yellow line; Table 4).
Assessment of hydrogen spillover
In order to assess the hydrogen spillover, TPD-MS analyses of the supports (Figure S4) and catalysts (Figure 7) were per-formed. No peak related to H2desorption was observed for the Figure 6. Degree of reduction and Cohcp/Cofccratio at 350°C for all catalysts
obtained by Rietveld refinement of XRD diagram (in-situ XRD).
Table 3. Binding energy of Co 2p of the calcined catalysts.
Binding energy [eV]
Catalysts 2p3/2 2p1/2
Co3 + Co2 + Co3 + Co2 +
15 %Co/FM 779.9 781.3 794.8 796.6
15 %Co/CNT 779.7 781.3 794.7 796.5
15 %Co/CNF 779.7 781.1 794.7 796.5
Table 4. XPS data for high-resolution O 1s of catalysts.[45]
Catalysts O 1s carbonyl/ quinone
Esters/ethers adsorbed water/ oxygen peak I [eV] % peak II [eV] % peak III [eV] %
15 %Co/FM 531.1 37.6 532.0 33.7 533.2 29.2
15 %Co/CNT 529.5 17.4 531.2 36.0 532.6 46.4
15 %Co/CNF 529.6 15.3 531.1 37.0 532.6 47.6
Figure 7. H2-TPD-MS of all catalysts (50–1050°C): a) CO2b) CO and c) H2
1 2 3 4 5 6 7 8 9 10 11 12 13 14 15 16 17 18 19 20 21 22 23 24 25 26 27 28 29 30 31 32 33 34 35 36 37 38 39 40 41 42 43 44 45 46 47 48 49 50 51 52 53 54 55 56 57
three supports. The HNO3 treatment created carboxylic,
anhy-drides, carbonyl, phenolic, quinone and lactone groups on the carbon materials.[18]
These groups can be analyzed from the CO2
and CO released during the TPD-MS experiments. Carboxylic acids release CO2at low temperatures (100–450°C). Anhydrides
decompose into CO and CO2 at intermediate temperatures
(350–600°C). Lactones release CO2 at higher temperatures
(550–800°C).Phenols release CO at intermediate temperatures (500–750°C) and carbonyl/quinones decompose by releasing CO at high temperatures (650–950°C).[44]
The nature of oxygen groups as a function of desorption temperature from the supports and catalysts are shown in Figures S4 and 7, and the amounts of CO and CO2 released are shown in Table 5. The
peak relative to the desorption of carboxylic groups normally observed at 300°C for the supports is absent due to the reduction under H2/N2flow at 350°C. As expected from the XPS
results, the total amount of oxygen surface groups follows the order FM > CNT > CNF. For the catalysts, the CO2and CO profiles
differ significantly from the ones of the supports (Figures 7a, b and Table 5). For the CO2profile, two main peaks are present at
370–390°C and 510°C.The first peak is assigned to a Co-surface
acetato ligand interface that is formed during catalyst preparation,[46]
and the second one is assigned to lactone groups. The CO profile indicates the decomposition of phenol (530°C) and carbonyl/quinone groups (660°C). Figure 7c shows the H2 desorption profiles of all the catalysts between 50 and
1000°C, in which two main peaks are observed. The peak
between 350 and 650°C is due to H2 release from the Co
particles. However, if we consider these values for the calculation of the metal particle size (15 %Co/FM = 3.3 nm; 15 % Co/CNT = 4 nm; 15 %Co/FM = 4.2 nm), it is evident that they are too high.
This should be due to the so-called reverse H-spillover effect, that is, the migration of H atoms from the support onto the metal phase where they recombine and desorb. Such a phenomenon was already observed for Ni/C catalysts.[47]
The second peak (absent in the case of the original support) starting at 700°C is due to the decomposition (without the help of the
supported metal) of stable C H functionalities, which have been created by H-spillover from the metallic particles.[48]
From these analyses, it is clear that the H-spillover is significantly more pronouced on the FM support than on CNT and CNF. This result can be rationalized by considering the fact that on carbon-supported catalysts, the hydrogen spillover is enhanced
on carbon supports presenting high amount of surface oxygen groups and defects.[14,17b, 38b, 49]
Guerrero-Ruiz et al. have proposed that carboxylic and/or lactonic groups should be involved in spillover, whereas phenyls and carbonyls seem to be less efficient for the migration of deuterium.[50]
Wang et al. have studied the enhanced hydrogen spillover on carbon surfaces modified by oxygen plasma.[17b]
They found that the oxygen groups, especially semiquinone groups, increased the reversible hydrogen storage capacity significantly. They con-cluded that for hydrogen spillover, oxygen groups, particularly semiquinone groups, are ideal receptors.[17b]
As far as defects are concerned, inelastic neutron scattering studies have evidenced the occurrence of atomic H-spillover from Pt or Pd surfaces to unsaturated reactive sites on the carbon support, and in particular to those located at the irregular borders (edges),[51]
with the formation of C H bonds.[52]
These sites can be completely saturated during the hydrogenation process. If we consider that FM is the support that presents the highest amount of surface oxygen groups and a high concentration in reactive edges, the fact that H-spillover is more pronounced on this support is not surprising. Figure S5 shows that a very good correlation exists between the amount of H2desorbed by the
catalyst in the 350–650°C temperature range and the
concen-tration of surface oxygen groups (from TPD) and defects on the support (from Raman). This latter result confirms that the surface chemistry of the carbon support plays a pivotal role on the promotion of hydrogen spillover.
Catalytic performances in FTS
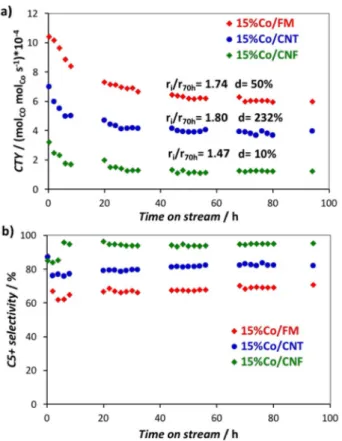
All FTS tests were repeated twice and the reproducibility of the results was confirmed. Figure 8a shows the evolution of the cobalt-time-yield (CTY, molCOmolCo 1s 1) as a function of
time-on-stream (TOS) for the three catalysts during FTS. The average deactivation parameter (ri/r70h, ratio of the initial rate to the
stabilized rate after 70 h of TOS), as well as the average sintering parameter of Co particles (d calculated based on mean particles size obtained by TEM of the fresh and spent catalysts) are also presented on this figure. The catalytic performances obtained in this work are similar to those reported by de Jong et al. for Co/CNF catalysts prepared from cobalt acetate (CTY = 4.7–8.6 x 10⁻⁴mol
COmolCo 1s 1).[53] The values of CTY (Table 6)
are stabilized at 6.9, 3.9 and 1.2 x 10⁻⁴mol
COmolCo 1s 1for 15 %
Co/FM, 15 %Co/CNT and 15 %Co/CNF catalysts, respectively (Table 6). The higher CTY of 15 %Co/FM could be attributed to its small average Co particle size (11 nm for the spent catalyst, Table 6), as previously reported in FTS.[54] The 15 %Co/CNT
catalyst has the highest average deactivation parameter, followed by 15 %Co/FM and 15 %Co/CNF. This could be assigned to the absence of graphene edges from the surface of CNT, which should contribute to the stabilization of Co particles.
The deactivation is more important for 15 %Co/FM than for 15 %Co/CNF. Both FM and CNF supports have edges that stabilize Co particle. This suggests that the origin of the deactivation observed for the Co/FM catalyst is related to the
Table 5. Parameters obtained by deconvolution of the TPD-MS spectra of
the supports (50–1000°C) and calcined catalysts (50–1000°C).
Samples CO CO2 CO/CO2 H2[a] H2total[b]
[μmol g 1] [μmol g1] [μmol g 1] [μmol g1]
CNT 2149 299 7.2 – – 15 %Co/CNT 2086 299 7 309 754 CNF 613 82 7.5 – – 15 %Co/CNF 842 77 10.9 276 1133 FM 2185 555 3.9 – – 15 %Co/FM 5871 379 15.5 348 1800
[a] H2and [b] H2total are obtained by integration of the peak surface
1 2 3 4 5 6 7 8 9 10 11 12 13 14 15 16 17 18 19 20 21 22 23 24 25 26 27 28 29 30 31 32 33 34 35 36 37 38 39 40 41 42 43 44 45 46 47 48 49 50 51 52 53 54 55 56 57
sintering of the smallest particles (~ 7 nm), which are less stable than the larger ones on Co/CNF (15.1 nm).
The evolution of the C5 + selectivity, CH4 selectivity and
olefins/paraffins ratio as a function of TOS are shown in Figure 8b, S6a and S6b, respectively. The 15 %Co/CNF catalyst, with the largest average Co particle size (17 nm for the spent catalyst) presents the highest C5 + selectivity, lowest methane selectivity and highest olefins/paraffins ratio. It is known that in FTS, large Co particles favor C5 + selectivity, while small ones favor methane formation.[55]
Thus, the 15 %Co/FM catalyst with the smaller average Co particle size led to higher CH4selectivity
(Figure S6a). In addition, this high CH4selectivity could also be
attributed to the presence of unreduced cobalt oxides (around
25 %) catalyzing the WGS reaction, thus increasing the effective H2/CO ratio at the 15 %Co/FM surface.[56] The 15 %Co/CNT
catalyst is slightly more selective to C5 + than Co/FM. This could be related to the average Co particle size (14 nm for the spent catalyst) and to the confinement of the Co particles in CNT, which favors the growth of longer chain hydrocarbons.[57]
The C5 + distribution and calculated Anderson Schulz Flory (ASF) plots are shown in Figure S7. In all cases, the weight percent of hydrocarbon decreased when molecular weights increase (Figure S7a). This tendency was also found by Díaz et al. for Co/CNF catalysts.[32]
The 15 %Co/CNF catalyst with largest average Co particle size led to the highest weight percentage of naphta/gasoline and kerosene (Figure S7a). This catalyst had also a low growth factor α = 0.71 (Table 6 and Figure S7b), indicating its selectivity into low molecular weight hydrocarbons. The lower α values obtained with Co/CNF and Co/CNT catalysts compared to Co/FM could be related to confinement effects (shape selectivity effects that restrict the chain growth by the walls of CNT/CNF).[58]
As discussed in the introduction, the performance of FTS catalysts is related to parameters such as average Co particle size, composition, crystallographic structure, and H2
uptake.[41,54b,59]
Herein, we found that the CTY decreases with the increase of the average Co particle size (Figure 9a). A similar trend was observed by Bezemer et al. for Co/CNF catalysts,[54a]
and by Xiong et al. for Co/CNT and Co/C catalysts.[23b]
Small average Co particle size and high availability of surface cobalt is known to enhance CO dissociation.[54a,60]
In our work, the turnover frequency (TOF) (Figure 9b and Table 6) decreased with the increase of the average Co particle size (measured on spent catalysts) in the following order 15 %Co/CNF (17 nm) <15 %Co/CNT (14 nm) < 15 %Co/FM (11 nm). According to the literature, this is not the expected tendency. Den Breejen et al. prepared Co/CNF catalysts with particle sizes ranging from 2.6 to 16 nm for the FTS.[61]
They showed that the TOF decreased for Co particles smaller than 6 nm, and is unchanged for Co particles larger than 6 nm.More recently, the same trend was also observed by van Deelen et al. for Co/CNT catalysts.[62]
It is worth mentioning that in these studies a single carbon support was used. If the Co particle size was the only parameter influencing the activity, in our case, all catalysts should present similar performances. Since the evolution of TOF with average Co particle size obtained in this work was not in agreement with the literature, other factors have to be considered. Thus, we evaluated the effect of the Co crystal phase on the FTS
Figure 8. a) Cobalt-Time-Yield (molCOmolCo1s1); and b) C5 + selectivity for
all the catalysts. Conditions: T = 220°C, P = 20 bar, H2/CO = 2,
WHSV = 1155 mL h 1g
cat1. ri/r70h(catalysts deactivation;ri: initial activity and
r70h: activity at TOS = 70 h); d = Co sintering calculated based on the initial
and final Co particle size determined by TEM.
Table 6. Summary of catalytic results for 15 %Co/FM, 15 %Co/CNT, and 15 %Co/CNF catalysts. Reaction conditions: T = 220°C, P = 20 bar, H2/CO = 2, WHSV =
1155 h1, TOS = 94 h. Catalyst CO[a] [%] CTY (molCOmolCo1s 1)*10 4 TOF[b] [s1*10 3] TEM[c] [nm] Cohcp/Cofcc[d] CH4[e] [%] C5 +[f] [%] α[g] 15 %Co/FM 54 6.2 6.9 11 1.7 22 68 0.81 15 %Co/CNT 38 3.9 5.6 14 2.7 14 82 0.75 15 %Co/CNF 20 1.2 4.3 17 2.6 0.0 94 0.71
[a] Initial CO conversion. [b] Turnover frequency calculated at steady state based on the final TEM particle size. [c] Final particle size measured by TEM.[d]
Cohcp/Cofcc=after test obtained by deconvolution of XRD diffractogram. [e] CH4selectivity at steady state. [f] C5 + selectivity at steady state. [g] α =
1 2 3 4 5 6 7 8 9 10 11 12 13 14 15 16 17 18 19 20 21 22 23 24 25 26 27 28 29 30 31 32 33 34 35 36 37 38 39 40 41 42 43 44 45 46 47 48 49 50 51 52 53 54 55 56 57
activity and selectivity. The spent FT catalysts were character-ized by XRD to determine Cohcp/Cofccratio. No clear correlation
could be drawn between the Co crystal phase and the CTY, the TOF or the selectivity (Figures S8a–c). Figure S8a indicates that CH4 selectivity decreased with the increase of Cohcp/Cofcc ratio,
which is in agreement with the literature.[10,66]
However, the CTY and TOF seem to decrease when Cohcp/Cofcc ratio increased
(Figure S8b, c). This behavior is not in agreement with what is reported in the literature.[10,66]
This might be due to the stronger impact of other factors such as average Co particle size and spillover.
Interestingly, the observed performances can be correlated to the hydrogen uptake capacity of our catalysts. The H2uptake
in the range of 350–650°C was obtained from H2-TPD-MS. As
shown in Figure 9c, the TOF increased with increasing H2
uptake. This result strongly suggests that an enhanced hydro-gen spillover, such as that observed for the 15 %Co/FM catalyst, favors CO conversion.[38b]A recent study on the kinetics of FTS
over Co-based catalysts showed that removal of adsorbed carbon by hydrogenation in order to regenerate the active site appears to be rate limiting in combination with CO dissociation.[63]Figure 9d shows that C5 + selectivity decreased
with the increase of H2 uptake in the following order: 15 %Co/
CNF > 15 %Co/CNT > 15 %Co/FM. The opposite trend was ob-served for the production of methane (Figure S8d). The 15 %Co/ FM catalyst was more selective to CH4(24 %) and less selective
toward C5 + (67 %). The 15 %Co/FM catalyst favors also the hydrogenation of olefins formed during FTS. These trends are consistent with the assumption that hydrogen spillover
contrib-utes to an enhanced hydrogenation activity.[15b]
Many studies agree that reverse hydrogen spillover, which occurs on the catalyst surface due to the mobility of hydrogen between metal and the support matrix, favors hydrogenation reactions.[64]
Avari et al. found that the functional groups on Co/CNT catalysts enhanced hydrogen absorption on the catalyst surface and then favored the termination reactions to paraffin instead of chain growth.[65]
They also found that olefins/paraffins ratio in the final product was lowered by increasing the rate of termination reaction to paraffin.
Conclusions
Cobalt catalysts were prepared using three different carbon materials (CNT, CNF and FM), and evaluated in FTS. BET, Raman and XPS analyses revealed that the FM support developed a relatively large specific surface area and a high amount of surface oxygen groups and defects (edges). These character-istics favored the formation of small cobalt particles, as well as hydrogen uptake via a spillover mechanism. TPD-MS studies confirmed that hydrogen spillover increased with the increase of surface oxygen groups and the defects on the support. In FTS, the evolution of TOF with respect to the average Co particle size was contrary to the trend commonly reported in the literature. This suggests that the impact of other factors such as hydrogen spillover also play a decisive role. The best CTY was obtained with the 15 %Co/FM catalyst, which showed the highest H2-uptake, resulting from hydrogen spillover and Figure 9. Influence of: a) cobalt particle size (after test) on CTY (steady state); b) cobalt particle size (after test) on TOF (steady state); c) H2uptake obtained by
1 2 3 4 5 6 7 8 9 10 11 12 13 14 15 16 17 18 19 20 21 22 23 24 25 26 27 28 29 30 31 32 33 34 35 36 37 38 39 40 41 42 43 44 45 46 47 48 49 50 51 52 53 54 55 56 57
the smaller particle size. However, the 15 %Co/FM catalyst also had the highest selectivity into methane and higher alkanes, as well as the lowest olefins/paraffins ratio. This could be due to a combined effect of cobalt particle size, and reverse hydrogen spillover, which enhances the termination reactions to paraffins instead of chain growth. The higher TOF and the highly hydrogenated product obtained with the 15 %Co/FM catalyst are consistent with the potential of each catalyst to promote hydrogen spillover.
Experimental section
Support synthesis
The fibrous materials (FM), carbon nanotubes (CNT) and carbon nanofibers (CNF) were synthesized and functionalized following a published procedure.[20]
Catalyst preparation
The cobalt catalysts were prepared by incipient wetness impregna-tion with an aqueous solution of cobalt acetate (Co (CH3COO)2· 4H2O, 97 %). A loading of 15 % of cobalt on the carbon
supports was targeted. First, 1 g of carbon support was dried at 100°C for 1 h under dynamic vacuum. After, the solution containing the Co precursor (767 mg Co (CH3COO)2· 4H2O, 5 mL) was
intro-duced and sonicated for 20 min. Then, four cycles of 10 min sonication (one every hour) were performed under static vacuum in order to complete the impregnation. Finally, the solid was dried at 120°C overnight and calcined under argon flow at 300°C for 2 h with a heating rate of 10°C min1. The resulting catalysts supported
on FM, CNT and CNF were denoted respectively 15 %Co/FM, 15 % Co/CNT and 15 %Co/CNF.
Material characterization
Two types of microscopes were used for characterization. First, a JEOL JEM-1011 microscope equipped with a tungsten thermionic electron source and with an acceleration voltage of 100 kV. For high-resolution and STEM-HAADF observations a JEOL JEM ARM200F Cold FEG corrected probe with an acceleration voltage of 200 kV was used. The particle size distribution of fresh and used catalysts was evaluated by TEM. At least 300 nanoparticles were measured for each sample. The calcined under inert atmosphere catalysts were reduced at 350°C for 2 h at 5°C min 1under 40 %H
2/
Ar flow and then exposed to air. For TEM analysis, catalysts were prepared by ultrasound-assisted dispersion in pure ethanol, and the suspensions were dropped onto a collodion carbon covered copper film.
Surface area, pore size distribution and pore volume measurements were determined from N2 adsorption/desorption isotherms at –
196°C using a Micromeritics instrument. Prior to the analysis, all samples were degassed under vacuum at 120°C for 6 h to clean physisorbed species.
The crystalline structure and crystallite size of the fresh catalysts were determined by X-ray diffraction. Before analysis, the catalysts were reduced under 40 %H2/Ar flow for 2 h at 350°C with a heating
rate of 5°C min 1. The crystal size of the fresh catalysts was
determined using data obtained from HighScore software. The crystalline structure of the used catalysts was also determined by X-ray diffraction, and MAUD software was used for Rietveld
refine-ment in order to quantify the different crystalline phases. The measurements were carried out on a Bragg-Brentano configuration (θ-θ) EMPYREAN diffractometer equipped with a cobalt anode fed at 35 kV and 45 mA. The radiation generated by the anode has an average wavelength (Kα) λ = 1.79 Å. The analysis was carried with an angular domain 2θ of between 10–120°, a step of 0.07°/s and an acquisition time of 200 s. The size of the crystallites was calculated using the Scherrer equation.[31]
For the in- situ XRD, the heating oven was mounted on the diffractometer, followed by introducing the sample into the heating chamber. The furnace chamber was purged at 1 bar for four vacuum-gas (5 %H2/N2) cycles. The catalyst was progressively
reduced (from Co3O4 to Co0) in the furnace under 5 %H2/N2 flow
from 30°C to 800°C with a heating rate of 5°C min1and
diffracto-grams were recorded at various temperatures. MAUD software was used for Rietveld refinement in order to quantify crystalline phases at each temperature.
The TGA analysis was performed with a TGA/DSC Shimadzu. The measurements were carried out from 25 to 1100°C under air flow of 20 mL min 1with a heating rate of 10°C min1.
The X-ray photoelectron spectroscopy (XPS) was performed on calcined samples using a monochromatized Al Kα (hν = 1486.6 eV) source on a ThermoScientific Kα system. The X-ray Spot size was about 400 μm. The pass energy was fixed at 30 eV with a step of 0.1 eV for core levels and 160 eV for surveys (step 1 eV). The spectrometer energy calibration was done using the Au 4f7/2(83.9 �
0.1 eV) and Cu 2p3/2 (932.8 � 0.1 eV) photoelectron lines. XPS
spectra were recorded in direct mode N(Ec) and the background signal was removed using the Shirley method.[67]
Raman analysis was performed with a micro Raman Spectrometer HR 800 Jobin Yvon Horiba using a laser of 532 nm wavelength as an excitation source.[20]
Magnetic measurements were performed using a Quantum Design Squid magnetometer at 27°C and field up to 5 T.[68]The
measure-ments were performed on reduced catalysts. Before analysis, catalysts were reduced in 40 %H2/Ar flow for 7 h at 350°C with a
heating rate of 5°C min1. Standard VSM capsules were filled with a
known amount (a few mg) of sample and sealed. To avoid any oxidation, the samples were prepared in a glovebox, and trans-ferred to the cryostat in a Schlenk vessel. The VSM capsule containing the sample was rapidly introduced into the VSM in order to avoid exposure of the sample to air.
Temperature-programmed reduction (TPR) profiles of the calcined catalysts were recorded with a Micromeritics AutoChem 2920 Analyzer in the temperature range of 50–1000°C. This was used to determine the reducible species present in the catalyst and revealed the temperature at which the reduction occurred in each system.[69]100 mg of the sample was placed in a quartz reactor and
reduced by a 5 %H2/N2gas mixture with a flow rate of 25 mL min 1
and a heating rate of 10°C min1. Prior to the analysis, the sample
was purged under argon at 120°C for 1 h. The cobalt loading of the catalyst was determined by ICP-OES after mineralization of the samples in a mixture of HNO3/HCl for one day.
CO/CO2/H2-TPD-MS (Altamira Instruments AMI-300 device) was
used to characterize the nature of the oxygen surface groups after HNO3treatment, to elucidate the nature of hydrogen species during
the desorption step, and to determine the average active metal particle size in supported Co-catalysts. First, the catalyst was purged with argon at 120°C for 1 hour in order to clean the surface of the sample. The sample was cooled to 50°C, followed by a reduction at 350°C for 6 h at 5°C min 1under 5 %H
2/N2flow, and then cooled
1 2 3 4 5 6 7 8 9 10 11 12 13 14 15 16 17 18 19 20 21 22 23 24 25 26 27 28 29 30 31 32 33 34 35 36 37 38 39 40 41 42 43 44 45 46 47 48 49 50 51 52 53 54 55 56 57
occurred. Then, the flow of hydrogen was switched to helium, and the sample was cooled to 50°C. Temperature programmed desorption coupled with online mass spectroscopy (TPD-MS) was finally performed (10°C min 1ramp until 1050°C) to quantify the
amounts of H2, CO and CO2 released. The H2 peak surface (350–
650°C) was used to determine cobalt dispersion and its average particle size, according to the following formulas [Eqs. (1)(2)]:
D %ð Þ ¼Vm�M � F Vmol�%Me
�100 (1)
Where Vmis the irreversibly chemisorbed gas (cm3, STP per gram of
catalyst), M is the molar mass of the metal (g per mol of metal),Vmol
is the standard molar volume of the adsorbate (cm3STP per mol), %
Me is the mass fraction of metal and F is the stoichiometry factor (number of gas molecules per atom of metal).[70]
dCoðnmÞ ¼
96
D% (2)
Where dCo(nm) is the average particle size.
The experimental set-up for FTS is outlined in Figure S9. The reactor was composed of a stainless-steel tube of about 33 cm length and 14 mm inner diameter. The reactor was loaded with 36 g of α-Al2O3
followed by a mixture of 2 g of catalyst and 8 g of inert SiC (125– 250 μm) in order to better dissipate the heat released from the reaction, and finally 20 g of α-Al2O3 and a quartz wool layer. A
thermocouple was set at the center of the catalyst bed to control the reaction temperature. The reactor was heated from ambient temperature to 120°C with 100 mL · min 1of argon with a heating
rate of 1°C min1for 1 hour. Then, the catalyst was reduced under
40 %H2/Ar flow at 350°C for 8 h with a heating rate of 5°C min1.
After the reduction, the FT reaction was carried out at 220°C and 20 bar for 94 h. The inlet gas mixture was composed of 52 %(v/v) H2, 25 % (v/v) CO and 23 % (v/v) Ar. The non-condensable gaseous
products were sampled using a bag and analyzed by μ-GC (A 3000 model, Agilent) equipped with a thermal conductivity detector (TCD). The condensable products were recovered using hot (150°C) and cold (4°C) condensers and analyzed by GC-SIMDIST (SHIMAZU) equipped with a flame ionization detector (FID). The catalytic performances were calculated using the following expressions [Eqs. (3)–(5)]:
XCO¼
_FCO ;i _FCO; out
_FCO; i
(3)
_FCO;i=molar flow rate [mol s 1] of CO fed to the reactor (mol s1)
_FCO out=molar flow rate [mol s1] of CO at the reactor outlet (mol s 1)
XCO=CO conversion (%)
CTY ¼_FCO ;i�XCO�MCo
mcat (4)
where,
_FCO;i=molar flow rate [mol s 1] of CO fed to the reactor (mol s1)
mcat=mass of catalyst (g)
MCo=molar mass of Co (g mol 1)
XCO=CO conversion (%)
CTY = Cobalt-Time-Yield (molCOmolCo 1s 1)
TOF ¼CTY � MCo
DCo�xCo (5)
CTY = Cobalt-Time-Yield (molCOgcat 1s 1)
xCo=Co loading (gcogcat 1)
DCo=Co dispersion has been calculated based on the TEM Co size
after the catalytic tests TOF = turn-over frequency (s 1)
The product selectivity for hydrocarbons Si was calculated as
follows [Eq. (6)]:
Si¼
i � _Fj
_FCO; i _FCO; out
�100 (6)
Where Siis the selectivity in a j product containing i carbon atoms,
and _Fjis the molar flow rate of the product out of the reactor[71]
Acknowledgements
This research (CatFisch project) was funded by the “Région Midi-Pyrénées” and the University of Toulouse (France). The authors also thank colleagues at RAPSODEE, LCC and LPCNO for technical help. B.F.M. acknowledges the exploratory project under the Fundação para a Ciência e a Tecnologia (FCT, Portugal) Investigator Programme (ref. IF/00301/2015) with financial sup-port from FCT/MCTES, through national funds (PIDDAC).
Conflict of Interest
The authors declare no conflict of interest.
Keywords: carbon supports · cobalt · Fischer-Tropsch synthesis · heterogeneous catalysis · hydrogen spillover
[1] R. Ramanathan, Technol. Forecast. Soc. Change 2006, 73, 483–494. [2] A. Tavasoli, M. Trépanier, R. M. Malek, A. K. Dalai, N. Abatzoglou, Fuel
Process. Technol. 2009, 90, 1486–1494.
[3] B. H. Davis, Ind. Eng. Chem. Res. 2007, 46, 8938–8945.
[4] a) G. Prieto, M. I. S. De Mello, P. Concepcion, R. Murciano, S. B. C. Pergher, A. Martinez, ACS Catal. 2015, 5, 3323–3335; b) R. Munirathinam, D. Pham Minh, A. Nzihou, Ind. Eng. Chem. Res. 2018, 57, 16137–16161. [5] R. C. Reuel, C. H. Bartholomew, J. Catal. 1984, 77, 63–77.
[6] a) P. J. V. Berge, J. V. D. Loosdrecht, S. Barradas, A. M. V. D. Kraan, Catal. Today 2000, 58, 321–334; b) A. Tavasoli, M. Yadollah, A. Khodadadi, M. A. Mousavian, Iran. J. Chem. Chem. Eng. 2005, 24, 4–5.
[7] T. Fu, Z. Li, Chem. Eng. Sci. 2015, 135, 3–20.
[8] G. L. Bezemer, J. H. Bitter, H. P. C. E. Kuipers, H. Oosterbeek, J. E. Hole-wijn, X. Xu, F. Kapteijn, A. J. van Dillen, K. P. de Jong, J. Am. Chem. Soc.
2006, 128, 3956–3964.
[9] a) S. A. Chernyak, E. V. Suslova, A. S. Ivanov, A. V. Egorov, K. I. Maslakov, S. V. Savilov, V. V. Lunin, Appl. Catal. A 2016, 523, 221–229; b) T. Fu, J. Lv, Z. Li, Ind. Eng. Chem. Res. 2014, 53, 1342–1350.
[10] J. X. Liu, H. Y. Su, D. P. Sun, B. Y. Zhang, W. X. Li, J. Am. Chem. Soc. 2013, 135, 16284–16287.
[11] a) M. K. Gnanamani, G. Jacobs, W. D. Shafer, B. H. Davis, Catal. Today
2013, 215, 13–17; b) L. Nie, Z. Li, T. Kuang, S. Lyu, S. Liu, Y. Zhang, B.
1 2 3 4 5 6 7 8 9 10 11 12 13 14 15 16 17 18 19 20 21 22 23 24 25 26 27 28 29 30 31 32 33 34 35 36 37 38 39 40 41 42 43 44 45 46 47 48 49 50 51 52 53 54 55 56 57
Wang, J. Zhang, C. Liu, J. Sun, B. Peng, Y. Wang, K. G. Rappé, Y. Zhang, J. Li, L. Nie, ACS Catal. 2018, 8, 7787–7798.
[12] a) L. Qian, W. Cai, L. Zhang, L. Ye, J. Li, M. Tang, B. Yue, H. He, Appl. Catal. B 2015, 164, 168–175; b) S. T. Srinivas, P. K. Rao, J. Catal. 1994, 148, 470–477; c) P. A. Sermon, G. C. Bond, Catal. Rev. Sci. Eng. 1999, 41, 37–41; d) M. Choi, S. Yook, H. Kim, ChemCatChem 2015, 7, 1048–1057; e) S. K. Konda, A. Chen, Mater. Today 2016, 19, 100–108; f) A. D. Lueking, R. T. Yang, Appl. Catal. A 2004, 265, 259–268.
[13] a) J. T. Miller, B. L. Meyers, M. K. Barr, F. S. Modica, D. C. Koningsberger, J. Catal. 1996, 159, 41–49; b) J. Im, H. Shin, H. Jang, H. Kim, M. Choi, Nat. Commun. 2014, 5, 1–8; c) R. B. Levy, M. Boudart, J. Catal. 1974, 32, 304– 314.
[14] I. C. Gerber, P. Serp, Chem. Rev. 2019, DOI: 10.1021/acs.chem-rev.9b00209.
[15] a) D. Nabaho, J. W. H. Niemantsverdriet, M. Claeys, E. v. Steen, Catal. Today 2016, 275, 27–34; b) D. Nabaho, J. W. Niemantsverdriet, M. Claeys, E. van Steen, Catal. Today 2016, 261, 17–27.
[16] T. N. Phaahlamohlaka, D. O. Kumi, M. W. Dlamini, R. Forbes, L. L. Jewell, D. G. Billing, N. J. Coville, ACS Catal. 2017, 7, 1568–1578.
[17] a) D. S. Pyle, E. M. A. Gray, C. J. Webb, Int. J. Hydrogen Energy 2016, 41, 19098–19113; b) Z. Wang, F. H. Yang, R. T. Yang, J. Phys. Chem. C 2010, 114, 1601–1609.
[18] P. Serp, in Comprehensive Inorganic Chemistry II (Second Edition), Reedijk, J. & Poeppelmeier, K. Eds, 2013, Elsevier, Amsterdam, pp. 323–369. [19] J. C. Espinosa, R. C. Contreras, S. Navalón, C. Rivera-Cárcamo, M. Álvaro,
B. F. Machado, P. Serp, H. Garcia, Eur. J. Inorg. Chem. 2019, 1979–1987. [20] R. C. Contreras, B. Guicheret, B. F. Machado, C. Rivera-Cárcamo, M. A. Curiel Alvarez, B. Valdez Salas, M. Ruttert, T. Placke, A. Favre Réguillon, L. Vanoye, C. de Bellefon, R. Philippe, P. Serp, J. Catal. 2019, 372, 226–244. [21] J. Zhu, A. Holmen, D. Chen, ChemCatChem 2013, 5, 378–401.
[22] P. Serp, J. L. Figueiredo, in Carbon materials for catalysis, Eds, 2009, John Wiley & Sons.
[23] a) T. Fu, R. Liu, J. Lv, Z. Li, Fuel Process. Technol. 2014, 122, 49–57; b) H. Xiong, M. A. M. Motchelaho, M. Moyo, L. L. Jewell, N. J. Coville, J. Catal.
2011, 278, 26–40; c) A. Nakhaei, P. Mohammadreza, Catal. Lett. 2013,
143, 1328–1338.
[24] P. Serp, M. Corrias, P. Kalck, Appl. Catal. A 2003, 253, 337–358.
[25] P. Rai, S. K. Dubey, in Handbook of Materials Characterization (Ed.: C. Springer), 2018, pp. 405–434.
[26] J. J. Contreras-Navarrete, F. G. Granados-Martínez, L. Domratcheva-Lvova, N. Flores-Ramírez, M. R. Cisneros-Magaña, L. García-González, L. Zamora-Peredo, M. L. Mondragón-Sánchez, Superficies y Vacio 2015, 28, 111–114.
[27] L. Chen, D. Ma, X. Li, X. Bao, Catal. Lett. 2006, 111, 133–139.
[28] A. Tavasoli, M. Trépanier, A. K. Dalai, N. Abatzoglou, J. Chem. Eng. Data
2010, 55, 2757–2763.
[29] O. Akbarzadeh, N. Asmawati, M. Zabidi, Y. A. Wahab, N. A. Hamizi, Z. Z. Chowdhury, Z. Merican, A. Merican, Symmetry 2019, 11, 7–7.
[30] O. Nashed, B. Partoon, B. Lal, K. M. Sabil, A. M. Shariff, Energy 2019, 174, 602–610.
[31] D. Schanke, S. Vada, E. A. Blekkan, A. M. Hilmen, A. Hoff, A. Holmen, J. Catal. 1995, 156, 85–95.
[32] J. A. Díaz, M. Martínez-Fernández, A. Romero, J. Luis, Fuel 2013, 111, 422–429.
[33] A. Y. Khodakov, A. Griboval-Constant, R. Bechara, F. Villain, J. Phys. Chem. B 2001, 105, 9805–9811.
[34] S. Bai, C. Huang, J. Lv, Z. Li, Catal. Commun. 2012, 22, 24–27.
[35] J. Lv, X. Ma, S. Bai, C. Huang, Z. Li, J. Gong, Int. J. Hydrogen Energy 2011, 36, 8365–8372.
[36] A. Y. Khodakov, Catal. Today 2009, 144, 251–257.
[37] a) O. Akbarzadeh, N. A. M. Zabidi, Y. A. Wahab, Z. Z. C. N. A. Hamizi, Z. M. A. Merican, M. A. Rahman, S. Akhter, E. Rasouli, M. R. Johan, Symmetry 2018, 10, 572; b) S. Taghavi, A. Asghari, A. Tavasoli, Chem. Eng. Res. Des. 2017, 119, 198–208.
[38] a) M. Trépanier, A. K. Dalai, N. Abatzoglou, Appl. Catal. A 2010, 374, 79– 86; b) M. Trépanier, A. Tavasoli, A. K. Dalai, N. Abatzoglou, Fuel Process. Technol. 2009, 90, 367–374.
[39] P. A. Chernavskii, J. A. Dalmon, N. S. Perov, A. Y. Khodakov, Oil Gas Sci. Technol. 2009, 64, 25–48.
[40] H. Park, Y. Kim, H. Youn, H. Choi, Y. Kim, ChemCatChem 2017, 9, 4098– 4104.
[41] J. X. Liu, P. Wang, W. Xu, E. J. M. Hensen, Engineering 2017, 3, 467–476. [42] X. Li, M. U. Nisa, Y. Chen, Z. Li, Ind. Eng. Chem. Res. 2019, 58, 3459–3467. [43] S. A. Chernyak, A. S. Ivanov, K. I. Maslakov, A. V. Egorov, Z. Shen, S. S.
Savilov, V. V. Lunin, Phys. Chem. Chem. Phys. 2017, 19, 2276–2285. [44] J. L. Figueiredo, J. Mater. Chem. A 2013, 1, 9351–9364.
[45] Q. Li, A. D. Lueking, J. Phys. Chem. C 2011, 115, 4273–4282.
[46] B. F. Machado, M. Oubenali, M. Rosa Axet, T. Trang Nguyen, M. Tunckol, M. Girleanu, O. Ersen, I. C. Gerber, P. Serp, J. Catal. 2014, 309, 185–198. [47] M. Zieliński, R. Wojcieszak, S. Monteverdi, M. Mercy, M. M. Bettahar, Int.
J. Hydrogen Energy 2007, 32, 1024–1032.
[48] a) R. Bhowmick, S. Rajasekaran, D. Friebel, C. Beasley, L. Jiao, H. Ogasawara, H. Dai, B. Clemens, A. Nilsson, J. Am. Chem. Soc. 2011, 133, 5580–5586; b) F. Coloma, A. Sepúlveda-Escribano, J. L. G. Fierro, F. Rodríguez-Reinoso, Appl. Catal. A 1997, 150, 165–183.
[49] C.-H. Chen, C.-C. Huang, Microporous Mesoporous Mater. 2008, 109, 549– 559.
[50] P. Badenes, L. Daza, I. Rodriguez-Ramos, A. Guerrero-Ruiz, Stud. Surf. Sci. Catal. 1997, 112, 241–250.
[51] M. Carosso, A. Lazzarini, A. Piovano, R. Pellegrini, S. Morandi, M. Manzoli, J. G. Vitillo, M. J. Ruiz, C. Lamberti, E. Groppo, Faraday Discuss. 2018, 208, 227–242.
[52] C. I. Contescu, C. M. Brown, Y. Liu, V. V. Bhat, N. C. Gallego, J. Phys. Chem. C 2009, 113, 5886–5890.
[53] J. P. den Breejen, J. R. A. Sietsma, H. Friedrich, J. H. Bitter, K. P. de Jong, J. Catal. 2010, 270, 146–152.
[54] a) G. L. Bezemer, J. H. Bitter, H. P. C. E. Kuipers, H. Oosterbeek, J. E. Holewijn, X. Xu, F. Kapteijn, A. J. Van Diilen, K. P. De Jong, J. Am. Chem. Soc. 2006, 128, 3956–3964; b) J. P. Den Breejen, P. B. Radstake, G. L. Bezemer, J. H. Bitter, V. Froseth, A. Holmen, K. P. De Jong, J. Am. Chem. Soc. 2009, 131, 7197–7203.
[55] J. Chen, J. Li, Y. Zhao, Y. Zhang, J. Hong, J. Nat. Gas Chem. 2012, 21, 673–679.
[56] A. R. De La Osa, A. De Lucas, J. L. Valverde, A. Romero, I. Monteagudo, P. Coca, P. Sánchez, Catal. Today 2011, 167, 96–106.
[57] C. Xing, G. Yang, D. Wang, C. Zeng, Y. Jin, R. Yang, Y. Suehiro, N. Tsubaki, Catal. Today 2013, 215, 24–28.
[58] V. Subramanian, K. Cheng, C. Lancelot, S. Heyte, S. Paul, S. Moldovan, O. Ersen, M. Marinova, V. V. Ordomsky, A. Y. Khodakov, ACS Catal. 2016, 6, 1785–1792.
[59] C. Hernández Mejía, T. W. van Deelen, K. P. de Jong, Nat. Commun.
2018, 9, 1–8.
[60] J. Aluha, N. Abatzoglou, Can. J. Chem. Eng. 2018, 96, 2127–2137. [61] J. P. den Breejen, P. B. Radstake, G. L. Bezemer, J. H. Bitter, V. Frøseth, A.
Holmen, K. P. de Jong, J. Am. Chem. Soc. 2009, 131, 7197–7203. [62] T. W. van Deelen, H. Su, N. A. J. M. Sommerdijk, K. P. de Jong, Chem.
Commun. 2018, 2530–2533.
[63] R. Pestman, W. Chen, E. Hensen, ACS Catal. 2019, 9, 4189–4195. [64] a) F. Yang, B. Hu, W. Xia, B. Peng, J. Shen, M. Muhler, J. Catal. 2018, 365,
55–62; b) G. F. Taylor, S. J. Thomson, G. Webb, J. Catal. 1968, 12, 191– 197.
[65] M. Davari, S. Karimi, A. Tavasoli, A. Karimi, Appl. Catal. A 2014, 485, 133– 142.
[66] a) M. K. Gnanamani, G. Jacobs, W. D. Shafer, B. H. Davis, Catal. Today
2013, 215, 13–17; b) S. Lyu, L. Wang, J. Zhang, C. Liu, J. Sun, B. Peng, Y.
Wang, K. G. Rappé, Y. Zhang, J. Li, L. Nie, ACS Catal. 2018, 8, 7787–7798. [67] M. Repoux, Surf. Interface Anal. 1992, 18, 567–570.
[68] M. Verelst, T. O. Ely, C. Amiens, E. Snoeck, P. Lecante, A. Mosset, M. Respaud, J. M. Broto, B. Chaudret, Chem. Mater. 2002, 11, 2702–2708. [69] Micromeritics, AutoChem 2920 Automated Catalyst Characterization
System Operator’s Manual., 2009.
[70] A. Aznárez, A. Gil, S. A. Korili, RSC Adv. 2015, 5, 82296–82309.
[71] J. Scalbert, I. Clémençon, C. Legens, F. Diehl, D. Decottignies, S. Maury, Oil Gas Sci. Technol. 2015, 70, 419–428.
1 2 3 4 5 6 7 8 9 10 11 12 13 14 15 16 17 18 19 20 21 22 23 24 25 26 27 28 29 30 31 32 33 34 35 36 37 38 39 40 41 42 43 44 45 46 47 48 49 50 51 52 53 54 55 56 57
Fischer-Tropsch Synthesis: The TOF
vs particle size evolution of carbon-supported cobalt catalysts prepared on different carbon supports does not follow the normally observed
tendency. This surprising result can be rationalized by H-(reverse)spillover on some carbon supports that enhance the CO hydrogenation.
A. C. Ghogia, S. Cayez, Dr. B. F. Machado, Prof. Dr. A. Nzihou, Prof. Dr. P. Serp*, Dr. K. Soulantica*, Dr. D. Pham Minh*
1 – 13
Hydrogen Spillover in the Fischer-Tropsch Synthesis on Carbon-supported Cobalt Catalysts
![Table 4. XPS data for high-resolution O 1s of catalysts. [45]](https://thumb-eu.123doks.com/thumbv2/123doknet/11626095.305208/7.892.467.806.388.1062/table-xps-data-high-resolution-o-s-catalysts.webp)