HAL Id: inserm-02145714
https://www.hal.inserm.fr/inserm-02145714
Submitted on 3 Jun 2019
HAL is a multi-disciplinary open access
archive for the deposit and dissemination of
sci-entific research documents, whether they are
pub-lished or not. The documents may come from
teaching and research institutions in France or
abroad, or from public or private research centers.
L’archive ouverte pluridisciplinaire HAL, est
destinée au dépôt et à la diffusion de documents
scientifiques de niveau recherche, publiés ou non,
émanant des établissements d’enseignement et de
recherche français ou étrangers, des laboratoires
publics ou privés.
Targeting TMEM176B Enhances Antitumor Immunity
and Augments the Efficacy of Immune Checkpoint
Blockers by Unleashing Inflammasome Activation
Mercedes Segovia, Sofia Russo, Mathias Jeldres, Yamil Mahmoud, Valentina
Perez, Maite Duhalde, Pierre Charnet, Matthieu Rousset, Sabina Victoria,
Florencia Veigas, et al.
To cite this version:
Mercedes Segovia, Sofia Russo, Mathias Jeldres, Yamil Mahmoud, Valentina Perez, et al..
Target-ing TMEM176B Enhances Antitumor Immunity and Augments the Efficacy of Immune Checkpoint
Blockers by Unleashing Inflammasome Activation. Cancer Cell, Elsevier, 2019, 35 (5), pp.767-781.
�10.1016/j.ccell.2019.04.003�. �inserm-02145714�
Article
Targeting TMEM176B Enhances Antitumor Immunity
and Augments the Efficacy of Immune Checkpoint
Blockers by Unleashing Inflammasome Activation
Graphical Abstract
Highlights
d
TMEM176B inhibits the NLRP3 inflammasome by controlling
cytosolic Ca
2+.
d
Lack of
Tmem176b enhances antitumor immunity via the
caspase-1/IL-1
b pathway
d
Human tumors responding to immune checkpoint blockade
display an inflammasome-activated signature
d
A TMEM176B inhibitor improves the antitumor activity of
immune checkpoint blockade
Authors
Mercedes Segovia, Sofia Russo,
Mathias Jeldres, ..., M. Romina Girotti,
Gabriel A. Rabinovich, Marcelo Hill
Correspondence
ccuturi@nantes.inserm.fr (M.C.C.),
mhill@pasteur.edu.uy (M.H.)
In Brief
Segovia et al. show that TMEM176B
inhibits inflammasome activation and
IL-1
b cleavage by controlling cytosolic Ca
2+in dendritic cells and macrophages.
Inhibition of TMEM176B enhances tumor
infiltration by CD8
+T cells and improves
the antitumor activity of immune
checkpoint blockers.
Segovia et al., 2019, Cancer Cell35, 767–781
May 13, 2019ª 2019 The Authors. Published by Elsevier Inc. https://doi.org/10.1016/j.ccell.2019.04.003
Cancer Cell
Article
Targeting TMEM176B Enhances Antitumor Immunity
and Augments the Efficacy of Immune Checkpoint
Blockers by Unleashing Inflammasome Activation
Mercedes Segovia,1,2,9Sofia Russo,1,2,9Mathias Jeldres,1Yamil D. Mahmoud,3Valentina Perez,1,2Maite Duhalde,1
Pierre Charnet,4Matthieu Rousset,4Sabina Victoria,1Florencia Veigas,3Ce´dric Louvet,5Bernard Vanhove,5,6
R. Andre´s Floto,7Ignacio Anegon,5Maria Cristina Cuturi,5,10,*M. Romina Girotti,3,10Gabriel A. Rabinovich,3,8,10
and Marcelo Hill1,2,10,11,*
1Laboratory of Immunoregulation and Inflammation, Institut Pasteur de Montevideo, 11400 Montevideo, Uruguay
2Immunobiology Department, Faculty of Medicine, University of the Republic, 11800 Montevideo, Uruguay
3Laboratories of Immunopathology and Translational Immuno-Oncology, Institute of Biology and Experimental Medicine (IBYME), National
Council of Scientific and Technical Investigations (CONICET), C1428 Buenos Aires, Argentina
4Institut des Biomole´cules Max Mousseron (IBMM), UMR 5247, CNRS ENSCM, Universite´ de Montpellier, 34093 Montpellier, France
5INSERM UMR 1064, Center for Research in Transplantation and Immunology, Universite´ de Nantes, CHU Nantes, Institut de Transplantation
Urologie Ne´phrologie (ITUN), 44093 Nantes, France
6Xenothera, 44093 Nantes, France
7Molecular Immunity Unit, Department of Medicine, University of Cambridge, CB2 0QH Cambridge, UK
8Department of Biological Chemistry, School of Exact and Natural Sciences, University of Buenos Aires, C1428 Buenos Aires, Argentina
9These authors contributed equally
10These authors contributed equally
11Lead Contact
*Correspondence:ccuturi@nantes.inserm.fr(M.C.C.),mhill@pasteur.edu.uy(M.H.)
https://doi.org/10.1016/j.ccell.2019.04.003
SUMMARY
Although immune checkpoint blockers have yielded significant clinical benefits in patients with different
ma-lignancies, the efficacy of these therapies is still limited. Here, we show that disruption of transmembrane
protein 176B (TMEM176B) contributes to CD8
+T cell-mediated tumor growth inhibition by unleashing
inflammasome activation. Lack of
Tmem176b enhances the antitumor activity of anti-CTLA-4 antibodies
through mechanisms involving caspase-1/IL-1
b activation. Accordingly, patients responding to checkpoint
blockade therapies display an activated inflammasome signature. Finally, we identify BayK8644 as a potent
TMEM176B inhibitor that promotes CD8
+T cell-mediated tumor control and reinforces the antitumor activity
of both anti-CTLA-4 and anti-PD-1 antibodies. Thus, pharmacologic de-repression of the inflammasome by
targeting TMEM176B may enhance the therapeutic efficacy of immune checkpoint blockers.
INTRODUCTION
Blockade of immune checkpoints, including the cytotoxic T lymphocyte-associated protein (CTLA)-4 and the programmed cell death-1 (PD-1)/PD ligand-1 (PD-L1) pathway, have increased overall survival and progression-free survival of cancer patients.
However, only a restricted number of patients show clinical ben-efits (Syn et al., 2017; Binnewies et al., 2018), suggesting that other immune inhibitory mechanisms may limit the efficacy of these treatments. In this regard, high intratumoral K+leads to
T cell dysfunction by inhibiting voltage and Ca2+-dependent K+ channels expressed in antitumoral T lymphocytes (Eil et al.,
Significance
Therapies targeting immune checkpoint pathways have revolutionized treatment of several cancers. However, innate and adaptive mechanisms may limit the clinical efficacy of this therapeutic modality. Here, we identify the transmembrane protein 176B (TMEM176B) as an innate immune checkpoint that curtails CD8+T cell-mediated immunity by repressing in-flammasome activation. Genetic disruption or pharmacologic inhibition of TMEM176B potentiates antitumor immunity and enhances the efficacy of anti-CTLA-4 and anti-PD-1 antibodies in mice by unleashing inflammasome activation. Accord-ingly, an activated inflammasome signature delineates favorable clinical responses in patients receiving immune checkpoint blockers. Thus, targeting TMEM176B may influence antitumor effector mechanisms by de-repressing inflammasome activation.
A B D G H I J K C F E L M N
2016), suggesting a role for ionic channels as regulatory check-points and therapeutic targets to reinforce antitumor immunity.
Recognition of immunogenic tumors by innate immune sen-sors including the TMEM173 (STING) type I interferon pathway leads to stimulation of CD8+ T cell-mediated immunity and
potentiation of CTLA-4- and PD-1-targeted therapies (Woo et al., 2014). Within the human myeloid compartment, STING controls the NLRP3 inflammasome (Gaidt et al., 2017), a cyto-solic multiprotein complex that, once activated, cleaves cas-pase-1, which then processes pro-interleukin-1b (IL-1b) and pro-IL-18 to give the active and secreted forms of these pro-inflammatory cytokines (Rathinam and Fitzgerald, 2016). Altered levels of cytosolic cations have been shown to control secretion of active IL-1b through modulation of inflammasome activation (Gong et al., 2018). Interestingly, activation of the NLRP3 inflammasome following immunogenic chemotherapy sensitizes tumors to immune checkpoint blockers (Pfirschke et al., 2016). However, the role of the NLRP3 inflammasome in modulating checkpoint blockade therapies has not yet been explored.
Transmembrane protein 176B (TMEM176B), also known as tolerance-related and induced (TORID), has been identified as an immunoregulatory cation channel (Louvet et al., 2005; Segovia et al., 2014). This ubiquitously expressed protein contains four transmembrane domains and an ITIM motif in its C terminus (Eon Kuek et al., 2016). TMEM176B and its homologous TMEM176A are members of the CD20-like MS4A family of pro-teins (Eon Kuek et al., 2016; Louvet et al., 2005) and are highly ex-pressed in monocytes, macrophages, and CD11b+dendritic cells (DCs) (Condamine et al., 2010). Here we explored the role of TMEM176B in inflammasome regulation, T cell-dependent anti-tumor immunity and response to immune checkpoint blockade therapies.
RESULTS
TMEM176B Inhibits Activation of the NLRP3 Inflammasome
To investigate whether TMEM176B regulates inflammasome activation, we injected ATP in wild-type (WT) or Tmem176b / mice (Figure 1A). In this model, neutrophil recruitment to the peritoneal cavity relies on caspase-1/11 activation (Schroeder et al., 2017). We observed that Tmem176b / mice recruited significantly more neutrophils than WT animals. To determine whether increased neutrophil recruitment upon ATP injection was dependent on inflammasome activation, we generated
Tmem176b / Casp1 / double knockout (DKO) mice (Fig-ure S1A). Peritoneal neutrophil recruitment was almost completely inhibited in Tmem176b / Casp1 / compared with
Tmem176b / animals (Figure 1A). ATP-induced neutrophil recruitment in Tmem176b / mice was also interrupted by injec-tion of a caspase-1 inhibitor (Figure S1B). We then stimulated WT and Tmem176b / bone marrow-derived DCs (BMDCs)
with the well-established NLRP3 activators ATP and nigericin and determined IL-1b in culture supernatants as a readout of inflammasome activation. We observed that, for both stimuli,
Tmem176b / BMDCs secreted significantly higher levels of
IL-1b than WT DCs in a dose- and time-dependent manner (Figures 1B and 1C). Similar findings were observed when we stimulated BMDCs with aluminum particles (Figure S1C). Western blot studies confirmed that the mature (cleaved) form of IL-1b was more abundant in culture supernatants from
Tmem176b / BMDCs compared with those obtained from WT cells (Figure 1D). Moreover, we observed increased mature caspase-1 in supernatants from Tmem176b / BMDCs compared with WT cells when stimulated with ATP (Figure 1D). Although lower doses (2.5 mM) of nigericin induced expression of
Figure 1. The Ionic Channel TMEM176B Inhibits the NLRP3 Inflammasome
(A) Representative dot plots and absolute number of neutrophils (CD11b+
Ly6Cint
Ly6G+
) in peritoneal lavage 4 h after intraperitoneal (i.p.) injection with vehicle control (PBS) or 20 mg/kg ATP. In the plots, CD11b+cells were analyzed for Ly6C and Ly6G expression. At least six animals were studied in each group in two independent experiments. ns, not significant; *p < 0.05; one-way ANOVA test.
(B and C) Dose-response (B) and time-response (C) analysis of WT and Tmem176b /
bone marrow-derived DCs (BMDCs) treated with LPS (0.25 mg/mL) for 4 h, washed and treated with ATP (left) or nigericine (Nig) (right). IL-1b in culture supernatants was determined by ELISA. One experiment representative of five is shown. *p < 0.05, **p < 0.01; two-way ANOVA test.
(D) Western blot analysis of pro-IL-1b and pro-caspase-1 (lysates) or IL-1b and caspase-1 (supernatants) in WT and Tmem176b / BMDCs stimulated with LPS as in (B and C) and then treated for 90 min with 2.5 mM Nig or 0.5 mM ATP. One experiment representative of three is shown.
(E) Caspase-1 activation in WT and Tmem176b/
BMDCs treated with LPS and then exposed to 0.5 mM ATP or 2.5 mM Nig for 45 min. Cells were harvested and stained with FLICA1 reagent. One experiment representative of three is shown. *p < 0.05; two-way ANOVA test.
(F) IL-1b secretion by WT and Tmem176b/
BMDCs treated as in (E) compared with those treated with 10 mM Z-WEHD-FMK 15 min before ATP. One experiment representative of three is shown. **p < 0.01, ****p < 0.0001; two-way ANOVA test.
(G and H) Determination of IL-1b (G) and IL-18 (H) by ELISA in culture supernatants from WT, Tmem176b /
, and Tmem176b /
Casp1 /
BMDCs treated as in (E). One experiment representative of two is shown. *p < 0.05, **p < 0.01, ****p < 0.0001; two-way ANOVA test.
(I) Determination of IL-1b in culture supernatants of THP-1-differentiated macrophages expressing GFP or GFP-TMEM176B untreated or treated for 3 h with 0.25 mg/mL LPS and then for 2 h with 2.5 mM Nig. One experiment representative of four is shown. **p < 0.01, ***p < 0.001; two-way ANOVA test.
(J) Calcium determination in WT and Tmem176b/
BMDCs treated for 3 h with 0.25 mg/mL LPS and 0.5 mM ATP. Cells were loaded with Ca2+
-sensitive probe Fura-2. Emission at 340/380 nm was recorded in time-lapse experiments; 0.5 mM ATP was added when indicated by the arrow. Scale bars, 10 mm. (K) Determination of IL-1b in BMDCs exposed to the NLRP3 inflammasome activator ATP as described in (E) in the presence or absence of the intracellular Ca2+
chelator BAPTA (100 mM) or DMSO vehicle control. One experiment representative of three is shown. *p < 0.05; two-way ANOVA test. (L) Determination of IL-1b in BMDCs following inflammasome activation in the presence of control buffer (5 mM) or high K+
buffer (120 mM). One experiment representative of three is shown. *p < 0.05; two-way ANOVA test.
(M and N) Determination of IL-1b in BMDCs following inflammasome activation in the presence or absence of the Ca2+-activated K+channels blockers iberiotoxin (IbTx) in (M) or hydroxychloroquine (HCQ) in (N). One experiment representative of three is shown in each case. *p < 0.05, **p < 0.01; two-way ANOVA test. In ELISA experiments, ND stands for not detected.
Mean ± SD are shown. See alsoFigure S1.
mature caspase-1 in culture supernatants from Tmem176b / but not WT BMDCs (Figure 1D), higher doses (5 mM) of this NLRP3 activator induced cleavage of caspase-1 in WT DCs, whereas lipopolysaccharides (LPS) alone did not (Figure S1D). In agreement with this observation, flow cytometry studies using the FLICA1 reagent revealed higher caspase-1 activation in
Tmem176b / BMDCs (Figure 1E), suggesting that caspase-1 may contribute to mature IL-1b secretion by Tmem176b / BMDCs. To confirm these findings, we induced inflammasome activation in WT and Tmem176b / BMDCs in the presence or
absence of a caspase-1 inhibitor and found that IL-1b secretion was completely inhibited when caspase-1 activation was inter-rupted (Figure 1F). Moreover, IL-1b secretion was completely abrogated in Tmem176b / Casp1 / BMDCs (Figure 1G).
Thus, increased IL-1b secretion observed as a result of
Tmem176b deficiency requires intact caspase-1 activity.
More-over, Tmem176b / BMDCs also secreted higher amounts of IL-18 compared with WT cells in a caspase-1-dependent manner (Figure 1H).
We then speculated that TMEM176B overexpression may impair IL-1b secretion in cells in which the inflammasome was activated. To address this issue, THP-1-differentiated macro-phages were transfected with TMEM176B/GFP or GFP alone (Figure S1E) and then treated with LPS and nigericin. TMEM176B overexpression impaired IL-1b secretion compared with GFP-expressing cells (Figure 1I); this effect was not associated with increased cell death (Figure S1F). Thus, cation channel TMEM176B inhibits activation of the NLRP3 inflammasome. On the other hand, TMEM176B expression in BMDCs appears to be modulated, at least in part, by inflammasome activation (Fig-ure S1G), suggesting bidirectional regulation of these pathways. Of note, lower TMEM176B expression was not associated with widespread inhibition of inflammatory mediators (Figure S1G) or with increased cell death (Figure S1H) in inflammasome-stimu-lated BMDCs.
TMEM176B Inhibits the Inflammasome through the Control of Cytosolic Ca2+
TMEM176B is an endophagosomal non-selective monovalent cation channel (Segovia et al., 2014). Because the NLRP3 inflam-masome is tightly regulated by cytosolic K+ (Mun˜oz-Planillo
et al., 2013) and Ca2+(Murakami et al., 2012) levels, we specu-lated that TMEM176B may inhibit inflammasome activation through the regulation of ion homeostasis. To address this ques-tion, we first determined cytosolic Ca2+ levels in WT and
Tmem176b / BMDCs stimulated with ATP. BMDCs lacking
Tmem176b showed greater cytosolic Ca2+as compared with WT BMDCs (Figure 1J). Interestingly, intracellular Ca2+chelation
completely blocked IL-1b secretion in WT and Tmem176b / BMDCs (Figure 1K). This effect was also dependent on K+efflux in WT and Tmem176b / BMDCs (Figure 1L).
We recently showed that Ca2+-activated K+ channels are involved in ATP-triggered inflammasome activation (Schroeder et al., 2017). We therefore inhibited Ca2+-activated K+channels in ATP-treated WT and Tmem176b / BMDCs and determined
the amounts of IL-1b in culture supernatants. Inhibition of channel function using iberiotoxin or hydroxychloroquine (Schroeder et al., 2017) led to dose-dependent reduction in IL-1b secretion by WT BMDCs. Interestingly, IL-1b secretion
by Tmem176b / BMDCs was completely abrogated by both inhibitors at doses that partially inhibited IL-1b secretion in WT BMDCs (Figures 1M and 1N). Thus, heightened inflamma-some activation in Tmem176b / BMDCs is highly dependent on Ca2+-activated K+ channels. These results suggest that
TMEM176B impairs ATP-induced cytosolic Ca2+accumulation, preventing Ca2+-dependent K+channel-driven inflammasome activation.
Lack of Tmem176b Restrains Tumor Growth in an IL-1b-and Caspase-1-Dependent Manner
To investigate whether TMEM176B-mediated regulation of in-flammasome activation may influence antitumor immunity, we first examined the relevance of TMEM176B expression in human cancer. High stromal TMEM176B expression in colon can-cer was associated with significantly lower overall patient survival (Figures S2A and S2B). Moreover, we detected a striking negative correlation between TMEM176B and NLRP3/IL1B expression from single-cell RNA sequencing analysis in macrophages infil-trating human melanoma (data analyzed from Jerby-Arnon et al., 2018), suggesting a role for this axis in the tumor micro-environment (Figure S2C). Accordingly, Tmem176b / mice inoculated with MC38 (colon), LL/2 (LLC1; lung), or EG7 (thymic lymphoma) cell lines showed higher survival (Figure 2A) and reduced tumor growth (Figure S2D) compared with WT mice. Although TMEM176B is expressed by the three tumor cell lines studied (Figure S2E), immune cells from tumor-bearing
Tmem176b / animals did not show enhanced in vivo cytotoxicity
against WT cells compared with tumor-bearing Tmem176b+/+ mice (Figure S2F), suggesting that tumor-associated TMEM176B is not immunogenic in Tmem176b / hosts.
To investigate the mechanisms underlying TMEM176B contri-bution to tumor growth, we studied inflammasome activation and found no differences in caspase-1 activation in tumors devel-oped in WT and Tmem176b / mice (Figure S2G). However, we found increased caspase-1 activation in tumor-draining lymph nodes (TDLN) from Tmem176b / mice compared with WT
ani-mals (Figures 2B–2E). Moreover, flow cytometry analysis revealed augmented caspase-1 activation in resident CD11chi MHC II+
CD11b+classical DCs (cDCs) in TDLN from Tmem176b / versus WT tumor-bearing mice (Figures 2F, 2G, andS2H). Migratory and resident cDCs were discriminated based on CD11c and MHC II expression (Figure S2H) as described (Laoui et al., 2016). Interest-ingly, CD11chiMHC II+CD11b+cDCs expressed considerable
amounts of TMEM176B (Crozat et al., 2011) and TDLN contained higher frequency of CD11b+TMEM176B+cells compared with
lymph nodes from naive animals (Figure S2I).
Since CD11b+cDCs induce differentiation of Th17 cells (Durai
and Murphy, 2016), we speculated that this CD4+T cell subset may augment in TDLN from Tmem176b / mice. We observed increased frequency of TCRb+ CD4+ RORgt+ cells in TDLN from Tmem176b / animals compared with WT and anti-IL-1b-treated Tmem176b / mice (Figure S2J). Moreover, in vitro
re-stimulation of TDLN cells with ovalbumin (OVA) showed increased proportion of IL-17+CD4+T cells in Tmem176b /
compared with WT mice (Figure S2K), and in vivo IL-17A blockade showed a clear trend toward suppression of the anti-tumor effect in anti-tumor-bearing Tmem176b / mice (Figure S2L). Thus, Tmem176b deficiency is associated with an enhanced
A B D C F H K I L E G J M
frequency of functional TCRb+CD4+RORgt+IL-17+T cells in an inflammasome-dependent manner.
To study whether increased inflammasome activation could be responsible for tumor control in mice lacking Tmem176b, we blocked IL-1b and studied EG7 tumor development. Treatment with anti-IL-1b-neutralizing antibodies, but not with control immu-noglobulin G, eliminated the antitumor activity displayed by
Tmem176b / mice (Figure 2H). This effect was also verified in
Tmem176b / Casp1 / DKO mice (Figure 2I). These results sug-gest that diminished tumor growth observed in Tmem176b /
mice depends on inflammasome activation.
To further examine the cellular effectors involved in tumor growth inhibition in Tmem176b / mice, we analyzed a panel of immunological mediators by qRT-PCR and found no differences between tumors grown in WT or Tmem176b / mice (Figure S3A). Moreover, we did not find significant changes in the percentage or absolute number of infiltrating myeloid, B, NK, NKT, or CD4+ T cells between WT and Tmem176b / tumors (Figure S3B). How-ever, the percentage of total CD8+T cells within tumor infiltrates,
as well as the absolute number of total and tumor-specific CD8+ T cells, was considerably increased in tumors grown in
Tmem176b / mice compared with those developed in WT mice (Figures S4A and S4B). Although the absolute number of CD4+ CD25+ Foxp3+ regulatory T (Treg) cells was higher in tumors developed in Tmem176b / versus WT animals, an increased effector T cell (CD8)/Treg (Foxp3) ratio was apparent (Figure S4C). Moreover, tumor-infiltrating CD8+ T cells from
Tmem176b / mice showed greater proliferation compared
with those obtained from WT animals when re-stimulated in vitro with OVA MHC I peptide (Figure S4D). Interestingly, we found downregulation of the Treg-related molecules Foxp3, CTLA-4, CCL5, CCL19, and CCL22 in TDLN from Tmem176b / versus WT mice (Figure S3A). Moreover, decreased percentages but not absolute numbers of TCRb+CD4+Foxp3+Treg cells were observed in TDLN from Tmem176b / versus WT mice, and
the CD8/Treg ratio in TDLN was significantly increased in
Tmem176b / mice (Figures S5A and B). In vivo, MHC I-depen-dent CD8+T cell-mediated cytotoxicity against OVA-expressing
cells was increased in tumor-bearing Tmem176b / compared with WT mice (Figures 2J andS5C). This effect was prevented in
Tmem176b / animals treated with anti-IL-1b antibodies (Fig-ure 2K) as well as in Tmem176b / Casp1 / animals (Figure 2L). Within the tumor microenvironment, CTLs from Tmem176b /
Casp1 / animals expressed lower levels of the degranulation marker CD107a than those from Tmem176b / mice (Figure S5D).
Interestingly, depletion of CTLs in Tmem176b / mice using an anti-CD8 antibody increased tumor growth to similar levels as those observed in WT mice (Figure 2M). Thus, Tmem176b deletion enhances CTL-mediated tumor control through mechanisms involving the caspase-1/IL-1b pathway. This mechanism is associated with inflammasome-dependent induction of TCRb+ CD4+RORgt+cells. Altogether, these results support a role for TMEM176B as an emerging immune checkpoint that interrupts in-flammasome activation and links innate and adaptive antitumor responses.
Inflammasome Activation Reinforces Immune Checkpoint Blockade Therapies
Given the influence of Tmem176b deletion in antitumor immu-nity, we investigated whether targeting this ion channel might control the efficacy of immune checkpoint blockade. We found increased survival of Tmem176b / compared with WT tumor-bearing mice following treatment with anti-CTLA-4 monoclonal antibody (mAb) (Figure 3A). This effect was dependent on inflam-masome activation, as it was abrogated in Tmem176b /
Casp1 / animals (Figure 3A). To investigate this further, we in-jected anti-CTLA-4 or anti-PD-1 mAb in EG7 tumor-bearing Casp1/11 / or Nlrp3 / mice. Lack of Casp1/11 eliminated the antitumor effects triggered by CTLA-4 or PD-1 blockade (Fig-ure 3B). Although the experiments performed in Nlrp3 / mice
Figure 2. Mice LackingTmem176b Control Tumor Growth through an IL-1b- and caspase-1-Dependent Manner
(A) Survival of WT and Tmem176b /
mice injected subcutaneously with MC38 colon cancer cells (13 106
; left graph), LL2 lung cancer cells (13 105
; central graph), or EG7 thymic lymphoma cells (13 106
; right graph). Mice survival was monitored every 3 days. The ratio shows the number of surviving animals/total injected mice from three experiments. *p < 0.05, **p < 0.01; log rank (Mantel-Cox) test.
(B and C) Western blot analysis (B) and semiquantification (C) of pro-caspase-1 and caspase-1 expression in tumor-draining lymph nodes (TDLN) from WT and
Tmem176b / mice. At least four animals/group are shown. *p < 0.05; Student’s t test.
(D and E) Confocal microscopy (D) and semiquantification (E) of activated caspase-1 expression using the FLICA1 fluorescent probe in TDLN. Scale bars, 10 mm. n = 3 each group. *p < 0.05, ***p < 0.001; one-way ANOVA test.
(F) Flow cytometry analysis of FLICA1+
cells within TDLN. SSC, Side scatter. One experiment representative of two is shown. (G) Evaluation of FLICA1+
CD11b+
and CD11b classical DCs (cDCs) in TDLN is shown. ns, not significant; ***p < 0.001; Student’s t test.
(H) Survival of Tmem176b/ EG7 tumor-bearing mice treated with anti-IL-1b or control immunoglobulin G (IgG) antibodies. The ratio shows the number of surviving animals/total injected mice from one experiment. *p < 0.05; log rank (Mantel-Cox) test.
(I) Survival of untreated Tmem176b /
and Tmem176b /
Casp1 /
EG7 tumor-bearing mice. The ratio shows the number of surviving animals/total injected mice pooled from three independent experiments. *p < 0.05; log rank (Mantel-Cox) test.
(J) In vivo cytotoxicity against OVA-expressing cells in WT and Tmem176b /
EG7 tumor-bearing mice. Data from four different animals and one experiment in each group are shown. **p < 0.01; Student’s t test.
(K) In vivo cytotoxicity against OVA-expressing cells in EG7 tumor-bearing Tmem176b /
mice treated with anti-IL-1b neutralizing or control IgG antibodies. *p < 0.05; Student’s t test.
(L) In vivo cytotoxicity against OVA-expressing cells in tumor-bearing Tmem176b/
versus Tmem176b /
Casp1 /
mice. Data from two experiments are shown. *p < 0.05; Student’s t test.
(M) Survival of tumor-bearing WT and Tmem176b / mice left untreated or treated with anti-CD8 depleting antibodies. The ratio depicts the number of surviving animals/total injected mice. Data from one experiment are shown. *p < 0.05; log rank (Mantel-Cox) test.
The genetic background of the animals used was C57BL/6. Mean ± SD are shown.
did not reach statistical significance, there was a trend toward lower survival in those mice when treated with anti-CTLA-4 or anti-PD-1 mAb (Figure 3C). Moreover, we found no differences in tumor growth in mice lacking inflammasome components un-der control conditions (Figures 3B and 3C), in agreement with previous reports (Ghiringhelli et al., 2009). These results highlight the importance of triggering inflammasome activation to improve the efficacy of checkpoint blockade therapies.
Sensitivity to Immune Checkpoint Blockers Is Associated with an ‘‘Inflammasome-Activated’’ Signature in Cancer Patients
We then investigated whether inflammasome-related genes might be associated with clinical responses in patients treated with immune checkpoint blockers. First, we analyzed whole-exome sequencing and transcriptomics data from a cohort of melanoma patients treated with immune checkpoint inhibitors (Riaz et al., 2017). These studies focused on pre-treatment and
on-treatment tumor biopsies from patients receiving anti-PD-1 mAb after progression from anti-CTLA-4 therapy (IPI-progress-ing) and patients treated with PD-1 without previous anti-CTLA-4 treatment (IPI-naive). In non-responding patients of the IPI-naive population, only two inflammasome-related genes—
TMEM176A and TMEM176B—were significantly upregulated
during treatment compared with pre-treatment (Figure 4A;Table S1). These observations emphasize the role of TMEM176 ionic channels as potential mediators of resistance to checkpoint blockade therapies.
Interestingly, when comparing patients responding or not to anti-PD-1 at the pre-treatment stage, we found no significant differences in inflammasome-related genes in the entire popu-lation (Table S2), or in the IPI-naive (Table S3) or IPI-progressed (Table S4) groups. However, eight inflammasome-related genes were significantly upregulated in responders versus non-responders in the entire population during anti-PD-1 treat-ment (Figure 4B). TMEM176A and TMEM176B were two of the
A B C 0 20 40 60 0 20 40 60 80 100 WT + Ctrl IgG 0/5 Nlrp3-/-+ Ctrl IgG 1/5
Days after tumor inoculation
Percent su rviva l ns 0 20 40 60 0 20 40 60 80 100 WT + anti-CTLA-4 2/13 Casp1/11-/-+ anti-CTLA-4 0/15
Days after tumor inoculation
Percent su rviva l * 0 20 40 60 0 20 40 60 80 100 Ctrl IgG 0/9 anti-CTLA-4 2/9
Days after tumor inoculation
Percent su rviva l ns 0 20 40 60 0 20 40 60 80 100 Ctrl IgG 1/9 anti-CTLA-4 7/10
Days after tumor inoculation
Percent su rviva l * 0 20 40 60 0 20 40 60 80 100 anti-CTLA-4 4/15 Ctrl IgG 1/10
Days after tumor inoculation
Percent su rviva l ns 0 20 40 60 0 20 40 60 80 100 WT 0/6 Casp1/11-/-0/6
Days after tumor inoculation
Percent su rviva l ns 0 20 40 60 0 20 40 60 80 100 WT + anti-CTLA-4 5/14 Nlrp3-/-+ anti-CTLA-4 3/15
Days after tumor inoculation
Percent su rviva l ns 0 20 40 60 0 20 40 60 80 100 WT + anti-PD-1 1/6 Nlrp3-/-+ anti-PD-1 0/6
Days after tumor inoculation
Percent su rviva l ns 0 20 40 60 0 20 40 60 80 100 WT + anti-PD-1 3/10 Casp1/11-/-+ anti-PD-1 1/10
Days after tumor inoculation
Percent su
rviva
l
* WT Tmem176b-/- Tmem176b-/-Casp1
-/-Control Anti-CTLA-4
Control Anti-CTLA-4 Anti-PD-1
Anti-PD-1
Figure 3. Inflammasome Activation Reinforces Immune Checkpoint Blockade
(A) Survival of WT, Tmem176b/
, and Tmem176b /
Casp1 /
mice inoculated with EG7 tumor cells and receiving anti-CTLA-4 or control IgG antibodies. *p < 0.05; log rank (Mantel-Cox) test.
(B and C) Survival of WT and Casp1/11 /
(B) or Nlrp3 /
(C) mice inoculated with EG7 tumor cells and injected with control IgG, anti-CTLA-4, or anti-PD-1 antibodies. ns, not significant; *p < 0.05; log rank (Mantel-Cox) test.
F PKM Pre-Treatment On-Treatment 0 20 40 60 80 * TMEM176B F PKM Pre-Treatment On-Treatment 0 20 40 60 80 * TMEM176A A F A b so lu te score (C D 8 + T ce lls ) 0.0 0.2 0.4 0.6 0 2 4 6 8 NLRP3 FPKM r = 0.4385 p = 0.0009 A b so lu te score (A ct iv at ed m e m o ry CD 4 + T ce lls ) 0.0 0.1 0.2 0.3 0 2 4 6 8 NLRP3 FPKM r = 0.5421 p = 0.0001 A b so lu te score (t otal l e uk ocytes ) 0 1 2 3 0 2 4 6 8 NLRP3 FPKM r = 0.8346 p = 0.0001 C B D E
Non-activated memory CD4+ T cells
R e la tiv e f re q u e n c y am o n g l eu k o c yte s Pre-Treatment On-Treatment 0.0 0.1 0.2 0.3 **
Activated memory CD4+ T cells
R e la tiv e f re q u e n c y a m ong l e ukocyt es Pre-Treatment On-Treatment 0.00 0.05 0.10 0.15 0.20 * CD8+ T cells R e lat ive f re quen c y a m ong l e ukocyt es Pre-Treatment On-Treatment 0.0 0.1 0.2 0.3 0.4 ** Total leukocytes Ab sol u te sco re Pre-Treatment On-Treatment 0 1 2 3 *
Activated memory CD4+ T cells
A b so lu te score Pre-Treatment On-Treatment 0.0 0.1 0.2 0.3 ** CD8+ T cells Absol u te score Pre-Treatment On-Treatment 0.0 0.2 0.4 0.6 0.8 **
Figure 4. Analysis of the Inflammasome Signature in Tumor Biopsies from Melanoma Patients Treated with Immune Checkpoint Blockers
(A) Paired analysis comparing pre-treatment versus on-treatment melanoma biopsies of patients who did not respond to anti-PD-1 therapy and were not treated previously with anti-CTLA-4 antibody (IPI-naive). *p < 0.05; paired Student’s t test.
(B) Heatmaps of transcriptome analysis from tumor biopsies of melanoma patients responding (responders) or not (non-responders) to anti-PD-1 therapy. *p < 0.05; unpaired Student’s t test.
(C) Paired analysis comparing pre-treatment versus on-treatment melanoma biopsies of patients responding to anti-PD-1 therapy. The indicated inflammasome-related genes were significantly upregulated during therapy. p < 0.05; paired Student’s t test.
inflammasome-related genes that were significantly upregu-lated in patients responding to anti-PD-1, suggesting that they could function as a counter-regulatory mechanism in response to treatment. Similar findings were observed in the IPI-naive population (Table S5). We then performed a paired analysis of tumor biopsies comparing pre-treatment and on anti-PD-1 treatment from responding patients. We found 11 inflammasome-related genes that were significantly upregu-lated during anti-PD-1 therapy compared with pre-treatment biopsies (Figure 4C). Similar results were found when analyzing the IPI-naive population (Table S6).
We then estimated the diversity of leukocyte populations infil-trating tumors using the CIBERSORT method (Newman et al., 2015). We observed increased relative frequencies of CD8+
T cells and activated memory CD4+ T cells during anti-PD-1 treatment versus pre-treatment in responders but not in progres-sors (Figure 4D). Absolute number of leukocytes, CD8+T cells, and activated memory CD4+T cells were also increased (Fig-ure 4E). In patients responding to anti-PD-1 therapy, the total number of leukocytes, as well as the frequency of CD8+T cells and activated memory CD4+T cells, were positively associated
with expression of NLRP3 during ongoing treatment (Figure 4F). These observations reinforce the concept that inflammasome activation controls T cell immunity in patients treated with immune checkpoint blockers.
To validate further these observations, we analyzed the inflammasome gene expression profile in longitudinal tumor biopsies from melanoma patients treated sequentially with anti-CTLA-4 and anti-PD-1 mAb (Chen et al., 2016). These authors studied gene expression profiling (GEP) via a custom 795-gene panel composed of immune and cancer-related genes which did not include TMEM176A and TMEM176B. The authors found no significant differences in GEP when comparing responders versus progressors before anti-CTLA-4 or anti-PD-1 therapy. Consistently, we found no significant expression of inflammasome-related genes at these stages (Figures S6A, S6B,S7A, and S7B). These results are in agree-ment with our findings from the analysis of the Riaz et al. cohort at the pre-treatment stage (Tables S1–S4). However, the au-thors found 411 genes that were significantly regulated (mostly upregulated) in responders versus progressors following PD-1 blockade. In those patients, 15/16 inflammasome-related genes were significantly upregulated in responders compared with progressors (Figure 5A). We then performed a paired analysis of the 16 inflammasome-related genes in biopsies of 5 re-sponders and 7 progressors comparing gene expression profiles before and during anti-PD-1 therapy. All these patients had progressed to anti-CTLA-4 therapy. Critically, 5/5 patients responding to anti-PD-1 mAb showed a significant upregulation of inflammasome-related genes during anti-PD-1 treatment (Figure 5B). Moreover, 4/7 patients who did not respond to anti-PD-1 therapy significantly downregulated the inflamma-some signature during PD-1 blockade (Figure 5B).
Thus, gene expression profiles from biopsies of two indepen-dent cohorts of melanoma patients treated with immune checkpoint blockers revealed strong association between in-flammasome activation and clinical responses. These findings support the notion that inflammasome activation contributes to antitumor responses triggered by immune checkpoint blockers and highlights the value of an ‘‘inflammasome activa-tion’’ signature as a potential biomarker of response to immune checkpoint blockade.
Pharmacologic Inhibition of TMEM176B Triggers Inflammasome-Dependent Tumor Control and Improves the Efficacy of Immune Checkpoint Blockers
To identify compounds capable of improving the efficacy of im-mune checkpoint blockers by inhibiting TMEM176B-dependent ion flux and triggering inflammasome activation, we set up an
in vitro assay. In brief, CHO-7 cells were transfected with
TMEM176B- and TMEM176A-mCherry. Cells were then loaded with the Na+-sensitive fluorescent dye Asante NaTRIUM Green 2
(ANG-2). We observed increased ANG-2 mean fluorescence in-tensity in mCherry+compared with mCherry cells (Figure 6A).
We then screened a library of compounds known to modulate ion channel activity (Data S1). We found that both enantiomers of BayK8644 potently inhibited TMEM176B-A-dependent Na+ influx, while they minimally affected TMEM176B-A-negative cells (Figures 6A, 6B, andS8A), thus prompting the study of these compounds. Whereas (+) BayK8644 is known to inhibit L-type voltage-dependent Ca2+channels, the ( ) stereoisomer
activates those channels (Hamilton et al., 1987). Since both isomers inhibit TMEM176B/A activity, it is unlikely that our observations could be explained by their effects on Na+influx through the modulation of Ca2+channels. In electrophysiology studies using TMEM176B-overexpressing Xenopus oocytes, (+) BayK8644 completely inhibited TMEM176B-dependent current (Figure 6B). Therefore, we focused on the (+) isomer for func-tional experiments.
We found that BayK8644 induced IL-1b secretion and cas-pase-1 activation in LPS-primed WT but not in Tmem176b / BMDCs (Figures 6C andS8B–S8D). Interestingly, BayK8644-induced IL-1b secretion was inhibited by the Ca2+-activated K+channel (KCa) inhibitors tetraethylammonium and hydroxy-chloroquine (Figure 6D). Thus, BayK8644 treatment on WT BMDCs phenocopied Tmem176b deficiency. In THP-1-differ-entiated macrophages, TMEM176B-dependent inhibition of IL-1b secretion was prevented when these cells were treated with BayK8644 (Figure 6E). These results suggest that BayK8644 triggers inflammasome activation through inhibition of TMEM176B.
We then explored whether BayK8644 treatment may control tumor growth in vivo. Administration of BayK8644 significantly increased survival of tumor-bearing WT but not Tmem176b /
mice (Figure 6F) compared with injection of vehicle control. Of note, in vitro treatment of EG7 thymic lymphoma cells with
(D and E) Paired study of the relative frequency (D) and absolute number (E) of the indicated cell populations between pre-treatment versus on-treatment tumor biopsies from total patients responding to anti-PD-1 therapy analyzed by the CIBERSORT method. *p < 0.05, **p < 0.01; paired Student’s t test.
(F) Association of NLRP3 expression with the frequency of total leukocytes, CD8+T cells and activated memory CD4+T cells in patients responding to anti-PD-1 therapy. Results show transcriptomics data obtained from tumor biopsies at the on-treatment stage.
Patient 2 Progressor lo g 2 -t ra n s fo rm e d nor m a lize d Nano Str ing counts Pre-Treatment On-Treatment 0 5 10 15 * Patient 4 Progressor lo g 2 -t ra n s fo rm e d nor m a lize d Nano Str ing counts Pre-Treatment On-Treatment 0 5 10 15 **** Patient 16 Progressor lo g 2 -t ra n s fo rm e d nor m a lize d Nano Str ing counts Pre-Treatment On-Treatment 0 5 10 15 Patient 9 Responder log2 -t ransf or m ed nor m a lize d Nano Str ing counts Pre-Treatment On-Treatment 0 5 10 15 *** Patient 24 Responder log2 -t ransf or m ed nor m a lize d Nano Str ing counts Pre-Treatment On-Treatment 0 5 10 15 **** Patient 47 Responder log2 -t ransf or m ed nor m al iz e d Nano Str ing counts Pre-Treatment On-Treatment 0 5 10 15 * Patient 7 Responder log2 -t ransf or m ed nor m a lize d Nano Str ing counts Pre-Treatment On-Treatment 0 5 10 15 *** Patient 43 Progressor lo g 2 -t ra n s fo rm e d nor m a lize d Nano Str ing counts Pre-Treatment On-Treatment 0 2 4 6 8 10 * Patient 49 Progressor lo g 2 -t ra n s fo rm e d nor m a lize d Nano Str ing counts Pre-Treatment On-Treatment 0 5 10 15 Patient 50 Progressor log2 -t ransf or m ed nor m a lize d Nano Str ing counts Pre-Treatment On-Treatment 0 5 10 15 Patient 19 Progressor lo g 2 -t ra n s fo rm e d nor m a lize d Nano Str ing counts Pre-Treatment On-Treatment 0 5 10 15 * Patient 3 Responder log2 -t ransf or m ed nor m a lize d Nano Str ing counts Pre-Treatment On-Treatment 0 5 10 15 *** NLRP3 log2 -t ransf or m ed nor m a lize d Nano Str ing counts Responders Progressors 0 2 4 6 8 10 ** NLRP6 log2 -t ransf or m ed n o rm a liz e d Nano Str ing counts Responders Progressors 0 2 4 6 8 10 *** NLRP7 log2 -t ransf or m ed nor m al iz e d Nano Str ing counts Responders Progressors 0 2 4 6 8 10 **** AIM2 log2 -t ransf or m ed n o rm a liz e d Nano Str ing counts Responders Progressors 0 2 4 6 8 10 12 ** PYCARD log2 -t ransf or m ed nor m a lize d Nano Str ing counts Responders Progressors 0 2 4 6 8 10 * CASP1 lo g 2 -t ra n s fo rm e d nor m al iz e d Nano Str ing counts Responders Progressors 0 5 10 15 * IL1B log2 -t ransf or m ed nor m a lize d Nano Str ing counts Responders Progressors 0 2 4 6 8 10 12 14 IL1A log2 -t ransf or m ed nor m al iz e d Nano Str ing counts Responders Progressors 0 2 4 6 8 * IL1R1 log2 -t ransf or m ed nor m a lize d Nano Str ing counts Responders Progressors 0 2 4 6 8 10 12 ** IL1R2 log2 -t ransf or m ed nor m a lize d Nano Str ing counts Responders Progressors 0 2 4 6 8 10 **** IL1RN log2 -t ransf or m ed nor m a lize d Nano Str ing counts Responders Progressors 0 2 4 6 8 10 12 ** IL17F log2 -t ransf or m ed nor m a lize d Nano Str ing counts Responders Progressors 0 2 4 6 8 10 ** IL18 log2 -t ransf or m ed nor m al iz e d Nano Str ing counts Responders Progressors 0 2 4 6 8 10 12 14 *** IL18R1 log2 -t ransf or m ed n o rm a liz e d Nano Str ing counts Responders Progressors 0 2 4 6 8 10 ** IL18RAP log2 -t ransf or m ed n o rm a liz e d Nano Str ing counts Responders Progressors 0 2 4 6 8 10 **** IL18BP log2 -t ransf or m ed n o rm a liz e d Nano Str ing counts Responders Progressors 0 2 4 6 8 10 **** A B NLRP3 CASP1 PYCARD IL1B IL1A IL18 IL1R1 IL1RN IL18RAP IL1R2 IL18R1 IL18BP AIM2 IL17F NLRP6 NLRP7
BayK8644 did not induce apoptosis at similar doses as those de-tected in plasma after intraperitoneal injection (Figure S8E). To explore whether BayK8644 recapitulated the effects in tumor growth control observed in untreated Tmem176b / mice, we evaluated its influence on inflammasome activation by disrupting important components of this pathway. We found that BayK8644 significantly improved survival of WT but not Casp1/11 / tu-mor-bearing mice (Figure 6G). Consistent with this observation, BayK8644 increased the frequency of CD11b+cDCs expressing active caspase-1 in TDLN (Figure 6H). Moreover, BayK8644-induced tumor control was mediated by CD8+ T cells as it increased CD8+T cell-dependent tumor cytotoxicity in vivo
(Fig-ure 6I), and depletion of CD8+T cells completely abolished the antitumor effect of this inhibitor (Figures 6J and S8F). Thus, BayK8644 restrains EG7 tumor growth in a TMEM176B-, cas-pase-1/11-, and CD8+T cell-dependent manner, phenocopying
Tmem176b / mice. Moreover, BayK8644 significantly impaired growth of CT26 colon cancer cells in BALB/c mice (Figures S8G and S8H). Thus, BayK8644 emerges as an immunotherapeutic agent that limits tumor growth by licensing inflammasome activation.
Finally, we evaluated whether BayK8644 administration may enhance the antitumor activity of immune checkpoint blockers. Compared with mice receiving monotherapy, administration of BayK8644 in combination with anti-CTLA-4 mAb significantly improved survival of EG7 tumor-bearing mice (Figure 6K). More-over, therapeutic administration of BayK8644 in mice with es-tablished tumors significantly improved the antitumoral effect of anti-PD-1 treatment (Figure 6L), whereas BayK8644 mono-therapy was not effective in this therapeutic protocol (data not shown). Interestingly, combination of anti-PD-1 with BayK8644 was associated with an increased absolute number and per-centage of TCRb+CD4+RORgt+T cells in TDLN (Figure S8I) and increased frequency of tumor-specific CD8+T cells within the tumor microenvironment (Figure 6M) compared with anti-PD-1 monotherapy. Depletion of CD8+T cells in mice treated with anti-PD-1 plus BayK8644 abrogated antitumor immunity (Figure 6N). This observation might be explained by concomitant CTL-mediated mechanisms required for both the antitumor activity of BayK8644 (Figures 6J andS8F) and anti-PD-1 mAb (Sharma and Allison, 2015). Thus, as expected, combination treatment strongly relies on the CD8+ T cell compartment.
Furthermore, BayK8644 significantly enhanced the antitumoral effect of anti-PD-1 therapy in mice bearing 5555 melanoma (Fig-ure 6O), whereas this effect was apparent in LL/2 lung cancer (Figures S8J and S8K) and MC38 colon cancer (Figures S8L and S8M) models, albeit not reaching statistical significance. Moreover, whereas BayK8644 reinforced the antitumor effects of anti-PD-1 treatment in mouse melanoma, it did not enhance tumor growth inhibition induced by anti-CTLA-4 and anti-PD-1
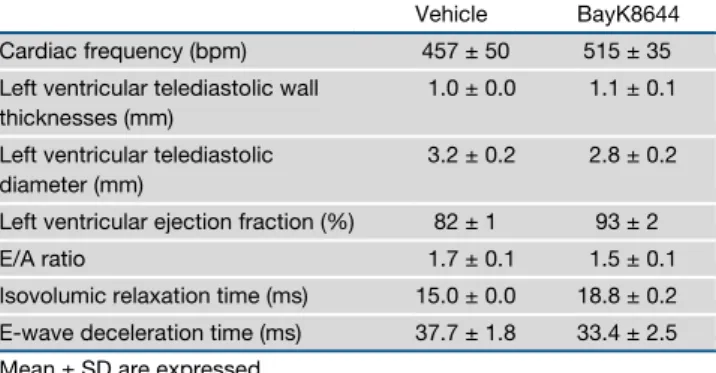
combination therapy, at least in this model (Figure S8O). Given the pharmacologic impact of channel inhibitors in cardiomyo-cyte function, we finally examined whether BayK8644 may lead to acute cardiac toxicity. Notably, BayK8644 treatment was not associated with electrocardiographic nor echocardio-graphic alterations 30 min after intravenous injection compared with mice treated with vehicle control (Tables 1and 2). Thus, pharmacological inhibition of TMEM176B represents a potential therapeutic approach to unleash inflammasome activation, leading to potentiation of CD8+ T cell-dependent antitumor
immunity.
DISCUSSION
In this study, we demonstrate a central role of the inflamma-some in reinforcing CD8+T cell-dependent antitumor immunity and enhancing the efficacy of checkpoint blockade therapies. In particular, we demonstrate a key role of TMEM176B as nega-tive regulator of inflammasome activation. Whereas most immunotherapeutic modalities have focused on drugs targeting adaptive components of the immune system, innate immune pathways may represent additional anticancer targets (Woo et al., 2014).
Although recently proposed to play a role in immunotherapy (Mangan et al., 2018), the direct contribution of IL-1b/IL-18 in-flammasomes to antitumor immunity and adaptive checkpoint blockade remains elusive (Karki et al., 2017). Here we identify a therapeutic strategy that reinforces antitumor responses by targeting TMEM176B and promoting inflammasome disinhibi-tion. Our results suggest that inflammasome activation plays a central role in antitumor immunity triggered by anti-CTLA-4 and anti-PD-1 mAb. Although experiments in Nlrp3 / animals did not reach statistical significance, studies in animals lacking the downstream effectors Casp1/11 did. These observations suggest that different inflammasomes could mediate the antitu-moral effect triggered by anti-CTLA-4 and anti-PD-1 therapies. Accordingly, analysis of anti-PD-1-treated melanoma patients suggested that NLRP6, NLRP7, AIM2, and NLRC4 inflamma-somes might contribute to antitumor responses unleashed by checkpoint blockers. Although the requirement of caspase-1 autoproteolysis can differ among different inflammasomes (Broz et al., 2010), and caspase-1 may cleave other proteins than IL-1b and IL-18 (Sokolovska et al., 2013), to our knowl-edge, caspase-1/11 activation mostly depends on inflamma-somes. Thus, it is unlikely that observations in Casp1/11 / and Tmem176b / Casp1 / mice could involve
inflamma-some-independent mechanisms.
Our results suggest that TMEM176B might be a predictive marker of response to anti-PD-1 therapy. In addition, TMEM176B expression in the tumor stroma was associated with poor survival
Figure 5. Analysis of the Inflammasome Signature in Tumor Biopsies from Melanoma Patients Treated with Immune Checkpoint Blockers
(A) Log2-transformed normalized NanoString counts for the indicated inflammasome-related genes in melanoma tumor biopsies from patients being treated with anti-PD-1 mAb. The results for responding and non-responding patients as defined byChen et al. (2016). Mean ± SD are shown. *p < 0.05, **p < 0.01, ***p < 0.001, ****p < 0.0001; unpaired Student’s t test.
(B) Paired analysis of the 16 inflammasome-related genes studied in (A) comparing pre-treatment and on-treatment tumor biopsies from melanoma patients responding (n = 5) or not responding (n = 7) to anti-PD-1 therapy. *p < 0.05, ***p < 0.001, ****p < 0.0001; paired Student’s t test.
A B C D E F G H I J K L M N O
in colorectal cancer patients, suggesting a potential role of this ion channel as a prognostic factor. Interestingly, TMEM176B was associated with diminished NLRP3 and IL1B expression in macrophages infiltrating human melanoma, suggesting that this ion channel may function as an innate checkpoint signal that hinders immune responses in the tumor microenvironment. How-ever, our results in experimental models support a key role for TMEM176B in the modulation of inflammasome activation mostly in TDLN during the induction phase of antitumor responses. Thus, TMEM176B-dependent immune inhibitory mechanisms may operate within the tumor microenvironment and TDLN.
Sustained K+efflux through the voltage-gated (K
v1.3) or Ca2+
-activated (KCa3.1) K+channels has been shown to reinvigorate tumor-infiltrating T cells (Eil et al., 2016). The results presented here suggest that Ca2+-induced K+efflux in DCs may promote antitumor immunity by triggering inflammasome activation, a process that is repressed by TMEM176B.
In conclusion, our study links inflammasome activation to anti-tumor responses triggered by immune checkpoint blockers, highlighting a central role for TMEM176B, an ion channel ex-pressed on myeloid cells, in repression of T cell-dependent im-munity. Further efforts should be aimed at evaluating the clinical
Figure 6. Targeting TMEM176B with BayK8644 Triggers Inflammasome-Dependent Antitumor Immunity
(A) TMEM176B activity in CHO-7 cells treated or not with BayK8644. Representative flow cytometry histograms displaying ANG-2 fluorescence at the indicated conditions (left) and quantification of ANG-2 mean fluorescence intensity (MFI) (right). One experiment representative of five is shown. **p < 0.01, ***p < 0.001; two-way ANOVA test.
(B) TMEM176B-dependent conductance assessed in Xenopus oocytes following addition of 10 mM (+) BayK8644 to extracellular buffer during phorbol myristate acetate (PMA) stimulation. Representative currents (left) and determination of TMEM176B current at 800 s post-extracellular acidification (right) are shown. ***p < 0.001; one-way ANOVA test.
(C) Determination of IL-1b in culture supernatants from WT and Tmem176b /
BMDCs primed for 3 h with LPS and then treated or not with 2.5 mM BayK8644. One experiment representative of three is shown. *p < 0.05; two-way ANOVA test.
(D) Determination of IL-1b in culture supernatants from WT BMDCs primed with LPS and then treated with 10 mM BayK8644 alone or in combination with tetraethylammonium (TEA) (2 mM) or HCQ (10 mM). One experiment representative of three is shown. *p < 0.05, **p < 0.01; one-way ANOVA test.
(E) Determination of IL-1b in culture supernatants from THP-1-differentiated macrophages transfected with GFP or TMEM176B/GFP-coding plasmids and then treated or not with LPS plus nigericine (LPS/Nig) in the presence of ethanol (vehicle) or 5 mM BayK8644. To calculate the extent of TMEM176B-dependent inhibition, IL-1b levels (pg/mL) were incorporated to the formula: [GFP/LPS/Nig – GFP untreated] – TMEM176B/LPS/Nig3 100. One experiment representative of three is shown. *p < 0.05; Student’s t test.
(F and G) Survival of WT (F and G) and Tmem176b /
(F) or Casp1/11 /
(G) mice inoculated with EG7 tumor cells and treated with 1 mg/kg BayK8644 i.p. on days 2–15 after tumor cell injection. *p < 0.05, **p < 0.01; log rank (Mantel-Cox) test.
(H) Caspase-1 activation in TDLN from WT mice inoculated with EG7 tumor cells and then treated or not with 1 mg/kg BayK8644 on days 2–13. TDLN were resected 14 days after tumor injection and caspase-1 activation was studied by flow cytometry using the FLICA1 reagent. *p < 0.05; Student’s t test. (I) In vivo cytotoxicity against OVA-expressing cells in WT mice inoculated with EG7 tumor cells treated or not with BayK8644 as in (F). At day 15, in vivo cytotoxicity was determined. *p < 0.05; Student’s t test.
(J) Survival of tumor (EG7)-bearing WT mice treated with BayK8644 or vehicle control, receiving or not anti-CD8 depleting antibody. ns, not significant. WT + Vehicle versus WT + BayK8644: *p < 0.05; WT + BayK8644 versus WT + BayK8644 + anti-CD8: *p < 0.05; WT + Vehicle versus WT + BayK8644 + anti-CD8: ns; log rank (Mantel-Cox) test.
(K) Survival of tumor (EG7)-bearing WT mice treated or not with BayK8644, anti-CTLA-4 mAb, or BayK8644 plus anti-CTLA-4 mAb. ns, not significant. Untreated versus BayK8644 + anti-CTLA-4: **p < 0.01; BayK8644 versus BayK8644 + anti-CTLA-4: ns; anti-CTLA-4 versus BayK8644 + anti-CTLA-4: ns; untreated versus anti-CTLA-4: ns; untreated versus BayK8644: ns; log rank (Mantel-Cox) test.
(L) Survival of tumor (EG7)-bearing WT mice treated or not with 250 mg anti-PD-1 mAb at days 6, 9, and 12 after tumor inoculation. BayK8644 was injected every day since day 9 (when all mice had established tumors) until day 21. *p < 0.05; log rank (Mantel-Cox) test.
(M) Frequency of OVA-specific CD8+T cells as determined by flow cytometry using fluorescent MHC pentamers in EG7 tumor suspensions from WT mice treated with anti-PD-1 alone or anti-PD-1 + BayK8644 in a therapeutic protocol as in (L). *p < 0.05; unpaired Student’s t test.
(N) Survival of tumor (EG7)-bearing WT mice treated or not with BayK8644 plus anti-PD-1 mAb in the absence or presence of anti-CD8 depleting mAb. *p < 0.05; log rank (Mantel-Cox) test.
(O) Survival of WT mice inoculated with 5,555 melanoma cells and left untreated or treated either with anti-PD-1 mAb (days 6, 9, and 12), BayK8644 (days 9–21), or both. All animals had established tumors when BayK8644 treatment was started. ns, not significant. Untreated versus BayK8644 + anti-PD-1: *p < 0.05; BayK8644 versus BayK8644 + anti-PD-1: ns; anti-PD-1 versus BayK8644 + anti-PD-1: ns; untreated versus anti-PD-1: ns; untreated versus BayK8644: ns; log rank (Mantel-Cox) test.
In (F), (G), and (J–O) the ratio represents the number of surviving mice/total injected mice. For these experiments we used C57BL/6 mice. Mean ± SD are shown.
See alsoFigure S8.
Table 1. Effect of BayK8644 on Electrocardiographic Parameters
RR P wave PR QRS QT QTc
Controla 150 ± 18b 16.0 ± 0.0 32.0 ± 2.0 13.3 ± 1.2 53.3 ± 4.1 43.6 ± 0.8
Vehicle 143 ± 9 14.7 ± 0.7 32.0 ± 1.5 13.7 ± 1.8 56.0 ± 2.5 46.8 ± 0.8
Control 130 ± 2 15.2 ± 1.2 32.8 ± 1.9 11.0 ± 0.4 51.2 ± 2.7 45.1 ± 2.7
BayK8644 120 ± 5 15.4 ± 1.2 32.6 ± 1.8 11.2 ± 0.6 54.4 ± 1.9 49.7 ± 0.8
aValues before injection of vehicle control or BayK8644.
efficacy and safety of inflammasome disinhibition in the treat-ment of cancer patients, particularly those resistant to current immunotherapies.
STAR+METHODS
Detailed methods are provided in the online version of this paper and include the following:
d KEY RESOURCES TABLE
d CONTACT FOR REAGENT AND RESOURCE SHARING d EXPERIMENTAL MODELS AND SUBJECT DETAILS
B Animals
B Cell Lines
B Tumor Models and Treatments
B In Vivo Inflammasome Activation B In Vitro Inflammasome Activation
B THP-1 Transfection and Inflammasome Activation d METHOD DETAILS
B Cytosolic Ca++Determination
B In Vivo Cytotoxicity Assay
B Screening of TMEM176B Inhibitors
B Immunohistochemistry of Human Colon Microarrays
B Electrophysiology Experiments
B Quantitative RT-PCR
B Gene Expression Analysis
B CIBERSORT Analysis
B Single Cell RNA-Seq Data Analysis
B Statistical Analyses
d DATA AND SOFTWARE AVAILABILITY SUPPLEMENTAL INFORMATION
Supplemental Information can be found online athttps://doi.org/10.1016/j. ccell.2019.04.003.
ACKNOWLEDGMENTS
This work was supported by Uruguay INNOVA-2, FMV from ANII, CABBIO, PEDECIBA, ECOS-SUD AUF/FAPESP, and FOCEM (MERCOSUR Structural Convergence Fund) COF 03/11 grants to M.H., CSIC UdelaR and FCE from ANII to M.S., Harry J Lloyd Foundation to M.R.G., the Argentinean Cancer Institute to Y.D.M., Argentinean Agency for Promotion of Science and Technol-ogy to G.A.R. and M.R.G., Bunge & Born, Sales and Richard Lounsbery Foun-dations to G.A.R. and Wellcome Trust to R.A.F. We thank Sabrina Gatto for technical support.
AUTHOR CONTRIBUTIONS
Conceptualization, M.S., S.R., M.C.C., G.A.R., and M.H.; Methodology, M.S. and S.R.; Validation, R.A.F., M.C.C., B.V., M.R.G., G.A.R., and M.H.; Investiga-tion, M.S., S.R., M.J., V.P., M.D., Y.D.M., S.V., F.V., M.R.G., P.C., and M.R.; Writing – Original Draft, M.S., S.R., M.R.G., G.A.R., and M.H.; Funding Acqui-sition, M.H.; Resources, C.L., R.A.F., I.A., and M.C.C.; Supervision, M.H.
DECLARATION OF INTERESTS
M.H. is founder and CSO of ARDAN Immuno Pharma. Three patent applica-tions related to this work have been filed at the USA Patent and Trade-mark Office. Received: June 21, 2018 Revised: February 20, 2019 Accepted: April 10, 2019 Published: May 13, 2019 REFERENCES
Binnewies, M., Roberts, E.W., Kersten, K., Chan, V., Fearon, D.F., Merad, M., Coussens, L.M., Gabrilovich, D.I., Ostrand-Rosenberg, S., Hedrick, C.C., et al. (2018). Understanding the tumor immune microenvironment (TIME) for effec-tive therapy. Nat. Med. 24, 541–550.
Broz, P., von Moltke, J., Jones, J.W., Vance, R.E., and Monack, D.M. (2010). Differential requirement for caspase-1 autoproteolysis in pathogen-induced cell death and cytokine processing. Cell Host Microbe 8, 471–483.
Chen, P.-L., Roh, W., Reuben, A., Cooper, Z.A., Spencer, C.N., Prieto, P.A., Miller, J.P., Bassett, R.L., Gopalakrishnan, V., Wani, K., et al. (2016). Analysis of immune signatures in longitudinal tumor samples yields insight into biomarkers of response and mechanisms of resistance to immune check-point blockade. Cancer Discov. 6, 827–837.
Condamine, T., Le Texier, L., Howie, D., Lavault, A., Hill, M., Halary, F., Cobbold, S., Waldmann, H., Cuturi, M.-C., and Chiffoleau, E. (2010). Tmem176B and Tmem176A are associated with the immature state of den-dritic cells. J. Leukoc. Biol. 88, 507–515.
Crozat, K., Tamoutounour, S., Vu Manh, T.-P., Fossum, E., Luche, H., Ardouin, L., Guilliams, M., Azukizawa, H., Bogen, B., Malissen, B., et al. (2011). Cutting edge: expression of XCR1 defines mouse lymphoid-tissue resident and migra-tory dendritic cells of the CD8+ type. J. Immunol. 187, 4411–4415.
van Dijk, D., Sharma, R., Nainys, J., Yim, K., Kathail, P., Carr, A.J., Burdziak, C., Moon, K.R., Chaffer, C.L., Pattabiraman, D., et al. (2018). Recovering gene interactions from single-cell data using data diffusion. Cell 174, 716–729.e27.
Durai, V., and Murphy, K.M. (2016). Functions of murine dendritic cells. Immunity 45, 719–736.
Eil, R., Vodnala, S.K., Clever, D., Klebanoff, C.A., Sukumar, M., Pan, J.H., Palmer, D.C., Gros, A., Yamamoto, T.N., Patel, S.J., et al. (2016). Ionic immune suppression within the tumour microenvironment limits T cell effector function. Nature 537, 539–543.
Eon Kuek, L., Leffler, M., Mackay, G.A., and Hulett, M.D. (2016). The MS4A family: counting past 1, 2 and 3. Immunol. Cell Biol. 94, 11–23.
Schroeder, M.E., Russo, S., Costa, C., Hori, J., Tiscornia, I., Bollati-Fogolı´n, M., Zamboni, D.S., Ferreira, G., Cairoli, E., and Hill, M. (2017). Pro-inflamma-tory Ca++-activated K+ channels are inhibited by hydroxychloroquine. Sci. Rep. 7, 1892.
Gaidt, M.M., Ebert, T.S., Chauhan, D., Ramshorn, K., Pinci, F., Zuber, S., O’Duill, F., Schmid-Burgk, J.L., Hoss, F., Buhmann, R., et al. (2017). The DNA inflammasome in human myeloid cells is initiated by a STING-Cell death program upstream of NLRP3. Cell 171, 1110–1124.e18.
Ghiringhelli, F., Apetoh, L., Tesniere, A., Aymeric, L., Ma, Y., Ortiz, C., Vermaelen, K., Panaretakis, T., Mignot, G., Ullrich, E., et al. (2009). Activation of the NLRP3 inflammasome in dendritic cells induces IL-1beta-dependent adaptive immunity against tumors. Nat. Med. 15, 1170–1178.
Gong, T., Yang, Y., Jin, T., Jiang, W., and Zhou, R. (2018). Orchestration of NLRP3 inflammasome activation by ion fluxes. Trends Immunol. 39, 393–406.
Table 2. Effect of BayK8644 on Echocardiographic Parameters
Vehicle BayK8644
Cardiac frequency (bpm) 457 ± 50 515 ± 35
Left ventricular telediastolic wall thicknesses (mm)
1.0 ± 0.0 1.1 ± 0.1
Left ventricular telediastolic diameter (mm)
3.2 ± 0.2 2.8 ± 0.2
Left ventricular ejection fraction (%) 82 ± 1 93 ± 2
E/A ratio 1.7 ± 0.1 1.5 ± 0.1
Isovolumic relaxation time (ms) 15.0 ± 0.0 18.8 ± 0.2
E-wave deceleration time (ms) 37.7 ± 1.8 33.4 ± 2.5
Hamilton, S.L., Yatani, A., Brush, K., Schwartz, A., and Brown, A.M. (1987). A comparison between the binding and electrophysiological effects of dihydro-pyridines on cardiac membranes. Mol. Pharmacol. 31, 221–231.
Hirata, E., Girotti, M.R., Viros, A., Hooper, S., Spencer-Dene, B., Matsuda, M., Larkin, J., Marais, R., and Sahai, E. (2015). Intravital imaging reveals how BRAF inhibition generates drug-tolerant microenvironments with high integrin b1/ FAK signaling. Cancer Cell 27, 574–588.
Jerby-Arnon, L., Shah, P., Cuoco, M.S., Rodman, C., Su, M.-J., Melms, J.C., Leeson, R., Kanodia, A., Mei, S., Lin, J.-R., et al. (2018). A cancer cell program promotes T cell exclusion and resistance to checkpoint blockade. Cell 175, 984–997.e24.
Karki, R., Man, S.M., and Kanneganti, T.-D. (2017). Inflammasomes and cancer. Cancer Immunol. Res. 5, 94–99.
Laoui, D., Keirsse, J., Morias, Y., Van Overmeire, E., Geeraerts, X., Elkrim, Y., Kiss, M., Bolli, E., Lahmar, Q., Sichien, D., et al. (2016). The tumour microen-vironment harbours ontogenically distinct dendritic cell populations with opposing effects on tumour immunity. Nat. Commun. 7, 13720.
Louvet, C., Chiffoleau, E., Heslan, M., Tesson, L., Heslan, J.-M., Brion, R., Be´riou, G., Guillonneau, C., Khalife, J., Anegon, I., et al. (2005). Identification of a new member of the CD20/FcepsilonRIbeta family overexpressed in toler-ated allografts. Am. J. Transplant. 5, 2143–2153.
Mangan, M.S.J., Olhava, E.J., Roush, W.R., Seidel, H.M., Glick, G.D., and Latz, E. (2018). Targeting the NLRP3 inflammasome in inflammatory diseases. Nat. Rev. Drug Discov. 17, 588–606.
Mun˜oz-Planillo, R., Kuffa, P., Martı´nez-Colo´n, G., Smith, B.L., Rajendiran, T.M., and Nu´n˜ez, G. (2013). K+
efflux is the common trigger of NLRP3 inflam-masome activation by bacterial toxins and particulate matter. Immunity 38, 1142–1153.
Murakami, T., Ockinger, J., Yu, J., Byles, V., McColl, A., Hofer, A.M., and Horng, T. (2012). Critical role for calcium mobilization in activation of the NLRP3 inflammasome. Proc. Natl. Acad. Sci. U S A 109, 11282–11287.
Newman, A.M., Liu, C.L., Green, M.R., Gentles, A.J., Feng, W., Xu, Y., Hoang, C.D., Diehn, M., and Alizadeh, A.A. (2015). Robust enumeration of cell subsets from tissue expression profiles. Nat. Methods 12, 453–457.
Pfirschke, C., Engblom, C., Rickelt, S., Cortez-Retamozo, V., Garris, C., Pucci, F., Yamazaki, T., Poirier-Colame, V., Newton, A., Redouane, Y., et al. (2016). Immunogenic chemotherapy sensitizes tumors to checkpoint blockade therapy. Immunity 44, 343–354.
Rathinam, V.A.K., and Fitzgerald, K.A. (2016). Inflammasome complexes: emerging mechanisms and effector functions. Cell 165, 792–800.
Riaz, N., Havel, J.J., Makarov, V., Desrichard, A., Urba, W.J., Sims, J.S., Hodi, F.S., Martı´n-Algarra, S., Mandal, R., Sharfman, W.H., et al. (2017). Tumor and microenvironment evolution during immunotherapy with Nivolumab. Cell 171, 934–949.e15.
Segovia, M., Louvet, C., Charnet, P., Savina, A., Tilly, G., Gautreau, L., Carretero-Iglesia, L., Beriou, G., Cebrian, I., Cens, T., et al. (2014). Autologous dendritic cells prolong allograft survival through Tmem176b-dependent antigen cross-presentation. Am. J. Transplant. 14, 1021–1031.
Sharma, P., and Allison, J. (2015). Immune checkpoint targeting in cancer ther-apy: toward combination strategies with curative potential. Cell 161, 205–214.
Sokolovska, A., Becker, C.E., Ip, W.K.E., Rathinam, V.A.K., Brudner, M., Paquette, N., Tanne, A., Vanaja, S.K., Moore, K.J., Fitzgerald, K.A., et al. (2013). Activation of caspase-1 by the NLRP3 inflammasome regulates the NADPH oxidase NOX2 to control phagosome function. Nat. Immunol. 14, 543–553.
Syn, N.L., Teng, M.W.L., Mok, T.S.K., and Soo, R.A. (2017). De-novo and acquired resistance to immune checkpoint targeting. Lancet Oncol. 18, e731–e741.
Woo, S.-R., Fuertes, M., Corrales, L., Spranger, S., Furdyna, M., Leung, M.K., Duggan, R., Wang, Y., Barber, G., Fitzgerald, K., et al. (2014). STING-depen-dent cytosolic DNA sensing mediates innate immune recognition of immuno-genic tumors. Immunity 41, 830–842.
STAR
+METHODS
KEY RESOURCES TABLE
REAGENT or RESOURCE SOURCE IDENTIFIER
Antibodies
Goat polyclonal anti-IL-1b R&D Systems Cat# AF-401-NA RRID:AB_416684
Control goat IgG R&D Systems Cat# AB-108-C RRID:AB_354267
Goat anti-mouse IL-17 polyclonal antibody R&D Systems Cat# AF-421-NA RRID:AB_354487
Mouse IgG2b anti-CTLA-4 BioXCell Cat# BE0164 RRID:AB_10949609
Mouse IgG2b isotype control BioXCell Cat# BE0086 RRID:AB_1107791
Rat IgG2a anti-PD-1 BioXCell Cat# BE0146 RRID:AB_10949053
Rat IgG2a isotype control BioXCell Cat# BE0089 RRID:AB_1107769
Anti-CD8a depleting antibody YTS 169.4 BioXCell Cat# BE0017 RRID:AB_10950145
TCRVb12 (MR11-1) BD Cat# 553300 RRID:AB_394768
TCRb (H57-597) BD Cat# 553174 RRID:AB_398534
TCRgd (GL3) BD Cat# 553178 RRID:AB_394689
CD27 (LG.3A10) BD Cat# 560691 RRID:AB_1727455
CD49b (DX5) BD Cat# 553856 RRID:AB_395092
NK1.1 (PK136) BD Cat# 557391 RRID:AB_396674
CD4 (RM4-5) BD Cat# 558107 RRID:AB_397030
CD8a (53-6,7) BD Cat# 552877 RRID:AB_394506
CD11b (M1/70) BD Cat# 553312 RRID:AB_398535
CD11c (HL3) BD Cat# 557401 RRID:AB_396684
CD19 (1D3) BD Cat# 557398 RRID:AB_396681
CD80 (16-10A1) BD Cat# 553769 RRID:AB_395039
CD86 (GL1) BD Cat# 553690 RRID:AB_394992
CD107a (1D4B) BD Cat# 558661 RRID:AB_1645247
IAb (AF6-120.1) BD Cat# 553551 RRID:AB_394918
Ly6C (AL-21) BD Cat# 553104 RRID:AB_394628
Ly6G (1A8) BD Cat# 551461 RRID:AB_394208
Foxp3 (FJK-16s) eBiosciences Cat# 17-5773-80 RRID:AB_469456
Rat IgG2a isotype control (eBR2a) eBiosciences 25-4321-81 RRID:AB_470199
Anti-caspase-1 (p20) (mouse) Adipogen Cat# AG-20B-0042 RRID:AB_2490248
Anti-IL-1b antibody (H-153) Santa Cruz Biotechnologies Cat# sc-7884 RRID:AB_2124476
RORgt (AFKJS-9) eBiosciences Cat# 17-6988 RRID:AB_1633425
TMEM176B Polyclonal Antibody Proteintech Cat# 19825-1-AP
RRID:AB_10638313
Anti-LR8 (TMEM176B) antibody Abcam Cat# ab103929 RRID:AB_10712259
Biological Samples
Colon cancer tissue array 90 tumor cases with survival information.
US Biomax, Inc Cat# HCol-Ade180Sur-04
Chemicals, Peptides, and Recombinant Proteins
TRIzol Reagent. Invitrogen Cat#15596026
M-MLV Reverse Transcriptase. Invitrogen Cat# 28025013
Random primers. Invitrogen Cat#48190011
Fast SYBR Green Master Mix. Applied Biosystems. Cat#4385612
Lipopolysaccharides from Escherichia coli 0111:B4 Sigma Cat# L4391
Nigericin Sigma Cat# N7143; CAS:28643-80-3
ATP Sigma Cat# 10127531001 CAS: 51963-61-2