HAL Id: hal-01529501
https://hal.archives-ouvertes.fr/hal-01529501
Submitted on 30 May 2017
HAL is a multi-disciplinary open access
archive for the deposit and dissemination of
sci-entific research documents, whether they are
pub-lished or not. The documents may come from
teaching and research institutions in France or
abroad, or from public or private research centers.
L’archive ouverte pluridisciplinaire HAL, est
destinée au dépôt et à la diffusion de documents
scientifiques de niveau recherche, publiés ou non,
émanant des établissements d’enseignement et de
recherche français ou étrangers, des laboratoires
publics ou privés.
Distributed under a Creative Commons Attribution| 4.0 International License
Sensitivity of the initiation of debris flow to initial soil
moisture
W. Hu, Q. Xu, G. H. Wang, T. W. J. van Asch, Pierre-Yves Hicher
To cite this version:
W. Hu, Q. Xu, G. H. Wang, T. W. J. van Asch, Pierre-Yves Hicher. Sensitivity of the
initia-tion of debris flow to initial soil moisture. Landslides, Springer Verlag, 2015, 12 (6), pp.1139-1145.
�10.1007/s10346-014-0529-2�. �hal-01529501�
W. Hu I Q. Xu I G. H. Wang I T. W. J. van Asch I P.-Y. Hicher
Sensitivity
of the initiation of debris flow to initial soil moisture
Abstract The initiation of debris flows is commonly attributed either to fluidization as a result of rainfall-induced landslides or to gully erosion induced by concentrated runoffs. A series of flume tests have been performed to show how the initial soil moisture influences the initiation of debris flows. At the start of each experiment, surface runoff was generated over loose granular deposits, triggering debris flows. These experimental debris flows enacted different scenarios according to the small variations among the initial soil moistures. In the loose granular deposits with initial soil moistures ranging from 1 to 5%, most runoff water could infiltrate and trigger a landslide, which accelerated within 1 s to speed over 1ms−1and then transformed into a debris flow. In the same soil deposits with initial moistures >5 or <1%, the debris flow was initiated by slow gully erosion with episodic events of dam-ming and breaching due to small-scale landslides occurring on the side-slopes of the erosion valley. The slope failures were not triggered by positive pore pressure but by a decrease in suction due to the wetting of the soil. This suction decrease in initially unsaturated slopes explains why the transformation of these slope failures into debris flows are due not only to an increase of pore pressure leading to soil liquefaction, which is one of the expected triggering mechanisms, but also to a loss of the cohesive strength of the soil.
Keywords Debris flow . Initial moisture . Runoff . Internal erosion
Introduction
It is well known that differing rainfall durations and patterns can affect the occurrence and features of debris flows in channels, but questions are usually raised as to what determines the initiation of scenarios. Can a small difference in the initial conditions cause the runoff to induce sharply differing types of debris flow (such as occurrence of outburst debris or slow sediment transport) in the channels? The distinction is important because the occurrence of outburst debris is much more catastrophic and more difficult to predict than the slow sediment transport.
Debris flow can be triggered by several different reasons, such as infiltration by rain water, infiltration and/or erosion by runoff water, dam break, slope instability, landslide encountering a stream or ponded water and entraining this, etc. Within all these triggering possibilities, the first two distinctive process are most common. In the first case, infiltrating rain triggers directly shallow landslides which may transform into debris flows (Marchi et al.2002; Guzzetti et al.2008; Staley et al.2012; Malet et al.2005; Papa et al.2012; Cascini et al. 2013). In the second case, a concentrated runoff triggers a sequence of processes which may generate debris flow (Takahashi
1978; Berti and Simoni2005). It is important to consider that both mechanisms have different hydrological triggering mechanisms and therefore different meteorological thresholds. In both processes, the mechanisms and thus the probability of transformation from slide into flows are important and unclear issues (Iverson et al.1997,2000;
Dai et al.1999; Gabet and Mudd2006; Klubertanz et al.2009; van Asch and Malet2009; Wang and Sassa2003).
In this paper, we will concentrate on the second group of triggering processes, which involves a runoff over loose soil. With-in this second group, the scale of debris flow development is determined by several factors such as the volume of loose material, material properties, slope gradient, and runoff volumes (Berti et al.
1999). The initial moisture content has been mentioned in many studies as an important factor determining the critical threshold for debris flows initiated by a surface runoff. This is because the initial moisture content determines the infiltration capacity of the soil, especially at the beginning of a rain event and, hence, the amount of runoff on the soil surface. On the other hand, the initial moisture also influences the shear strength of the soil (Fredlund et al.1978). Even if the importance of this effect on critical thresh-olds has not been widely analyzed, it is clear that the initial moisture content and, hence, the infiltration capacity influences the sequence and intensity of the triggering processes of debris flow. Since this effect has not been studied in detail, we will examine the effect of initial moisture content on the initiation and movement of debris flows by a series of flume tests.
The experimental setup and test procedure
To isolate the effect of the initial soil moisture content on the initiation mechanism of debris flows, we have conducted a series of 13 flume tests with different initial soil moistures (Table 1), without changing other soil properties, such as the bulk density, the soil texture, and the slope gradient. Some of these tests were duplicated to verify their repeatability.
A flume (Fig. 1) with a length of 2 m and a width of 1 m was used. The side-walls of the flume are made of transparent plexi-glass plates. The bottom was made to reproduce an impervious frictional contact by gluing calcareous grains on a rubber sheet. Four pressure sensors (Soilmoisture Probe 2011 F), which measure both the negative and positive pore water pressures (with capacity ranging from −100 to 100 kPa) were installed inside the soil layer at different depths. These pressure sensors were accompanied by six time-domain reflec-tometer (TDR) probes (ECH2O Decagon device) to measure the soil water content. TDR is an abbreviation of time-domain reflectometer, which is an electronic instrument that uses the time-reflectometry to characterize the soil properties, such as volumetric water content. The vertical slope surface move-ment was monitored by a laser displacemove-ment sensor (ZLDS100 ZSY Group, with resolution of 0.03 %FS). Data for each sensor were logged digitally at 70 mhz for the duration of each experiment. The materials for the flume tests were col-lected from the Wenjia gully, where a huge volume (5.67× 10⁶m3) of debris originating from the Qingping landslide (5× 10⁷m3) was deposited during the 2008 Wenchuan earthquake and a catastrophic debris flow (4.5×10⁶m3) occurred during later rainstorms (Xu et al. 2012; Olivares 2001). The lithology
of landslide area is limestone and the sampled materials include gravels, sands, silts, and clay. The angularity of the particles is classified as sub-angular (ASTM D2488-10). The specific gravity measured on the sampled materials is 2.72.
The material collected in site was dried and sieved, then the dry particles and the powder of clay were remixed to obtain the grading for the test, see Fig.2. It is difficult to maintain the control over a large experiment and make the soil homogenous in terms of the initial value of the soil, such as initial moisture content, suction, and density. Some methods were taken to make the initial value as homogeneous as possible.
For the homogeneity of the initial moisture and suction, the mixed particles were divided and put into different con-tainers. Then an amount of water was put into the containers according to the desired initial water content. The soil was carefully mixed with the water to ensure the homogeneity of the soil. And then a film was used to cover and seal the samples. The soil was stored for 24 h prior to the construc-tion of the model. We measured the water content of the slope at different depths with TDR; the value is nearly the same. In order to reduce the errors induced by the sample Table 1 List of tests
Test number Initial moisture (%) Saturation ratio (%) Initiation type 1(a) 0.02 0.1 Channel erosion 1(b) 0.02 0.1 Channel erosion 1(c) 0.02 0.1 Channel erosion 2 1 6 Landslide 3 3 12 Landslide 4 4 25 Landslide 5(a) 5 31 Landslide 5(b) 5 31 Landslide 6 5.5 34 Channel erosion 7 6 37 Channel erosion 8 7 43 Channel erosion 9 7.5 47 Channel erosion 10 8 50 Channel erosion 11 10 62 Channel erosion 12 12 74 Channel erosion 13 15 93 Channel erosion
All tests were carried out with a slope of 32°, discharge 0.00044 m3/s, and initial soil void ratio of 0.43 Container Flow controller TDR probe Tensiometer Model 1(2,3) IV 4 II I(III) 6 5 Sand paper 0 300 600 mm
The Flume Test System
IV(II) 4(2) 1 3 III 6 I Model 5
Fig. 1 Schematic plan of the flume and sensors. Positions of the time-domain reflectometer (TDR) for the measure of the volumetric water content and the tensiometer for the measure of pore pressure from−100 to 100 kPa
0 20 40 60 80 100 0.01 0.1 1 10 100 Passing in per cent age (%) Particle size (mm) Grading for the flume test
Grading in situ
Fig. 2 Grain size distributions of in situ and flume test samples. The material was collected at the top of so called 1300 platform in the Wenjia gully where a huge debris flow occurred after the Wenchuan earthquake
drying out during the preparation, we tried to construct the sample within 20 min and then carried out the test. We assumed that within 20 min, the loss of water was very small at the temperature of 20°. The initial saturation ratio for each test was summarized in Table 1. For the homogeneity of density, we used the moisture tamping method, and the ma-terials were compacted layer by layer with a thickness of 10 cm. The average initial void ratio for the sample is 0.43 and the relative density is 45 % with emax=0.561 and emin=
0.29. For the preparation of the tensiometer, the devices were
put into the vacuum chamber for half an hour for saturation. The tensiometers and TDR were installed at the surface of each layer and then buried with the soil.
To initiate the debris flow, a concentrated water flow supplied by a pump was used to provide the runoff and the water outlet was positioned at the back of the model, 25 cm above the surface of the soil. The discharge was controlled by a flow meter and a flow valve. The eroded materials were collected every 20 s, dried, and sieved to quantify the erosion.
0 100 200 0 200 400 600 Accu. er osi on ( k g) Time(s) Test 1 Test 2 Test 3 Repetitive test
32
o 3 0.00044 / Q m s R=109.0Ln(T)-455.0 R=102.0Ln(T)-409.6 R=114.0Ln(T)-445.5 FittingFig. 3 Comparison of accumulated erosion curves for three repetitive tests
87 s
Infiltration of water
(a)
115 s
Infiltration of water
Water began to leak out
(b)
137 s
Big fissure formed
(c)
139 s
Slope began to move
(d)
140 s
Fast movement
(e)
141 s
After the slide
Debris flow
(f)
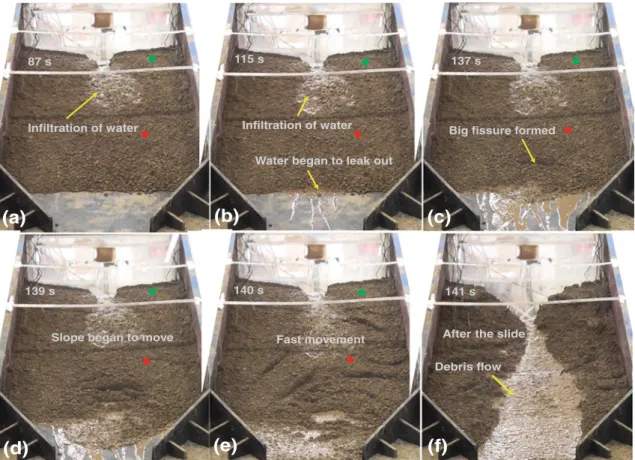
Fig. 4 a–f Initiation process of debris flow for the test with initial water content 5 %. The green point is the position for the monitoring of vertical displacement and the red point is for horizontal displacement. The particles in the mud flow before the fast movement is smaller than 0.05 mm, measured by laser particle size distribution analyzer -7 -6 -5 -4 -3 -2 -1 0 0 50 100 150 Settl e m e nt (m m ) Time (s)
Fig. 5 Soil surface settlements before the sliding of the slope. With the saturation of loose deposits, the slope presented a behavior of contraction. This contraction concentrated in the first 45 s
Test results
In order to test the repeatability, three tests with a slope of 32°, discharge of 0.00044 cm3/s, and initial moisture content
of 0.02 % were carried out. The erosion curve was depicted in Fig.3. As shown in Fig. 3, after the initiation of the debris flow, the cumulative erosion follows a logarithmic function, which can be described by Eq. 1:
R¼ ζIn Tð Þ−k0 ð1Þ
where R is the cumulative erosion (kg), T (s) is the time from the start of the test; ζ (kg−1) and k0 (kg) are constants.
We can define ζ as an erosion susceptibility parameter, influencing the amount of cumulative erosion with time. The value of ζ determines the scale of the debris flow in terms of mass (kg, see Eq. 1). The cumulative erosion curves are slightly different while the erosion susceptibility param-eter is more or less the same, which is acceptable for the flume tests.
The scenarios of debris flow initiation with differing soil mois-tures are sharply different. For the initial moisture from 1 to 5 %, in each of the five tests, the slope failed abruptly and accelerated within 1 s to speeds >1 m/s. Figure4 shows the process of the formation of a landslide which transforms into a debris flow for a test with an initial water content of 5 %. The process starts with the generation of runoff water with a discharge of 0.00044 m3/s. Almost all the water could infiltrate due to the high sorpetivity of this relatively dry soil (Fig.4a). The soil experienced a wetting collapse during the saturation leading to a settlement of the slope, as shown in Fig.5, while the settlement was measured by a laser distance sensor: the measuring point was marked by a green dot in Fig.4. After 115 s, the water began to leak out from the toe part, transporting small particles as shown in Fig. 4c; these particles were collected and measured by a laser particle size distribution analyzer, and the particle size was found to be smaller than 0.05 mm. After 137 s, a large fissure was formed firstly at the foot of the slope (see Fig.4c) and the slope started to move. A progres-sive failure of the slope could be observed; other fissures devel-oped uphill and opened up until the entire slope suddenly collapsed within 2 s with a speed of over 1 m/s, as shown in the Fig.4d, e. A complete fluidization of the soil mass was triggered after the collapse of the slope. Finally, a wide gully was created, as shown in Fig.4f. The vertical displacement of the slope is shown in Fig.6, and the target point for measuring the displacement was marked by a red dot in Fig.4. Very small displacements occurred before the collapse of the slope and the collapse itself lasted only 2 s.
The pore pressure and soil moisture monitored at differing locations are shown in Fig.7. With the infiltration of water, the sensors located in the upper part of the soil showed an increase of the water content and a decrease of the suction, leading to a progressive saturation or near saturation of the soil mass in the center part of the slope. The failure of the slope was triggered by the decrease in suction leading to a loss of cohesive strength within the saturated part of the soil mass. Another point which should be noted is the mechanism of fluidization of this shallow landslide. As discussed by Olivares2001and Iverson et al.2000, the fluidization of a shallow landslide is triggered by static liquefaction. However, the evidence of static liquefaction in this test is not very clear, since no sudden increase of pore pressure occurred at the moving moment, as presented by Eckersley1990and Daouadji et al.2011. So we assume that this fluidization process was concentrated at the lower part of the slope. Due to water infiltration, the lower part of the soil mass was fully saturated. Two simultaneous phenomena led to the instability and sudden sliding of the lower part of the slope: a loss of cohesive strength due to suction decrease, on the one hand, and an internal erosion due to seepage flow, on the other hand. The seepage forces were strong enough to wash away the finer particles, increasing the porosity of the soil and making it much more unstable. Eventually, this loss of strength led to the sudden failure of the lower part of the slope, causing the progres-sive collapse of the entire slope. The instability phenomenon has been ascertained by triaxial tests (Gajo2004; Sasitharan et al.1993; Lade1992), and eroded specimens have shown to be increasingly unstable (Chang and Zhang2013; Hicher2013; Hicher and Chang
2007).
At the beginning of the soil movement, all the sensors located outside of the moving body showed a regular decrease in moisture -20 20 60 100 D is p la c e me n t (mm) 0 69 138 s 138 139 140 2 s Time (s)
Fig. 6 Time series data of horizontal displacement. To reveal details of behavior during the 2-s failure period, the time axis is expanded
9 16 W a te r c o n te n t ( % ) Time (s) (1) (2) (3) (4) (5) (6) 0 138 207 276
Slope began to move
0 -3 -2 -1 0 1 P o re p re s s u re (k P a ) (II) (I) (III) (IV) Slope began to move 69 1.5
Fig. 7 Time series data of soil moisture content and water pressure. All the TDR probes begin with nearly the same value of 4 % of volumetric water content. For the tensiometer, the initial suction is from−1 to −2 kPa. All sensors recorded a loss of water during the quick movement of the slope
content and an increase in suction due to drainage towards the sidewalls of the gully created by the fluidized landslide (except TDR sensor No. 6 and tensiometer No. III, probably because they were located beneath the sliding surface in a part of the soil mass not much influenced by the sliding). During the movement, some sensors in the sliding body were removed (such as TDR No. 1).
The experimental process with an initial water content of 15 % is exemplified in Fig.8. In this test, the soil was nearly saturated at the initial state. Most of the supplied water was discharged as
surface runoff. The significant hydraulic force of the runoff and the high erodability of the wet soil due to a lower suction were sufficient to create a small erosion gully, as shown in Fig.8a, b. As a result of the drag off of abundant materials, a debris flow was directly initiated. At this stage, however, the volume of the debris flow was very small. As a result of continued incision and infiltra-tion of water into the loose deposits, both sides of the erosion gully became unstable and small landslides were initiated as shown in Fig. 8c. The gully was dammed by the landslide debris. The
Initiation of erosion gully
(a)
17 s Formation of erosion gully Debris flow(b)
60 s Instability(c)
162 sFig. 8 Initiation process for the test with initial water content of 15 %
Infiltration of water Water leaked out
with fine particles
(a)
200 s Fast movement of the slope(b)
205 s Erosion gully formed after the landslide(c)
207 s
Fig. 9 Initiation process for the test with initial water content of 3 %
80 s Initiation of erosion gully
(a)
90 s Formation of erosion gully Debris flow(b)
(c)
134 s Instabilities Debris flowlandslide dam was then breached by the runoff water. This sliding, damming, and breaching effect greatly increased the volume of the debris flow and largely widened and deepened the erosion gully. The two tests with the very dry soil also showed relatively high runoff figures. The cohesive strength of the soil is also very low which makes it, at least at the start, easily erodible by the shear stress generated by the runoff water. This explains why we obtain-ed the same initiation process as in the tests with the relatively high water content.
All the other four tests with the initial water contents ranging from 1 to 5 % presented nearly the same scenario, and the initia-tion mechanism can be categorized as “landslide induced”. The other eight tests with an initial water content ranging from 5.5 to 15 %, and three tests with nearly dry soil (initial moisture content 0.02 %) showed the same scenario for the initiation of a debris flow and the initiation mechanism can be categorized as“channel erosion induced”.
In order to provide more information that demarks the edges of two trends of initiation patterns, the initiation process of the test with initial water content of 3, 6, and 0.02 % are shown in Figs.9,
10, and11. The initiation patterns of the debris for each test are summarized in Table1.
Under both types of triggering processes, the instability of the slope plays an important role in the primary or secondary phase. This instability was not caused by the generation of high positive pore pressures but by internal seepage erosion and a decrease in
soil suction through wetting causing a decrease in the strength of the soil. This has also been shown by the Soil Water Retention Curve (SWRC) given in Fig.12. The curves were obtained by two different methods: one was measured by ceramic plate extractor, the other one was obtained by measuring the change of suction and water content of tested soil in a small container. A tensiometer was positioned in the middle of the soil, and the water content was changed by spraying the water on the soil. Each time, the container was sealed for about 2 days to get the equilibrium of the suction. Then the water content was obtained by weighing the container. The SWRC measured by two methods agree very well with each other. They show a significant increase in suction when the soil moisture content is lower than 5 % and an almost constant low suction when the soil moisture content is greater than 5 %. The cohesive strength of the soil being a direct function of the suction, a slight increase in soil moisture above 5 %, was probably enough, for the selected slope gradient, to initiate failure. For very dry soils, the amount of water in the pores of the soil is not sufficient to create a homogeneous value of the suction, and therefore, the retention curve cannot be measured with the same procedure. Previous results (Hicher and Chang2007) have shown that the suction will pass by a maximum and then decrease to 0 for completely dry soils. A maximum value of the suction around 10–15 kPa can be expected for such soil.
Summary and conclusions
The abovementioned test results revealed that the infiltration capacity of loose source materials controls the initiation and movement of debris flows. The abrupt failure of the soil layer leading to a quick debris flow can be triggered if an abundant amount of runoff water can infiltrate into the soil layer, causing internal erosion within this soil layer. A similar process may occur during a heavy rainfall on open slopes, and especially in channels with loose materials, where runoff can concentrate. Two main process sequences leading to debris flows could be observed in our flume tests. Most of the runoff water flowing over relatively dry soils with a high initial infiltration capacity will infiltrate. The infiltrating water will induce a landslide and the fragmentized material mixed with external runoff water immediately generates a debris flow. When the flashfloods arrive on wetter soils (>5 %) or almost dry soils, the initial infiltration capacity (sorpetivity) is much lower, so that much more runoff water could be generated. In this case, the debris flow development shows different stages
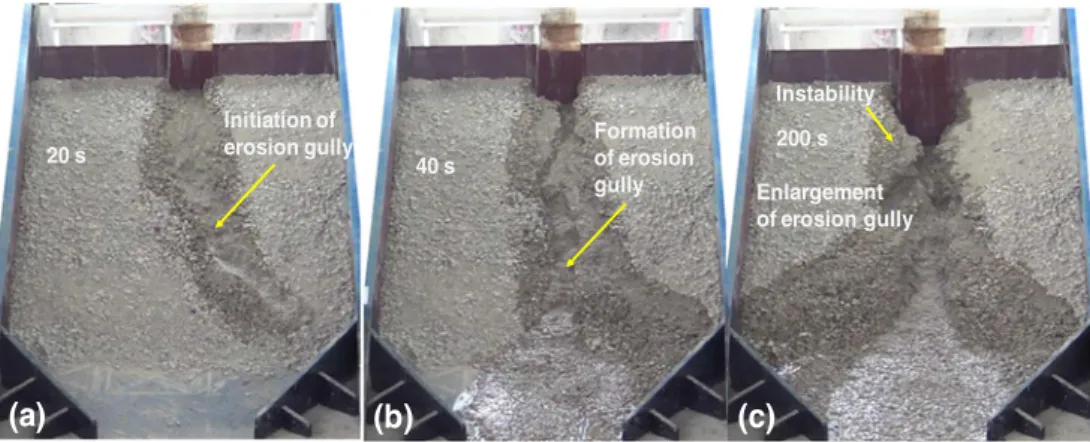
20 s Initiation of erosion gully
(a)
40 s Formation of erosion gully(b)
Enlargement of erosion gully(c)
200 s InstabilityFig. 11 Initiation process for the test with initial water content of 0.02 %
0 4 8 12 0 5 10 15 Suction (k Pa) Water content (%) Measured by Ceremic plate extractor Measured by tensiometer
Channel erosion induced Landslide induced
Channel erosion induced
Fig. 12 SWRCs for the tested soil. The grading and initial density of the sample is the same as that of the flume test
starting with a gully incision and consequent side wall collapses, damming, and breaching.
In addition, we could observe that a slope failure plays a role in both initiation and movement processes. Landslides were trig-gered due to a drop in cohesive strength which, according to the SWRCs, may occur after a relatively small wetting of the soil when the initial water content is equal or higher than 5 %. Moreover, internal erosion may have contributed to the slope failure process by increasing the porosity of the soil by wash out fines and, therefore, reducing its initial strength.
Acknowledgments
This research is financially supported by National fundamental scientific research grant of China (No. 41102188); public welfare project from the Ministry of Land and Resources of People’s Republic of China (2013–11122); and the National Science Found for Distinguished Young Scholars of China (Grant No. 41225011).
References
Berti M, Simoni A (2005) Experimental evidences and numerical modeling of debris flow initiated by channel runoff. Landslides 2(3):171–182
Berti M, Genevois R, Simoni A, Tecca PR (1999) Field observations of a debris flow event in the Dolomites. Geomorphology 29(1):265–274
Cascini L, Sorbino G, Cuomo S, Ferlisi S (2013) Seasonal effects of rainfall on the shallow pyroclastic deposits of the Campania region (southern Italy). Landslides. doi:10.1007/ s10346-013-0395-3
Chang DS, Zhang LM (2013) Critical hydraulic gradients of internal erosion under complex stress states. J Geotech Geoenviron 139(1):1454–1467
Dai FC, Lee CF, Wang SJ (1999) Analysis of rainstorm-induced slide-debris flows on natural terrain of Lantau Island, Hong Kong. Eng Geol 51(4):279–290
Daouadji A, Darve F, Al Gali H, Hicher PY, Laouafa F, Lignon S, Nicot F, Nova R, Pinheiro M, Prunier F, Sibille L, Wan R (2011) Diffuse failure in geomaterials: experiments, theory and modelling. Int J Numer Anal Method 35(1):1731–1773
Eckersley D (1990) Instrumented laboratory flowslides. Geotechnique 40(1):489–502 Fredlund DG, Morgenstern NR, Widger RA (1978) The shear strength of unsaturated soils.
Can Geotech J 15(1):313–321
Gabet EJ, Mudd SM (2006) The mobilization of debris flows from shallow landslides. Geomorphology 74(1):207–218
Gajo A (2004) The influence o f system compliance on collapse of triaxial sand samples. Can Geotech J 41(1):257–273
Guzzetti F, Peruccacci S, Rossi M, Stark CP (2008) The rainfall intensity–duration control of shallow landslides and debris flows: an update. Landslides 5(1):3–17
Hicher PY (2013) Modelling the impact of particle removal on granular material behaviour. Geotechnique 63(1):118–128
Hicher PY, Chang CS (2007) A microstructural elastoplastic model for unsaturated granular materials. Int J Solids Struct 44(1):2304–2323
Iverson RM, Reid ME, LaHusen RG (1997) Debris-flow mobilization from landslides. Ann Rev Earth Planet Sci 25(8):85–138
Iverson NR, LaHusen RG, Logan M, Mann JE, Brien DL (2000) Acute sensitivity of landslide rates to initial soil porosity. Science 290(1):513–516
Klubertanz G, Laloui L, Vulliet L (2009) Identification of mechanisms for landslide type initiation of debris flows. Eng Geol 109(1):114–123
Lade PV (1992) Static instability, liquefaction of loose fine sandy slopes. J Geotech Geoenviron Eng ASCE 118:51–71
Malet JP, Laigle D, Remaître A, Maquaire O (2005) Triggering conditions and mobility of debris flows associated to complex earth flows. Geomorphology 66(1–4):215–235 Marchi L, Arattano M, Andrea M, Deganutti AM (2002) Ten years of debris-flow
monitoring in the Moscardo Torrent (Italian Alps). Geomorphology 46(3):1–17 Olivares L (2001) Static liquefaction: an hypothesis for explaining transition from slide to
flows in pyroclasticsoils. In: TC11 landslide conference on transition from slide to flow—mechanisms and remedialmeasures, Trabzon, Turkey
Papa MN, Medina V, Ciervo F, Bateman A (2012) Estimation of debris flow critical rainfall thresholds by a physically-based model. Hydrol Earth Syst Sci 9:12797–12824 Sasitharan S, Robertson PK, Sego DC, Morgenstern NR (1993) Collapse behaviour of sand.
Can Geotech J 30:569–577
Staley DM, Kean JW, Cannon SH, Schmidt KM, Laber JL (2012) Objective definition of rainfall intensity-durationthresholds for the initiation of post-fire debris flows in southern California. Landslides 10(1):547–562
Takahashi T (1978) Mechanical characteristics of debris flow. Hydraul J 104(1):1153–1169 van Asch TWJ, Malet JP (2009) Flow-type failures in fine-grained soils: an important aspect in landslide hazard analysis. Nat Hazards Earth Syst Sci 9(1):1703–1711
Wang GH, Sassa K (2003) Pore pressure generation and movement of rainfall-induced landslides: effects of grain size and fine particle content. Eng Geol 69(1):109–125
Xu Q, Zhang S, Li WL, Van Asch TWJ (2012) The 13 August 2010 catastrophic debris flows after the 2008 Wenchuan earthquakes, China. Nat Hazards Earth Syst Sci 18:596–608
W. Hu
:
Q. Xu ()):
T. W. J. AschState Key Laboratory of Geo-Hazard Prevention and Geo-Environment Protection, Chengdu University of Technology,
Chengdu, 650023 People’s Republic of China e-mail: xuqiang_68@126.com
G. H. Wang
Disaster Prevention Research Institute, Kyoto University,
Kyoto, Japan
T. W. J. Asch
Faculty of Geosciences, Utrecht University,
Heidelberglaan 2, 3584 CS Utrecht, The Netherlands
P.-Y. Hicher
LUNAM University, Ecole Centrale de Nantes, CNRS UMR 6183, Nantes, France
T. W. J. van Asch